Journal of Learning Disabilities 2016, Vol. 49(1) 77 –96
© Hammill Institute on Disabilities 2014 Reprints and permissions:
sagepub.com/journalsPermissions.nav DOI: 10.1177/0022219414528540 journaloflearningdisabilities.sagepub.com
Article
Previous studies and meta-analyses have shown that read- ing interventions can be an effective means to improve chil- dren’s reading skills in the short-term (e.g., Bus & van Ijzendoorn, 1999; Ehri, Nunes, Stahl, & Willows, 2001;
Ehri, Nunes, Willows, et al., 2001; Suggate, 2010; Swanson, Hoskyn, & Lee, 1999). However, it is clearly of great inter- est to both researchers and practitioners to move beyond the study of short-term effects to understand not only whether reading interventions result in longer-term gains (Blachman et al., 2014), but also which features of reading interven- tions relate to intervention outcomes.
Reading Interventions and Reading Problems
The etiology of reading problems is diverse and controver- sial. Generally, it is accepted that children can experience difficulty with some combination of (a) semantic and (b) phonological aspects of reading (Coltheart, Curtis, Atkins,
& Haller, 1993; Gough & Tunmer, 1986; Hatcher, Hulme,
& Ellis, 1994; Nation & Coxsey, 2009). Difficulty and diversity in categorizing reading problems occur through disagreement about whether discrepancy definitions are appropriate or whether low reading achievement alone suf- fices (Bell, McCallum, & Cox, 2003; Ferrer, Shaywitz, Holahan, Marchione, & Shaywitz, 2010; Harm &
Seidenberg, 1999; Tunmer & Greaney, 2009). Still further distinctions arise from a response to intervention perspec- tive (e.g., Scholin & Burns, 2012). Here, no attempt is made
to weigh in on this debate, but to gather existing categories from research and subject these to meta-analytical investi- gation. Based on reading research conducted in the past decades (e.g., see studies cited in the appendix) and placing precocious readers to one side (Stainthorp & Hughes, 2004), the following samples are frequently mentioned in reading intervention literature: (a) normal readers; (b) at-risk read- ers, usually either reading below the 50th percentile or orig- inating from socially or economically disadvantaged groups including second language learners; (c) low-performing readers, usually reading below the 25th percentile; and (d) reading disabled students, either reading below the 10th percentile or those who have been diagnosed as having a reading–IQ discrepancy of one standard deviation. Given the centrality of reading to all citizens in society, a fifth cat- egory might be added, whereby children have a learning or cognitive disability.
Previous work has begun to investigate the effect of sam- ple risk status on reading intervention effectiveness in the short term (e.g., Ehri, Nunes, Willows, et al., 2001; Suggate, 2010; Swanson et al., 1999), but has provided mixed results
1University of Regensburg, Germany Corresponding Author:
Sebastian P. Suggate, Department of Education, Alanus University, Villestrasse 3, 53347 Alfter near Bonn, Germany.
Email: Sebastian.Suggate@alanus.edu
A Meta-Analysis of the Long-Term Effects of Phonemic Awareness, Phonics, Fluency, and Reading Comprehension Interventions
Sebastian P. Suggate, PhD
1Abstract
Much is known about short-term—but very little about the long-term—effects of reading interventions. To rectify this, a detailed analysis of follow-up effects as a function of intervention, sample, and methodological variables was conducted. A total of 71 intervention-control groups were selected (N = 8,161 at posttest) from studies reporting posttest and follow- up data (M = 11.17 months) for previously established reading interventions. The posttest effect sizes indicated effects (dw
= 0.37) that decreased to follow-up (dw = 0.22). Overall, comprehension and phonemic awareness interventions showed good maintenance of effect that transferred to nontargeted skills, whereas phonics and fluency interventions, and those for preschool and kindergarten children, tended not to. Several methodological features also related to effect sizes at follow- up, namely experimental design and dosage, and sample attrition, risk status, and gender balance.
Keywords
reading intervention, long-term, comprehension, decoding, phonics, phonemic awareness, fluency
and, with regard to long-term effects, virtually no results.
For example, Ehri, Nunes, Stahl, et al. (2001) found that phonics helped younger at-risk readers more than younger readers with a more severe impairment, whereas phonemic awareness helped all readers equally (Ehri, Nunes, Willows, et al., 2001). In terms of comprehension interventions, these have been shown to be effective for older disabled students, in particular (Talbott, Wills, & Tankersley, 1994; Wanzek, Vaughn, Kim, & Cavanaugh, 2006). Considering both com- prehension and phonetic-decoding interventions together, Suggate (2010) did not find that at-risk or more struggling readers differentially benefitted; however, he included only disadvantaged readers, whereas including normally achiev- ing readers provides an important reference point in decid- ing how effective interventions for disadvantaged readers are. Of interest, Scholin and Burns (2012) found no links between preintervention level and postintervention growth on various reading tests, suggesting that risk status deter- mined at pretest might not relate to responsiveness to inter- vention. In summary, evidence indicates that reading interventions generally benefit all readers, although research is needed investigating effects at a more long-term follow- up to test whether and how different readers respond to reading intervention.
Intervention Type
Previous meta-analyses suggest that, in particular, phone- mic awareness and phonics interventions are particularly helpful for younger children (Bus & van Ijzendoorn, 1999;
Ehri, Nunes, Stahl, et al., 2001; Ehri, Nunes, Willows, et al., 2001). Consistent with Ehri, Nunes, Stahl, et al. (2001), phonological awareness interventions are defined as those that increase children’s awareness of the sounds at the word level (e.g., dig, dug, dog). Phonemic awareness interven- tions target awareness of the sounds (i.e., phonemes) com- posing words (e.g., “cat” as /k/ /a/ /t/). Accordingly, phonemic awareness is more specific to reading because this often requires decoding words at the phoneme level.
Phonics interventions teach associations between phonemes and orthography, thereby they differ from pure phonemic awareness interventions in that they directly incorporate let- ters or text. Fluency interventions target “the ability to read with speed and fluency” (Therrien, 2004, p. 252) and gener- ally include repeated reading, tutoring, or peer-reading activities (Fuchs & Fuchs, 2005).
Turning to interventions with a lesser focus on phoneme and text level decoding, reading comprehension interven- tions provide “specific procedures that guide students to become aware of how well they are comprehending as they attempt to read” (National Reading Panel, 2000, pp. 4–39).
Typical activities in reading comprehension interventions, involve reflection, prior knowledge, question generation, pictorial cues, identifying themes, inferential thinking, summarization, and story structure (Suggate, 2010). Such
comprehension interventions have also been shown to relate positively to intervention outcomes (Elbaum, Vaughn, Hughes, & Moody, 2000; National Early Literacy Panel, 2008; National Reading Panel, 2000; Suggate, 2010;
Swanson et al., 1999; Talbott et al., 1994). Typically, com- prehension interventions are provided to older students who can already decode; however, one notable exception is Reading Recovery (Center, Wheldall, Freeman, Outhred, &
McNaught, 1995) and similar interventions based on a whole language approach (Suggate, 2010). These interven- tions focus on teaching strategies to infer both word and sentence meaning and also to decode words based on sur- rounding contextual information. A further feature of these early comprehension interventions is that sound-to-spelling instruction is either absent altogether or conducted in an incidental manner (Buckingham, Wheldall, & Beaman, 2012; Tunmer, Chapman, & Prochnow, 2004).
Of interest, the phonological linkage hypothesis (Hatcher, Hulme, & Ellis, 1994) predicts that phonics inter- ventions would show an advantage of phonemic awareness interventions, by virtue of their providing explicit links between phonemes and words—a hypothesis that has not yet been born out by short-term meta-analytical reviews (see Ehri, Nunes, Stahl, et al., 2001; Ehri, Nunes, Willows, et al., 2001). However, it is conceivable that skills instructed in one intervention type or the other might show differential transfer effects and maintenance to follow-up, if for exam- ple they are less able to be integrated into the reading pro- cess, or if they represent skills that children acquire in the interim without the intervention (e.g., Paris, 2005).
Suggate (2010) grouped the above reading interventions into two categories, namely (a) phonetic decoding, which contained phonological, phonemic, phonics, and fluency interventions, and (b) comprehension interventions, includ- ing whole-language approaches. Of interest, it was found that phonetic-decoding interventions were more effective for children in kindergarten and Grade 1, with comprehen- sion interventions more effective from around Grade 3 onward with both being helpful for struggling readers.
Crucially, Suggate estimated that only about 18% of such intervention studies provide long-term follow-up data, which did not provide for a sufficient sample size to sys- tematically test the role of moderator variables, in particular intervention type. Accordingly, more research into the long- term effects of phonemic awareness, phonics, fluency, and comprehension reading interventions is needed—ideally via meta-analysis because this better accounts for Type II error and allows exploration of moderator variables (Hunter
& Schmidt, 2004).
Intervention Features
In addition to it being important to examine the long-term effects of reading interventions, it may prove insightful to examine the influence of practical intervention features,
such as the necessary instructor–student ratio, duration of the intervention, and whether booster interventions help.
Instructor–student ratio. In the United States, the risk status of the readers often determines the intensity of reading inter- vention that they receive. For example, Tier III interventions typically targeting the lowest 10% of readers are often deliv- ered with an instructor–student ratio of 1:1, whereas at-risk readers between the 10th and 25th percentiles typically receive small-group interventions (Scholin & Burns, 2012).
Accordingly, in part to justify this practice, an important question to resolve is whether instructor–student ratio affects intervention outcomes, again with a long-term focus. To illustrate the point, if small group interventions were as effective as individual interventions, then resource alloca- tion could be accordingly optimized by reaching a greater number of students with the same number of teachers. Gen- erally, meta-analyses indicate no difference in effect size depending on whether instruction was delivered in small groups or individually (Ehri, Nunes, Willows, et al., 2001;
Elbaum et al., 2000; Suggate, 2010; but cf. Ehri, Nunes, Stahl, et al., 2001); however, little is known about the effect of instructor–student ratio on long-term effect size.
Intervention administrator. Effective implementation of interventions depends not only on the content but also on the administrator (Marulis & Neuman, 2010). At a practical, financial level, the requisite qualifications for successful implementation of interventions is important. Internation- ally, a number of different intervention administrators have been employed, namely teaching assistants (Ryder, Tunmer,
& Greaney, 2008) or paraeducators (Vadasy & Sanders, 2010), especially trained interveners (e.g., Center et al., 1995), regular classroom teachers (e.g., Elbaum et al., 2000), student peers (Fuchs & Fuchs, 2005), or computers (Cheung & Slavin, 2012). Finally, a well-documented phe- nomenon is that researcher-administered interventions tend to result in larger effect sizes (e.g., Dignath & Buttner, 2008; Ehri, Nunes, Willows, et al., 2001) and computer-led interventions smaller effects (Cheung & Slavin, 2012; Ehri, Nunes, Willows, et al., 2001). Conceptually, meta-analyses not taking sufficient account of intervention administrator run the risk of conflating administrator effects with inter- vention effects and accordingly run the risk of leading to false policy recommendations.
Intervention length and booster interventions. It is surprising that intervention length is seldom a significant predictor of intervention effect size in meta-analyses (e.g., Suggate, 2010). One possibility for this finding is that interventions have too narrow of a focus, such that those focusing specifi- cally on one domain, especially if the targeted skills are highly constrained (e.g., Paris, 2005), might be unable to drive further benefits beyond a certain point saturation
point. Conversely, many interventions now contain a mixed approach (see the appendix), and most include well-estab- lished outcome measures unlikely to be affected by ceiling effects. In addition, previous meta-analyses (e.g., Ehri, Nunes, Stahl, et al., 2001; Ehri, Nunes, Willows, et al., 2001; Suggate, 2010) have coded dosage of the intervention condition only, which ignores that in many studies, the con- trol children receive an intervention, sometimes of the same duration (e.g., Antoniou & Souvignier, 2007; Fälth, Gus- tafson, Tjus, Heimann, & Svensson, 2013; Gunn, Smolkowski, & Vadasy, 2011). Thus, raw dosage of the intervention condition may be contaminated by not consid- ering the dosage of the control group. Furthermore, some studies include booster interventions (Coyne, Kame’enui, Simmons, & Harn, 2004), which also need to be accounted for in estimating effect sizes.
Methodological Factors Affecting Effect Size
In addition to there being a lack of knowledge on the long- term effects of reading interventions with respect to inter- vention type, administrator, sample, and instructor–student ratio, we also lack understanding of possible methodologi- cal and conceptual moderator effects on intervention out- come at follow-up.
Methodological quality. In assessing the quality of (clinical) intervention studies, indices have been developed that focus on randomization, attrition, and blindness (Jadad et al., 1996). Although it is not possible to ensure administrator blindness while administering reading intervention, researchers’ monitoring of treatment fidelity to some extent acts as a proxy because both ensure adherence to protocol.
Furthermore, sample attrition and randomization are cer- tainly key variables to consider in intervention research.
Specifically, it is conceivable that attrition inflates effect size to follow-up as treatment nonresponders may opt out of the intervention. Equally plausible is that dissatisfied chil- dren in the control group seek out additional reading sup- port, thus reducing effect size at follow-up; however, because assignment usually occurs at the class level in read- ing intervention studies, the latter case is less likely. With regard to experimental design, quasi-experimental designs have tended to produce greater effect sizes than studies employing random assignment (e.g., Cheung & Slavin, 2012; Suggate, 2010).
Moreover, it is crucial to consider sample size—not just for the calculation of weighted effect sizes—but because of the danger of publication bias (e.g., Hunter & Schmidt, 2004). Publication bias places a particular threat to follow- up investigations from two angles. First, it is highly unlikely that researchers of unsuccessful interventions at posttest would then invest the considerable time and effort required to conduct a follow-up assessment. Second, it seems
unlikely that researchers who do collect follow-up data but find that their intervention did not result in positive effects would be motivated to publish their work; and even if they were, given the difficulty in interpreting null findings in fol- low-up studies often suffering from high attrition rates, such work may not pass muster during the peer-review process.
Skill constraint. In addition, it has been suggested that some reading skills follow a more typical and short-lived learning curve trajectory, quickly reaching a ceiling in both their mastery and contribution to reading (Paris, 2005). Accord- ingly, it might be expected that improvements in more con- strained skills—such as word decoding, alphabet knowledge, phonemic awareness—are easier to exert than on less-constrained measures of skills such as reading com- prehension. Because more constrained skills can, by defini- tion, exhibit lesser improvement, these might lead to smaller follow-up effect sizes, particularly as the control group sub- sequently make developmental gains postintervention.
Therefore, one possibility that needs testing is whether the less-constrained skills of reading comprehension (Paris, 2005), reading of phonetically noncontrolled text, and spell- ing measures, thanks to English’s irregular orthography (Seymour, Aro, Erskine, & COST Action Network, 2003), show greater follow-up effect sizes than more constrained alphabetic and decoding measures—particularly over the long term, as more time allows more children the opportu- nity to reach ceiling on constrained skills.
Transfer effects. It is crucial to understand the effects of reading interventions on long-term reading outcomes, not merely on constructs targeted by the intervention. It is expected that phonics interventions will exert large improvements on decoding and phonemic awareness mea- sures, by virtue of these skills being finite and attainable with a low ceiling. It is not surprising that short-term effects of, for example, phonemic interventions indicate large effects on phonemic awareness outcomes (e.g., dw = 1.11;
Ehri, Nunes, Willows, et al., 2001). To understand transfer to broader reading skills, it is still unsatisfactory to look simply at short-term effects on nontargeted skills, because long-term, generalizable effects are sought. Thus, phonics interventions and comprehension interventions must show effects on reading and reading comprehension, not merely on targeted skills such as segmenting or comprehension strategy use. Again, definitive answering of this question requires examination of follow-up data.
Summary. Research is needed that examines the long-term effect sizes of reading interventions, particularly with respect to whether key variables such as intervention type, administration, and sample risk status play a role. Indeed, previous meta-analyses have reported long-term effects of phonemic awareness, phonics, fluency, and reading com- prehension interventions, but these have tended to focus on
one intervention type (Bus & van Ijzendoorn, 1999; Ehri, Nunes, Stahl, et al., 2001; Ehri, Nunes, Willows, et al., 2001) or target sample (Suggate, 2010; Swanson et al., 1999), such that the number of studies reported has been too low to provide a reliable estimation. Moreover, such an analysis has the potential to test whether intervention and methodological characteristics play a role in determining successful intervention.
Current Study
This article reports the results of a meta-analytical test of experimental and quasi-experimental reading interventions focusing on phonemic awareness, phonics, fluency, and comprehension approaches that include a long-term follow- up postintervention. Needless to say, inclusion of only these interventions does not mean that other interventions are ineffective, but rather that the evidence base for short-term effects (Bus & van Ijzendoorn, 1999; Ehri, Nunes, Stahl, et al., 2001; Ehri, Nunes, Willows, et al., 2001; Suggate, 2010;
Talbott et al., 1994) is sufficient to begin to investigate fol- low-up effects. In addition to coding intervention type, sample risk status and methodological and intervention fea- tures were coded to shed light on reasons for intervention effect size changes from posttest to follow-up.
Research Questions
Consistent with previous work, it was expected that the interventions would show positive short-term effect sizes that would decrease to follow-up. In addition to this hypoth- esis and given the availability of studies looking in a nuanced way at long-term effects, the following research questions were formulated.
1. What are the effect sizes for normal, at-risk, and low readers and reading disabled readers from posttest to follow-up?
2. To what degree do phonemic awareness, phonics, fluency, comprehension, and mixed interventions result in different effect sizes on different outcome measures (i.e., transfer effects)?
3. To what extent do sample characteristics, including grade, gender, and intervention language, relate to follow-up effect size?
4. How do the methodological quality indicators of sample attrition, experimental design, treatment fidelity, and sample size with respect to publication bias, influence effect size?
5. How do the intervention characteristics of interven- tion length and administrator (i.e., preschool teacher, trained intervener, computer, tutor, experimenter, class teacher), instructor–student ratio, months to follow-up, and the presence of a booster interven- tion relate to effect size?
Method Procedure
Literature search and article screening. To reduce the likeli- hood of publication bias, both published peer-reviewed and nonpublished studies were considered. A three-tiered approach to searching for studies was taken. In the first, four sets of terms (listed below) were entered into both Psy- cINFO and ERIC. Within each set the OR command was used, and between sets the AND command was used to combine the data. The first search was conducted in 2010 and restricted to include articles published after 1980 and to samples up to Grade 7.
The search terms were, for Set 1, reading: reading, read- ing ability, reading fluency, reading strategies, reading achievement, oral reading, reading development, reading intervention, reading education, school-based intervention, phonics, phonemic awareness, reading comprehension, repeated reading, remedial reading, and reading recovery;
for Set 2, design features: control group, reading-matched control, experimental, quasi-experimental, between-sub- jects, between-groups, randomized, randomized-control, design, random assignment, and treatment; for Set 3, met- rics: reading measures, reading skills, reading speed, read- ing accuracy, effect size, academic achievement, vocabulary, grammar, syntax, and language; for Set 4, follow-up mea- surement: long-term, medium-term, follow-up, posttest, longitudinal, period, and maintained.
The PsycINFO and ERIC searches identified 557 and 508 articles, respectively, which had been written between 1980 and 2010. The abstracts of these articles were checked to see whether the article (a) was a reading intervention as here defined with a phonetic, decoding, comprehension, or fluency focus, (b) included a follow-up assessment, and (c) contained at least one control or comparison group. This narrowed the number of articles selected to 54 unique arti- cles, once overlapping entries from the PsycINFO and ERIC searches were removed. Second, a search of the refer- ence sections of four previous meta-analyses that utilized similar interventions as those investigated here was con- ducted (Bus & van Ijzendoorn, 1999; Ehri, Nunes, Stahl, et al., 2001; Ehri, Nunes, Willows, et al., 2001; Suggate, 2010;
Wanzek et al., 2006). These, once the abstracts were checked, netted a further 21 articles selected for closer consideration.
To particularly thoroughly canvass recent studies con- ducted since the last published meta-analysis (i.e., Suggate, 2010) and also those published after the first search in 2008, a third search with expanded terms focused on the last 10 years (counting back from October 2013). An expanded set of terms were used to increase the probability of hits, namely, for Set 1: peer tutoring, peer assisted, phonics, strategy instruction, phonological awareness, early reading,
supplemental instruction, and fluency; for Set 2: computer assisted, computer, and instructional support; for Set 3, word reading, decoding, phonemic awareness, and spelling.
The term reading recovery was removed from this search because, as alluded to by an anonymous reviewer, it was the only proper noun referring to a specific intervention. In ERIC, this search was limited to preschool, elementary school studies published in English, German, or French as journal articles, conferences papers, speeches/meetings, reports, dissertation theses, doctoral theses, master’s theses, books, collected works, and proceedings, encompassing the time from 2010 to 2013.
This broader PsycINFO search identified 880 abstracts and the equivalent ERIC search, but restricted to the last 3 years resulted in 134 articles. Of these, the vast majority, 72.05% and 77.87%, respectively, were rejected out of hand because they did not contain a reading intervention design.
Articles were examined more closely and coded by the author. During this process, of the remaining articles, most were dropped, the reasons for which were as follows: (a) studies did not have a posttest with follow-up design (61.28%), (b) did not contain a matched or randomly assigned control group (36.84%), (c) did not qualify as a reading intervention as here defined (7.14%), (d) were too old (5.64%), or (e) were published in a language other than English or German (1.25%). Further studies were excluded if there was insufficient statistical information and the authors could not be contacted, or the data analysis was conducted at a classroom level instead of at the individual student level or contained self-selected assignment to groups without reporting pretest scores. Only one study that was not published in a peer-reviewed journal potentially satisfied inclusion criteria but was excluded because it would not be possible with only one study to examine the independent variable of publication outlet. Therefore, this meta-analysis represents only peer-reviewed articles.
Article coding
Intervention outcome. Outcome variables were collected for prereading, reading, reading comprehension, and spell- ing measures, consistent with previous meta-analyses (Ehri, Nunes, Stahl, et al., 2001; Ehri, Nunes, Willows, et al., 2001; Suggate, 2010).
Prereading measures. Measures were classified as pre- reading if they targeted phonological or phoneme aware- ness (to the exception of word repetition measures), letter naming, sounding out letters or words, and pseudoword or phonetically controlled word reading. Such measures included the Test of Phonological Processing (Wagner, Torgesen, & Rashotte, 1999), Phonemic Segmentation Flu- ency, Letter–Sound Identification, Letter Naming Fluency (Good & Kaminski, 2003), and Woodcock Word Attack (Woodcock, 1998).
Reading measures. Reading measures were those that included word reading, when this was not confined to phonetically controlled words, passage reading, and read- ing accuracy scores. Examples include reading book level, the Gray Oral Reading Test accuracy scores (Wiederholt
& Bryant, 1992), Word Identification (Woodcock, 1998), Word Reading (Clay, 1993), Oral Reading Fluency, and Passage Reading Tests (Good & Kaminski, 2003).
Reading comprehension. Tests targeting the comprehen- sion of text, usually through questions, maze procedures, or retelling tasks, were included under reading comprehen- sion. Tests included Woodcock Passage Comprehension, Gray Oral Reading Test comprehension (Wiederholt &
Bryant, 1992), Stanford Diagnostic Reading Test compre- hension (Stanford Achievement Test Series, 1990), Gates–
MacGinitie comprehension (MacGinitie, 1978), and maze tests.
Spelling. Spelling tests were included if the words were not phonetically controlled, such that simple rules could not be applied, to ensure that this was not a constrained skill.
Among spelling tests coded were the Waddington Diagnos- tic Spelling Test (Waddington, 1988), the Wechsler Test of Reading Development spelling, Schonell spelling, Kaufman spelling (Kaufman & Kaufman, 1985), and the Wide Range Achievement Test spelling (Jastak & Wilkinson, 1984).
Sample risk status and characteristics. Risk status was coded according to ecologically occurring categories in the intervention literature, which however also bore a close resemblance to the tier classification system adopted in many states (Scholin & Burns, 2012). A restrictive clas- sification system was used, whereby sufficient evidence had to exist for samples to be classified in the next, more severe at-risk category (i.e., the starting point for classifica- tion was normality, not risk), thus providing a more con- servative estimate of disability. Normal readers were those drawn directly form normal classrooms, whereas samples from a low socioeconomic status background (e.g., vast majority receiving free and reduced lunch), those reading below the 50th percentile, and those whose parents were diagnosed with dyslexia were classified as at risk. Children reading between the 11th and 25th percentiles were classi- fied as low readers (approximately Tier II). Children below the 10th percentile or with a IQ–reading discrepancy of 1 standard deviation in the negative direction were classified as reading disabled (corresponding to Tier III). Finally, a category for learning disabled students was included, that is for students with a general learning disability other than dyslexia.
Sample grade, age, whether the sample was given the intervention in its native language, and whether the studies were carried out in an English-speaking country were also
coded. Finally, because it is commonly reported that boys are overrepresented in reading interventions, the percentage of study participants who were boys was calculated.
Intervention type. The presence of phonemic awareness, phonics, fluency, and comprehension components in the reading interventions was coded using the criteria pub- lished by Suggate (2010), whereby phonemic awareness (and phonological awareness) interventions focused on manipulation of sounds in the absence of text and phonics included letter–sound or sound–spelling relations. Fluency interventions focused on skill at reading connected text, to the exclusion of practice at reading sentences or single words (e.g., peer tutoring, repeated reading). Comprehen- sion interventions were those that focused on strategies to decipher text and derive meaning without a phonics focus, such as summarizing, prior knowledge, and inferential thinking. Thus, reading recovery was here classified as a comprehension intervention.
In a second step, these components were recoded into interventions as follows: (a) phonemic awareness, if they only contained a PA component, (b) phonics, if they con- tained a phonics component with or without an additional PA component, (c) fluency, if they included a fluency com- ponent with or without phonics, (d) comprehension, if con- taining a comprehension component, with or without a fluency component, or (e) mixed, if containing comprehen- sion and a phonics or phonemic awareness component.
Therefore, these categories captured a pure language ability in phonemic awareness, a sound–symbol intervention in phonics and as predicted by the phonological linkage hypothesis (Hatcher et al., 1994), the role of practice and fluency building (Therrien, 2004), teaching reading com- prehension skills (Wanzek et al., 2006), being the aim of reading (Gough & Tunmer, 1986), and mixed approaches.
Instructor variables. Intervention administrator was coded using dummy variables to allow for the possibility that interventions has more than one type of administrator. Sim- ilar but expanded criteria to Marulis and Neuman (2010) were used, resulting in (a) preschool teacher, (b) classroom teacher, (c) trained tutor including qualified teachers trained for the study, (d) researcher administered including the researcher’s graduate students, (e) parent or home adminis- tered, (f) computer administered, or (g) peer or community reading partner. To accommodate international differences, preschool teachers were often kindergarten teachers in European countries, where, unlike in much of the United States, kindergarten is not part of regular school.
Length of instruction was estimated using two variables.
The first was a calculation of the total number of interven- tion hours. Where precise information was not provided, the best estimation possible was calculated. For example, if an intervention length was given as 10 to 15 minutes a day, 5
days per week for 3 months, the length would be 12.5 min- utes multiplied by 5 days multiplied by 12 weeks (which is slightly less than 3 months to allow for absences). The sec- ond dosage variable was a dummy variable for whether the intervention was replaced at an exact one-to-one ratio by a school or in-house intervention of similar quality. Finally, instructor–student ratio was also coded as was the number of months from posttest to follow-up.
Study methodology. Experimental design was coded as a dummy variable (1 = random assignment, 0 = quasi-exper- imental). Random assignment referred only to the random assignment of individual students to the intervention and control groups. For inclusion in the meta-analysis, quasi- experimental assignment of groups of students drawn from the same populations was necessary. This excluded designs comparing, for example, at-risk to normal readers. To enforce this criterion, pretest scores on quasi-experimental designs had to show equivalence (dw = ±0.50 at pretest).
Attrition was calculated by taking the number of students at follow-up divided by the number of students receiving the intervention around pretest. Consistent with recommenda- tions (Jadad et al., 1996), fidelity was coded as a dummy variable, where fidelity of 1 indicated that the authors had made mention of attempts to monitor treatment adherence.
Interrater reliability. A graduate student in educational psy- chology independently coded the study characteristics for 16.33% of the studies. Cohen’s kappa coefficients were cal- culated for the dichotomous variables of sample language, study language, random assignment, intervention adminis- trator, instructor–student ratio, and intervention type, yield- ing a mean reliability estimate of .93. For the continuous variables of grade, attrition, percentage boys, and interven- tion length, reliability was estimated by dividing the num- ber of increments (e.g., percentage, hours) agreed on, by those disagreed on summed with those agreed on. Reliabil- ity by this method was estimated as 90.83%. Initial dis- agreements were then discussed until a consensus was reached. On the important variable of intervention type, a second psychology graduate (master’s) coded 18.31% of studies, obtaining 94.23% agreement. Following this initial calibration procedure, all studies were jointly coded a sec- ond time by the author and the psychology graduate with initial disagreements being resolved by mutual agreement.
Data Analysis
Effect size calculation. Effect sizes (d) were calculated by dividing the difference between the means by the pooled standard deviations (Hunter & Schmidt, 2004). Individual effect sizes were calculated for each of the measures reported by the authors, at pretest, posttest, and follow-up. Then, indi- vidual effect sizes were averaged into the categories of
prereading, reading, reading comprehension, and spelling.
To retain statistical independence, effect sizes were never
“counted twice,” in that they could feed into only one of the four categories. Once the four categories had been formed, an overall aggregate effect size was estimated by taking the mean of these four categories, consistent with previous meta-analyses (e.g., Ehri, Nunes, Stahl, et al., 2001; Ehri, Nunes, Willows, et al., 2001; Suggate, 2010). In a final step, the mean weighted effect sizes (dw), also as a function of moderator variables, were calculated, with effect sizes being weighted by sample size, as recommended (Hunter &
Schmidt, 2004). The Q-statistic was calculated (p < .01, given large number of comparisons) to estimate effect size heterogeneity and hence whether moderator variables likely operate. Fixed-effect effect size estimates were calculated.
Exploring bias. To first check for outliers, box plots were constructed, from which no data points at posttest or fol- low-up were identified as outliers (> 2 SD above mean). To determine the presence of publication bias, funnel plots were constructed and these appear in Figure 1. There was a tendency for studies with smaller sample sizes and lower effect sizes to be absent at both time points, representing publication bias (Hunter & Schmidt, 2004). This pattern was most marked at follow-up with there appearing to be a corresponding mismatch around the median (i.e., which should be the midpoint of the funnel around which scores are mirrored), such that there were a lack of expected smaller studies with negative effect sizes.
Results
In all, 16 studies compared two or more different interven- tions with one control group. If the interventions were Figure 1. Funnel plot for effect size as a function of sample size at posttest.
coded as being of the same type, these groups were com- bined into a single intervention group; however, if the inter- ventions were appreciably different, the sample size of the control group was divided by the number of intervention conditions to weight according to sample size (see Suggate, 2010). Where it was clear that there were large floor or ceil- ing effects, such that participants’ scores were zero, or close to zero with a standard deviation larger than the mean, data for those particular measures were not coded (e.g., Brady, Fowler, Stone, & Winbury, 1994). In five instances the authors of original studies were contacted to clarify or obtain missing information (see Note 1). A further study (i.e., Blachman et al., 2014) reported, in addition to a 12-month follow-up, a 10-year follow-up; however, this was judged to be too great of an outlier with regard to fol- low-up to be included here, and instead the 12-month fol- low-up data are included. Only two studies had samples that had learning disabilities, so these were collapsed into the category of reading disabled, based on the reasoning that both represent severe learning impairment. A summary of the studies selected appears in the appendix. Of importance, the majority of the effect sizes at pretest (not reported) were at or close to zero, suggesting that the intervention and con- trol groups were similar at the outset.
Study Descriptives
The mean time from posttest to follow-up was 11.17 months (SD = 7.18). In terms of risk status, 23.90% were classified as normal, 28.20% as at risk, 26.80% as low readers, and 21.10% as reading disabled. The interventions were pre- dominantly administered by a mixture of teachers (21.10%), preschool teachers (16.90%), computers (21.10%), and trained educators (33.80%), with only 2.80% of interven- tions administered by parents and 7.00% by peer and com- munity tutors. The majority of the interventions included either a phonemic awareness component (64.80%) or a pho- nics component (53.50%), whereas only 26.80% and 29.60% included components targeting fluency and com- prehension, respectively. The average sample size was 125.25 (SD = 211.23) at pretest, 114.94 (SD = 198.25) at posttest, and 109.94 (SD = 198.75) at follow-up.
Interventions lasted on average 38.70 hours (SD = 37.13), and these were usually conducted in English-speaking countries (60.60% of the time) and on participants in their mother tongue (87.30%) and employed random assignment and fidelity checks 52.10% and 54.90% of the time, respec- tively. The mean grade of the samples was Grade 1.18 (SD
= 1.51), and on average 55.45% (SD = 7.49) of the interven- tion participants across studies were boys. The mean num- ber of students per instructor was 4.89 (SD = 6.81), and the mean percentage of the pretest samples remaining at fol- low-up across studies (unweighted) was 83.91% (SD = 18.62). Authors reported that children received some form
of systematic intervention after posttesting in 12.70% of the studies.
Moderator Variable Analysis
Table 1 reports the mean weighted effect sizes, unweighted mean, median, sample size, number of treatment-control groups, estimated population standard deviation, and the Q test of effect size heterogeneity as a function of the categori- cal intervention moderators. Grade was grouped based on theoretical and power maximization criteria, resulting in the categories of preschool and kindergarten, then Grades 1 and 2, where children acquire decoding skills in English (Seymour et al., 2003), and then Grades 3 to 6, where chil- dren move to reading to learn (Chall, 1976) and which had too few studies to break students down further into indi- vidual grades.
Effect sizes in Table 1 tended to be of similar magnitude across outcome variables, with the exception of greater maintenance on spelling at follow-up. Normal readers appeared to lose their advantage over control groups to fol- low-up and experimenter administered interventions resulted in large effect sizes at posttest. Of interest, the long-term effect sizes were greater as a function of grade, such that kindergarten and preschool follow-up effect sizes were small, those in Grades 1 to 2 were small to moderate, and those in Grades 3 to 6 were large to moderate. Also, interventions that were conducted in addition to the control dosage showed a greater effect.
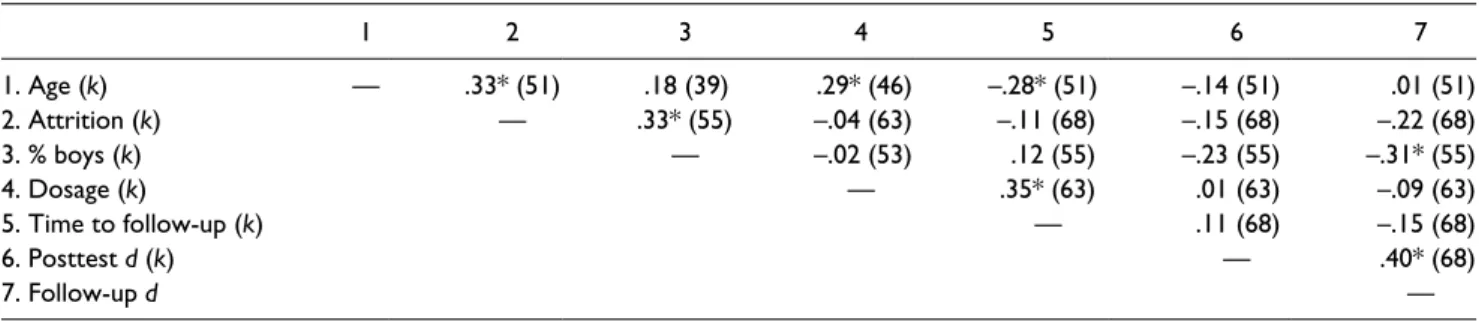
Next partial correlation analyses were conducted, con- trolling for sample size (e.g., Brannick, Yang, & Cafri, 2011; Hunter & Schmidt, 2004), to investigate the role of intervention length, sample attrition, time from posttest to follow-up, and grade. The resulting analysis appears in Table 2. Samples with a greater number of boys were asso- ciated with lower effect sizes at follow-up.
Intervention Type and Transfer Across Outcome Variables
Finally, to examine the role of intervention type in effect size and also the transfer of intervention effects to nontar- geted outcomes, mean weighted effect sizes, unweighted mean, median, sample size, number of treatment control groups, estimated population standard deviation, and the Q test of effect size heterogeneity as a function intervention type were calculated. The resulting data, in Table 3, indicate that phonemic awareness and comprehension interventions resulted in the largest effect sizes at follow-up, whereas phonics and fluency interventions lost more effect to fol- low-up. Furthermore, fluency interventions did not result in good transfer to reading comprehension, with benefits being more confined to targeted decoding and reading skills at follow-up. Mixed interventions also showed generally sta-
Table 1. Effect Sizes at Posttest and Follow-Up as a Function of Outcome Measure, Risk Status, Administrator, Grade, Instructor Ratio, Experimental Design, Study and Participant Language, Booster Intervention, and Treatment Fidelity.
Posttest Follow-Up
Comparison dw d Median N k SDobs Q dw d Median N k SDobs Q
Outcome measure
Overall .37 .45 .41 8,161 71 .19 139.70* .22 .36 .33 7,806 71 .24 181.76*
Prereading .39 .50 .40 5,693 57 .31 188.54* .16 .33 .32 4,576 45 .29 138.97*
Reading skills .32 .44 .46 6,005 48 .22 118.94* .18 .37 .35 6,274 54 .30 190.90*
Comp. .42 .41 .39 3,165 38 .11 46.89 .17 .27 .27 4,977 45 .25 120.15*
Spelling .46 .42 .32 1,234 20 .08 21.65 .38 .43 .36 1,872 27 .16 38.41
Sample risk status
Normal .28 .40 .45 4,258 17 .19 53.42* .13 .32 .36 4,174 17 .29 101.33*
At risk .54 .64 .57 1,839 20 .23 42.88* .35 .44 .41 1,650 20 .19 34.60
Low readers .40 .40 .35 1,117 19 — 16.34 .32 .33 .27 1,073 19 — 12.49
Reading/learning disabled .37 .32 .35 947 15 — 12.70 .30 .35 .33 909 15 .13 18.57
Intervention administrator
Preschool teacher .41 .49 .52 1,177 12 .20 23.70 .32 .48 .46 1,088 12 .20 22.14
Regular teacher .28 .39 .28 3,801 15 .17 43.17* .10 .28 .28 3,755 15 .28 86.68*
Trained intervener .49 .51 .47 1,820 25 .13 32.64 .34 .36 .33 1,645 25 — 16.31
Computer .31 .32 .35 709 14 — 11.45 .25 .31 .27 677 14 .15 17.72
Experimenter .60 .66 .67 607 5 — 3.53 .36 .49 .43 604 5 .15 8.48
Peer/community tutor .37 .42 .25 490 5 .34 18.87* .30 .24 .28 475 5 .12 6.57
Grade
Preschool and kindergarten .34 .50 .51 3,817 29 .20 67.88* .12 .36 .31 3,622 29 .33 125.25*
Grades 1 and 2 .40 .46 .41 3,115 30 .16 48.06 .26 .36 .36 3,000 30 .11 39.23
Grades 3 to 6 .35 .32 .27 1,229 12 .04 12.51 .43 .41 .36 1,184 12 — 11.76
Instructor ratio
Individual .38 .40 .36 1,735 30 .06 31.27 .28 .32 .27 1,659 30 .12 35.97
Group .36 .49 .48 6,426 41 .22 118.61* .20 .40 .39 6,147 41 .28 161.11*
Experimental design
Quasi .34 .46 .40 5,023 34 .19 77.97* .18 .40 .34 4,816 34 .33 161.22*
Random .41 .45 .41 3,138 37 .19 62.72* .29 .33 .33 2,990 37 — 34.97
Study language
English .34 .44 .35 4,752 43 .19 84.62* .17 .35 .33 4,535 43 .26 120.38*
Non-English .40 .47 .49 3,409 28 .18 54.29* .29 .38 .38 3,271 28 .20 58.52*
Booster
Received booster .50 .51 .49 800 9 .23 19.37 .20 .28 .15 738 9 — 8.00
No booster .35 .44 .41 7,361 62 .18 117.12* .22 .38 .38 7,068 62 .26 176.85*
Treatment fidelity
Monitored .32 .41 .35 5,378 39 .17 75.89* .17 .35 .33 5,200 39 .27 131.81*
Not monitored .45 .50 .47 2,783 32 .18 53.77* .32 .38 .35 2,606 32 .14 44.05
Dosage
Additional to control .44 .47 .44 4,788 58 .17 89.71* .31 .35 .33 4,446 58 .06 62.15
Same dosage as control .26 .37 .28 3,373 13 .16 33.31* .10 .42 .43 3,360 13 .40 145.09*
Note. d = unweighted average effect size; dw = weighted estimated effect size; median = median effect size; SDobs = observed SD; — = variance was (mathematically) negative due to second order sampling error.
*p < .01.
Table 2. Partial Correlation Coefficients for Continuous Hypothesized Moderator Variables Controlling for Sample Size.
1 2 3 4 5 6 7
1. Age (k) — .33* (51) .18 (39) .29* (46) –.28* (51) –.14 (51) .01 (51)
2. Attrition (k) — .33* (55) –.04 (63) –.11 (68) –.15 (68) –.22 (68)
3. % boys (k) — –.02 (53) .12 (55) –.23 (55) –.31* (55)
4. Dosage (k) — .35* (63) .01 (63) –.09 (63)
5. Time to follow-up (k) — .11 (68) –.15 (68)
6. Posttest d (k) — .40* (68)
7. Follow-up d —
*p < .05.
ble maintenance of effect size to follow-up across most out- come variables.
To facilitate interpretation of the results in Tables 1 and 3 in light of the advantage for older readers and comprehen- sion interventions, descriptive statistics are reported for these variables. The mean grade of students receiving pho- nemic awareness (M = 0.50, SD = 0.97) and phonics inter- ventions (M = 0.45, SD = 0.81) was in between kindergarten and Grade 1, whereas fluency (M = 1.25, SD = 1.37) and mixed interventions (M = 1.61, SD = 0.70) were given on average between Grades 1 and 2, and comprehension some- what later, in Grade 3 (M = 3.09, SD = 2.06).
Discussion
A plethora of studies and even meta-analyses have docu- mented the short-term effects of reading interventions for different learners (Bus & van Ijzendoorn, 1999; Ehri, Nunes, Stahl, et al., 2001; Ehri, Nunes, Willows, et al., 2001; Elbaum et al., 2000; Suggate, 2010; Swanson et al., 1999). Thanks to a large body of work encompassing single studies that report longer-term effects, this article could
present the first detailed investigation not only of the lon- ger-term effects of reading interventions but also of these as a function of a host of key moderator variables.
Consistent with previous work (Bus & van Ijzendoorn, 1999; Ehri, Nunes, Stahl, et al., 2001; Ehri, Nunes, Willows, et al., 2001; Elbaum et al., 2000; Suggate, 2010; Swanson et al., 1999), effect sizes at posttest were moderate (dw = 0.37), on average, suggesting that the children in the experimental groups did in fact experience a substantial boost to their reading skills, which reduced by follow-up to around dw = 0.22 (see Table 1). Thus, on average, 11 months after par- ticipating in interventions with a phonemic awareness, pho- nics, fluency, or comprehension approach, a small effect of the intervention remained.
Moderator Effects
A key contribution of the current article is understanding the role of moderator variables. Beginning with method- ological moderators, effect sizes at follow-up tended to be lower when the studies included treatment-fidelity monitor- ing or nonrandomized designs, had less attrition, had a more Table 3. Effect Sizes at Posttest and Follow-Up as a Function of Intervention Type.
Posttest Follow-Up
Intervention and
Outcome dw d Median N k SDobs Q dw d Median N k SDobs Q
Phonemic awareness
Overall .43 .42 .42 1,156 17 — 11.19 .36 .46 .44 1,093 17 .07 18.31
Prereading .40 .39 .40 760 13 — 7.15 .28 .43 .46 714 13 .19 19.15
Reading skills .32 .31 .32 449 8 — 2.75 .33 .48 .53 634 10 .30 23.55*
Comp. .32 .30 .20 346 6 — 4.83 .29 .28 .32 659 10 — 6.39
Spelling .33 .20 .26 251 4 — 2.86 .38 .50 .36 716 9 .11 11.12
Phonics
Overall .29 .44 .43 4,162 22 .22 70.98* .07 .25 .27 4,045 22 .25 82.04*
Prereading .32 .48 .41 3,141 21 .27 77.90* .08 .26 .25 3,024 21 .28 79.66*
Reading skills .26 .45 .44 3,684 16 .26 76.32* .07 .30 .27 3,895 20 .29 102.61*
Comp. .47 .48 .53 351 4 — 1.22 –.10 –.03 –.04 1,952 8 .16 19.89*
Spelling .38 .27 .31 223 5 — 2.99 .46 .48 .39 215 5 .14 5.60
Fluency
Overall .47 .59 .49 936 12 .22 23 .28 .33 .24 882 12 — 7.97
Prereading .58 .80 .48 728 10 .55 61.26* .42 .49 .46 300 4 — 3.62
Reading skills .47 .56 .64 936 12 .22 22.37 .28 .31 .24 882 12 — 8.65
Comp. .32 .45 .38 936 10 .18 17.42 .18 .21 .20 882 9 — 5.91
Spelling .58 .65 .72 425 6 .16 8.47 .27 .30 .25 391 6 .13 7.64
Comp.
Overall .38 .33 .28 1,098 11 .14 16.43 .46 .42 .39 1,050 11 .10 13.27
Prereading .41 .38 .18 261 4 .45 16.73* .32 .22 .22 85 2 .38 4.92
Reading skills .26 .18 .20 127 3 .34 6.37 .51 .46 .46 93 2 .38 5.08
Comp. .38 .32 .26 964 10 .09 11.81 .46 .42 .39 1,050 11 .10 13.47
Spelling .54 .50 .50 93 2 .28 3.71 .51 .46 .46 93 2 .38 5.08
Mixed
Overall .52 .51 .50 809 9 .17 14.65 .40 .44 .41 736 9 — 6.79
Prereading .38 .35 .32 554 6 .19 10.81 .29 .29 .45 452 5 .27 12.70
Reading skills .46 .46 .49 809 9 .21 17.15 .38 .45 .42 736 9 .08 10.01
Comp. .52 .54 .50 722 8 .23 17.20 .39 .40 .33 599 7 — 1.69
Spelling .44 .43 .31 241 3 — 2.36 .40 .39 .40 456 5 — 3.56
Note. d = unweighted average effect size; dw = weighted estimated effect size; median = median effect size; SDobs = observed SD; — = variance was (mathematically) negative due to second order sampling error.
*p < .01.
even gender balance, and were not directly carried out by members of the research team. Of interest, normal readers appeared to profit least from reading intervention, espe- cially at follow-up.
Grade. However, the key findings to arise from this meta- analysis did indeed emerge when the effect sizes at follow- up were examined with respect to two key moderator variables in particular, namely, intervention type and grade.
Beginning with the latter, grade did not appear to moderate the short-term effects of reading interventions, unlike in previous work (e.g., Suggate, 2010); here it was particularly evident that the younger the intervention sample, the lower the effect size at follow-up, despite moderate posttest effect sizes. Thus, for preschoolers and kindergarteners (accord- ing to the U.S. usage of these terms), effect sizes reduced from dw = 0.34 to dw = 0.12 at follow-up; for children in Grades 1 and 2, the effect reduced from dw = 0.40 at posttest to dw = 0.26 at follow-up; for older children in Grades 3 to 4, this actually increased from dw = 0.35 to dw = 0.43 at follow-up. In other words, the reading interventions investi- gated here were more than 3.5 times more effective for older children at follow-up. On the surface, this would appear to run counter to the popular idea that if children are not caught early, they will learn a pattern of failure such that reading intervention will not be successful (Good, Sim- mons, & Smith, 1998) because reading intervention can be effective in the early grades, and can be particularly effec- tive in the middle grades, showing stronger effects 1 year after cessation of the intervention.
Intervention type and the phonological linkage hypothesis. The second key finding to emerge from this meta-analysis con- cerns the performance of phonics interventions. According to the phonological linkage hypothesis (Hatcher et al., 1994), reading instruction that explicitly combines the links between sounds in letters or words (i.e., phonics) should be more effective than purely phonemic approaches.
At immediate posttest, there was little evidence that it mat- tered whether or not phonics or purely phonemic aware- ness interventions were used (dw = 0.33 vs. dw = 0.32).
However, when follow-up effect sizes were compared, there was a distinct advantage for phonemic awareness interventions (dw = 0.29 vs. dw = 0.07), precisely the oppo- site of what would be predicted by the phonological link- age hypothesis. Of interest, the greatest effect sizes at follow-up appeared to result from interventions with a comprehension component.
This fairly large effect for comprehension interventions must be tempered with the observation that older children tended to receive interventions with a comprehension com- ponent. Accordingly, due to the inability to statistically tease out the influence of grade from intervention type because of the cell sizes (there were only 12 studies after
Grade 3), it remains unclear what drives the larger effect sizes for older children. However, this question is some- what irrelevant because comprehension interventions can- not be effectively given to children that cannot yet read (e.g., Suggate, 2010).
Indeed, the poor performance of phonics interventions in comparison to phonemic awareness training is a surprising finding of this analysis that is worthy of discussion, at the outset of which a number of potential explanations can be ruled out. First, this advantage for phonemic awareness does not run counter to previous research because this research has not tested, using meta-analyses with a suffi- ciently large sample size, the phonological linkage hypoth- esis by comparing phonics and phonemic awareness interventions at follow-up. Second, this finding is not due to some feature of the respective study participants because post hoc analyses revealed that both study sets had highly similar samples in terms of grade, risk status, attrition, gen- der, and time between posttest and follow-up. Third, find- ings cannot readily be explained in terms of the outcome measure selected because phonemic awareness showed a comparative and appreciable advantage over phonics on all outcome measures, except for spelling (i.e., transfer effects).
Thus, given the large number of studies in each condition, it is unlikely that a methodological feature accounts for the advantage for phonemic awareness interventions over phonics.
Conversely, in meta-analysis the effect size is calculated as a function of a weight assigned to each study. Based on sampling error, studies with larger sample sizes are assigned greater weights. As recommended by Hunter and Schmidt (2004), this meta-analysis weighted each study according to the sample size of that study. This a priori decision was taken because of the intuitive appeal that such a parsimoni- ous weighting system entails in the absence of the seem- ingly excessive data-transformation when weighting according to sampling error or inverse sampling variance.
Of interest, Brannick et al. (2011) found in a simulation based on published meta-analysis data that weighting by sample size generally performed as well as or better than other weights (e.g., Brannick et al., 2011). However, a con- sequence of this weighting system is that larger studies are given greater weights than when inverse variance is used, for example. Moreover, the two largest sample sizes involved phonics interventions (Gunn et al., 2011, N = 1,405; Houtveen & van de Grift, 2012, N = 1,021), and they were considerably larger than the third largest (N = 273), but resulted in small effect sizes at follow-up (d = −0.13 and 0.12, respectively), despite being moderate at posttest (d = 0.18 and 0.28, respectively). Of these two studies, Gunn et al. (2011) clearly implemented a high-quality phonics pro- gram, as defined here. The Houtveen and van de Grift (2012) intervention components appeared to be phonics because the intervention feature that distinguished the