Effect of electron-phonon interaction on the formation of one-dimensional electronic states in coupled Cl vacancies
Bruno Schuler,1,*Mats Persson,2,3Sami Paavilainen,4Niko Pavliˇcek,1Leo Gross,1Gerhard Meyer,1and Jascha Repp5
1IBM Research –Zurich, S¨aumerstrasse 4, 8803 R¨uschlikon, Switzerland
2Surface Science Research Centre, Department of Chemistry, University of Liverpool, Liverpool, L69 3BX, United Kingdom
3Department of Applied Physics, Chalmers University of Technology, SE 41296, G¨oteborg, Sweden
4Department of Physics, Tampere University of Technology, 33720 Tampere, Finland
5Institute of Experimental and Applied Physics, University of Regensburg, 93053 Regensburg, Germany (Received 30 March 2015; revised manuscript received 16 May 2015; published 24 June 2015) The formation of extended electron states in one-dimensional nanostructures is of key importance for the function of molecular electronic devices. Here, we study the effects of strong electron-phonon interaction on the formation of extended electronic states in intentionally created Cl vacancy pairs and chains in a NaCl bilayer on Cu(111). The interaction between the vacancies was tailored by fabricating vacancy pairs and chains of different orientation and separation with atomic precision using vertical manipulation. Small vacancy separations led to the formation of quantum-well-like vacancy states and localized interface states. By using scanning tunneling spectroscopy, we measured their energy splitting and broadening as a function of the intervacancy separation.
Remarkably, the energy splitting between the vacancy states is enlarged by level repulsion resulting from the phonon dressing of the electronic states, as evidenced by theory.
DOI:10.1103/PhysRevB.91.235443 PACS number(s): 68.37.Ef,68.55.Ln,73.20.−r,63.20.kd I. INTRODUCTION
One-dimensional nanostructures assembled from single metal atoms and molecules on surfaces are of great fundamen- tal and technological interest as their electronic states exhibit a wealth of new quantum phenomena that might be exploited in future molecular electronics devices [1]. Some examples of such phenomena identified by scanning tunneling microscopy (STM) and spectroscopy (STS) include metal-atom chains exhibiting “particle-in-box” states [2], bistable antiferromag- netism [3], Tomonaga-Luttinger liquid behavior [4], and signs of Majorana spinors [5]. The formation of extended or bandlike electronic states in metal-atom and molecular chains on surfaces has been widely studied experimentally [6–10], but potentially interesting effects of strong electron-phonon coupling on these states, such as, for instance, polaronic effects, have attracted much less attention. A notable exception is the observation of coherent electron-phonon states and the breakdown of the Born-Oppenheimer approximation in oligothiophene molecular chains [11]. In the electronically adiabatic regime, where the Franck-Condon principle is appli- cable, the electron-phonon coupling results in vibronic satellite structures. How these vibronic effects influence the delocaliza- tion of an injected electron in a one-dimensional nanostructure is an open question, in particular when the electron-phonon coupling is so strong that these effects dominate.
Here, we address this question in a combined experimental and theoretical study of coupled electronic states localized at intentionally created Cl divacancies and vacancy chains in a NaCl bilayer on Cu(111). The Cl vacancies provide a quantum- well structure that could be created with atomic precision using the STM tip [12,13]. The energies of the electronic states formed in these structures by injection of an electron from the tip of an STM and their spatial behavior on the atomic scale
*bsc@zurich.ibm.com
were resolved by STS and analyzed using simple models.
Our findings have ramifications for the formation of extended states from coupled adsorbate or confined defect states (such as in dopants [14] or dangling bonds [15]) in semiconductors and ionic crystals. Hence it could improve the understanding of polaronic effects in coupled quantum systems, such as quantum dots [16–21], charge-based qubits [22,23], and quantum cellular automata [24].
Coupled, individual Cl vacancies in a NaCl bilayer on a Cu(111) surface are ideal model systems to study the effect of strong electron-phonon coupling on the delocalization of electronic states. First, Cl monovacancies are atomically well-defined and highly symmetric defects. They feature two distinct electronic states: an unoccupied vacancy state (VS) that is strongly coupled to optical phonons in the film and a localized interface-state (LIS) with a negligible electron- phonon coupling [25,26]. The electronic coupling between VSs or LISs of different vacancies can be tuned in a controlled way by the lateral spacing between vacancies with atomic precision [27]. Finally, Cl vacancies feature a much higher stability against inelastic excitations than adsorbates [28]. Cl vacancies could even be filled with other atoms [29]. Hence they allow us to explore artificial coupled quantum systems with great control.
II. EXPERIMENT
The experiments were carried out in a home-built low- temperature combined STM and atomic force microscopy (AFM) operated at 5 K. A Cu(111) single-crystal sample was cleaned by several sputtering and annealing cycles. NaCl was evaporated thermally, keeping the sample temperature at about 270 K, such that defect-free, (100)-terminated NaCl bilayer islands were formed [30,31]. Bias voltages refer to the sample voltage with respect to the tip. In the spectro- scopic measurements, the tunneling conductancedI /dV was recorded with conventional lock-in techniques with an ac
-5.7-4.6Hz
0
-0.5 -0.4 -0.3 -0.2 -0.1 2.2 2.4 2.6 2.8 3 3.2
x
x dI/dV (arb. units)
Gaussian
sample bias [V]sample bias [V] -3.4-2.3Hz -5-3.7Hz
x x x x x x
x x x x x x
5NN 3NN
Lorentzian
dI/dV dI/dV dI/dV dI/dV
dI/dV dI/dV
dI/dV dI/dV
(b)
(g)
(m)
= 0.27V
(a) (c) (e)
(h) (i) (j) (k)
(n) (o) (p) (q)
2NN 1NN
3NN 4NN
5NN
6NN
-5.2-3.3Hz
(d) 4NN Cl-
Na+
-7-5Hz
(f) 2NN
(l)
2.2 2.4 2.6 2.8 3 3.2
sample bias [V]
-0.5 -0.4 -0.3 -0.2 -0.1
sample bias [V]
dI/dV (arb. units) (r)
= 0.23V
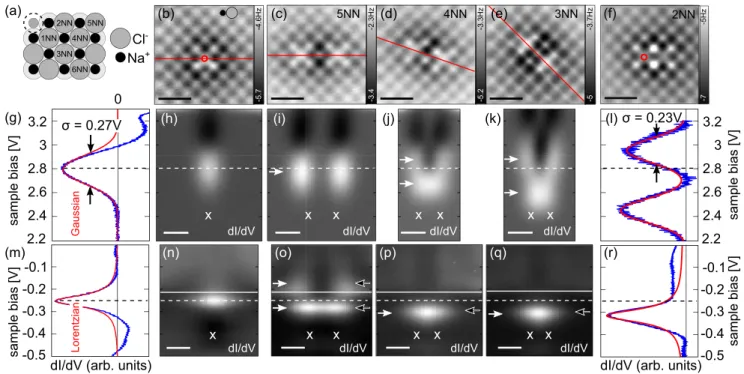
FIG. 1. (Color online) (a) NaCl bilayer model with a Cl vacancy (dashed circle) and its nearest Cl neighbors indicated. (b)–(f) CO tip AFM images of a single Cl vacancy (b) and divacancies in the 5NN (c), 4NN (d), 3NN (e), and 2NN (f) configurations. (g) and (l)dI /dV spectra of the monovacancy and 2NN divacancy VS peaks with a Gaussian fit in red, recorded at the red circles in (b) and (f). (h)–(k)dI /dV(x,V) maps along the red lines in (b)–(e) [sameV scale as in (g)]. Peaks indI /dV are displayed as bright, whereas the darkest areas mark regions of negative differential conductance (NDC).1The dashed line indicates the monovacancy VS peak position. (m) and (r)dI /dV spectra of the LIS of a monovacancy and a 2NN divacancy with a Lorentzian fit in red, recorded at the red circles in (b) and (f). (n)–(q)dI /dV(x,V) maps along the red lines indicated in (b)–(e) [sameV scale as in (m)]. The dashed line indicates the monovacancy LIS peak position and the solid line the interface-state band onset. White crosses indicate the vacancy positions. White arrows mark the peak positions of the observeddI /dV resonances. Black arrows in (n)–(q) mark the peak positions of the calculated LDOS using theσ-wave multiple scattering model. Scale bar is 10 ˚A.
bias amplitude of 25 mV at a frequency of 294 Hz. In the double-barrier tunneling junction geometry, the voltage drop across the insulating film will cause a voltage-dependent shift of the electronic levels. This tip-induced Stark shift is a few percent of the applied bias but depends only weakly on the tip distance. Therefore it is not considered here [32]. The vacancies were created by bringing the tip into a controlled contact with the NaCl surface by approaching a sharp Cu tip by about 4.5–5.5 ˚A at zero bias from an STM set-point of (I =2 pA andV =0.2 V). Thereby a Cl atom was transferred to the tip apex, as evidenced by a characteristic contrast change in STM images and a remaining depression at the predefined Cl site. The resulting Cl at the tip was removed and a Cu tip was reestablished by indenting into the Cu surface. A Cl vacancy was usually created with more than 90% probability and with about 90% probability at the atomically predefined location. Crucial factor was the sharpness of the Cu tip, which was assessed by the STM corrugation of CO molecules on the surface. Atomic resolution images taken before the vacancy creation ensured that the vacancies will be created precisely at the desired location. Constant-height AFM images with a CO tip [33,34] were recorded to identify the vacancy location and exclude the generation of other close-by defects. In addition, we measured the local contact potential difference on the polar film with Kelvin probe force microscopy to ensure that the defects are indeed Cl vacancies [35].
In a previous study [32], single Cl vacancies in a NaCl bilayer on copper surfaces were characterized in detail. A Cl vacancy in the outermost layer of this supported NaCl bilayer is analogous to the widely studied and well-known color centers in bulk NaCl [36] with one key difference: the localized VS is unoccupied because the electron can tunnel into unoccupied metal states. The unoccupied VS then gives rise to a positively charged vacancy and an attractive potential that is able to split off a LIS from the free-electron-like interface-state band of the NaCl/Cu(111) [37]. This LIS was observed as a narrow resonance just below the bottom of the interface-state band in thedI /dV spectra, whereas the VS showed up as a broad negative ion resonance at a sample voltage of about 2.8 V in dI /dV. The negative ion resonance was found to have a large Gaussian broadening (full width half maximum (FWHM) of σ =0.27 V) because of the strong electron-phonon coupling of the electron in the VS to optical phonons in the NaCl bilayer.
Despite this strong coupling corresponding to an estimated Huang-Rhys parameter of aboutS=30, the associated relax- ation energy of the electron in the VS is not large enough to prohibit tunneling into unoccupied metal states and to allow
1At positive voltages, the NDC arises from the increase of the tunnel barrier for resonant tunneling through the VS with voltages greater than the VS [26].
2.2 2.4 2.6 2.8 3 3.2
sample bias [V]
-0.5 -0.4 -0.3 -0.2 -0.1 0
sample bias [V]
0.1 LIS
(a)
(b)
(c)
(d) VS VS VS
LIS LIS
-5.3-2.8Hz
N = 4, apolar
-5.2-3.1Hz
N = 5, apolar
-4.2-2.0Hz
N = 6, apolar
-1.3-0.3Hz
N = 3, polar
-3.2-1.2Hz
N = 4, polar
-1.40.5Hz
N = 5, polar
x x x x x x x x x x x x
x x x x x x x x x x x x x x x
FIG. 2. (a) CO tip AFM images of Cl vacancy chains with N=4,5,6 vacancies in the 5NN configuration (apolar direction).
(b) Corresponding dI /dV(x,V) maps of the LISs along the chains. The continuous line indicates the interface-state band onset. White arrows mark the peak positions of the observeddI /dV resonances, and black arrows mark the peak positions of the calculated LDOS. (c) CO tip AFM images of Cl vacancy chains withN=3,4,5 vacancies in the 3NN configuration (polar direction). (d) CorrespondingdI /dV(x,V) maps of the VSs along the chains. White crosses mark the positions of the vacancies and the white arrowsdI /dV peaks. Scale bars: 10 ˚A.
the formation of a stable occupied VS corresponding to a localized polaron. In contrast to the VS, the LIS was found to be dominated by lifetime broadening with a negligible phonon broadening in thedI /dV spectra, owing to the efficient screen- ing of the electron-phonon interaction by the metal electrons.
First, vacancy pairs were created with different separations.
Divacancies in the ninth-nearest-neighbor (9NN), 6NN, 5NN, 4NN, 3NN, and 2NN2 configurations [see schematic in Fig.1(a)] were created from two Cl vacancies close to each other but not in the vicinity of any other vacancies or defects.
Constant-height AFM images of the 5NN to 2NN divacancies and of a single vacancy are shown in Figs.1(b)–1(f). Using a CO tip, the vacancies were recognized as a bright crosslike feature in AFM maps. The electronic structure of the divacan-
2The 2NN divacancy was less stable than the divacancies with larger separations.
cies was characterized by singledI /dV spectra or constant- heightdI /dV(x,V) maps along the line connecting the two vacancies. The VS resonances are shown in Figs.1(g)–1(l)and the LIS resonances in Figs.1(m)–1(r), respectively. Note that alldI /dVdata shown here were recorded using Cu-terminated tips. For divacancies with a separation larger than 10 ˚A (i.e., larger than a 4NN divacancy), a single VS resonance was observed to be localized at each vacancy site separately with an energy similar to the one of the monovacancy. For smaller separations (4NN-2NN divacancies), however, two peaks with Gaussian line shapes appeared around 2.8 V. ThedI /dV(x,V) maps show that the state at lower energy is localized between the vacancies (symmetric), whereas the state at higher energy has a nodal plane between them (antisymmetric), in analogy with the bonding and antibonding orbitals of the hydrogen molecule.
Similarly, the divacancy LISs were also observed to split into a symmetric and an antisymmetric state. However, for
(a) (b) (c)
0
-t
-t -t -t
0
-
0
-2
tight-binding (TB) TB + on-site energy shift
(d)
tight-binding (TB) TB + on-site energy shift experiment
energy (eV)
3 2.9 2.8 2.7 2.6 2.5 2.4
2.3 1 2 3 4 5 1 2 3 4 5 1 2 3 4 5
number of vacancies N number of vacancies N number of vacancies N
0.28
0.24
0.2
0.16
1 2 3 4 5
number of vacancies N
(eV) 0
(e) (f)
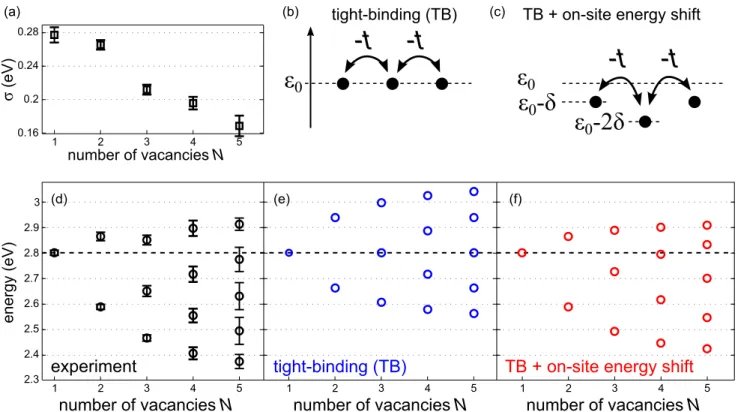
FIG. 3. (Color online) (a) Experimental VS broadeningσas a function of the 3NN chain length. (b) Tight-binding (TB) model for aN=3 chain. (c) TB model including the electrostatic on-site energy shift between nearest neighbors. (d) Experimental VS energies as a function of the 3NN chain length. (e) TB model energies obtained by fitting the on-site energyε0=2.8 eV and hopping termt=0.14 eV to the experimental mono- and divacancy VS energies shown in (d). (f) TB model accounting for a shift of the on-site energy (δ=0.07 eV) due to the electrostatic interaction between nearest neighbors.
small vacancy separations, the latter state lies above the NaCl/Cu(111) interface band onset at εB = −230 mV and overlaps with the band continuum. Hence only the symmetric state is observed as a well-defined peak indI /dV. The splitting of both the VSs and LISs was found to increase with decreasing inter-vacancy distance. The VSs did not split symmetrically about the monovacancy energy but their mean value was shifted towards lower energies. In addition, the VSs showed a tendency to have a smaller level broadening with decreasing separation.
To study the delocalization of VSs and LISs further, short one-dimensional arrays of N vacancies, referred to in the following as vacancy chains, were created in the 5NN (apolar [001] NaCl direction) and the 3NN (polar [011] NaCl direction) configuration. They were also characterized by constant-height CO tip AFM images [Figs.2(a)and2(c)]. For the 5NN chains, the LISs form one-dimensional quantum-well states, observed as distinct resonances in dI /dV, with an increasing integer number of nodal planes with voltage [see Figs. 2(b) and5]. Remarkably, also broader resonances are observed up to 200–300 mV above the interface-state band onset. These quasibound LISs have a lower height indI /dV, owing to the increased lifetime broadening compared to the bound LISs. This originates from the additional decay channel into the interface-state band. Furthermore, the energy position of the ground-state LIS does not change significantly from the N =4 to theN =6 chain and seems to converge to about
−0.33 V. The VSs of the 5NN chains only show a single resonance peak at about 2.7 V, localized at each vacancy
site because of the weak electronic coupling. In contrast, the 3NN chains displayed in Fig.2(c)are subject to significant interaction between the VSs and exhibit several resonances, as shown in Fig.2(d). The increasing number of nodal planes with voltage shows that the VSs are delocalized over the entire chains despite the strong electron-phonon coupling.
Notably, the level broadening decreases for longer chains as displayed in Fig. 3(a). This effect is a direct evidence of the dependence between the electron-phonon coupling and the enhanced delocalization for longer chains. It can be rationalized by the larger spatial extent of the eigenstates, which decreases their relaxation energy and accordingly the effective electron-phonon coupling.
III. THEORY AND DISCUSSION
In the following, the VS energies of the 3NN chains are compared with the results from a simple tight-binding (TB) model. First, we assume that each vacancy in the chain has an on-site energyε0 and is coupled to its next neighbor(s) with a hopping term−t, as sketched in Fig.3(b). By adjusting the free fitting parametersε0andtto the experimental mono- and divacancy VS energies, one can calculate the energy levels for different chain lengths as shown in Fig.3(e). In comparison with the experimental energy spectrum, depicted in Fig.3(d), the level spacings for each chain could be roughly reproduced, but the TB model does not capture the shift of the band center towards lower energies with increasing chain length (as already described for the divacancies). This shift can be explained by
the electrostatic interaction between adjacent vacancies that deepens the potential at each vacancy and therefore lowers the on-site energy. To account for the energy shift, we introduce the parameter δ, which is the on-site energy shift due to a neighboring vacancy [see Fig. 3(c)]. The resulting energy levels of this extended TB model are shown in Fig.3(f). The calculated energy spectrum now agrees very well with the experimentally observed VS levels of the chains.
So far, the strong electron-phonon coupling, as shown by the large broadening of the VSs, was neglected in our tight-binding models. The role of this coupling in the formation of delocalized states by a tunneling electron in vacancy pairs (and chains) needs to be investigated. Here, we use a simple generalization of the electron-phonon interaction model of the single vacancy [32] to vacancy pairs and chains. As detailed in Appendix C 2, the direct electronic interactions between the VSs are described by a simple tight-binding model, and each VS is coupled linearly to the phonon modes of the NaCl film. As we will show next, in this model, the strong electron-phonon coupling has a profound effect on the energy splitting and broadening of the vacancy states. This effect is illustrated here for a divacancy using appropriate parameters, where the electronic interaction between the vacancies is large compared to the characteristic phonon energies, corresponding to an electronically adiabatic regime.
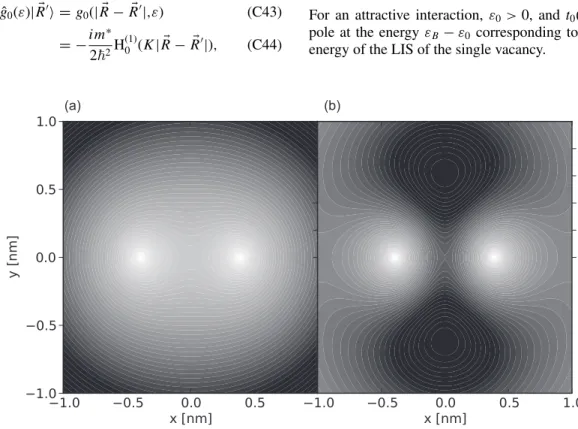
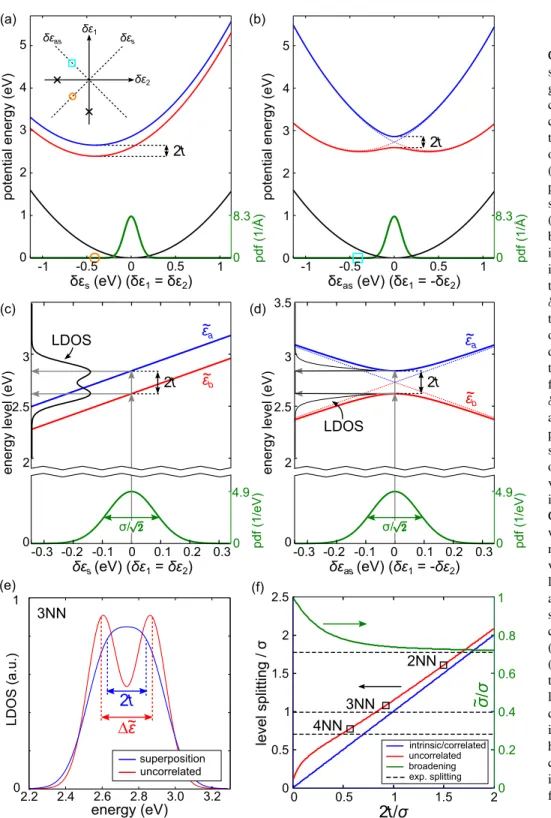
In Figs. 4(a)and4(b), sections of the adiabatic potential energy surfaces (PES) of the singly occupied, divacancy states are shown, as obtained from a constrained minimization with respect to the phonon normal coordinates (ionic positions) for fixed values of on-site energy fluctuations δε1 and δε2 of vacancy 1 and 2, respectively (see Appendix C 2). The sections of the PESs corresponding to symmetric vacancy energy fluctuations δs (where δ1=δ2) [Fig. 4(a)] are split by 2t, where −t is the direct electronic interaction between the VSs, and both have the same shape as for the adiabatic PES of a monovacancy but with half the relaxation energy at the minimum. In contrast, for antisymmetric vacancy energy fluctuationsδas (whereδ1= −δ2) [Fig.4(b)], the corresponding sections of the PESs exhibit an avoided crossing with a minimum energy gap of 2t. This avoided crossing will be shown to have a profound influence on the phonon broadening and the formation of delocalized states.
As for the single vacancy, the result for the phonon broadening of the tunneling through the divacancy states turns out to have a simple physical form in the prevailing strong electron-phonon coupling and electronically adiabatic limits, as detailed in AppendixC 2. The phonon broadening is then determined by probabilities for vertical Franck-Condon transitions from the vibrational ground-state of the PES of the electronic ground-state to vibrational states on the two PESs for the divacancy states [gray arrows in Figs.4(c)and4(d)].
In the strong electron-phonon coupling limit, the transition probabilities are dominated by the contribution from the linear electron-phonon coupling terms. The corresponding phonon broadenings are then simply obtained from the changes in the divacancy energy levels ˜εb(bonding state) and ˜εa(antibonding state) with the Gaussian fluctuations of the energiesδε1 and δε2due to the zero-point motions of the phonons.
The strong coupling result for the phonon broadening of the divacancy states is illustrated in Figs. 4(c) and4(d). A
symmetric fluctuationδεs(whereδε1 =δε2) results, as shown in Fig.4(c), in a linear dependence of ˜εb and ˜εa onδεs with a slope of one, but they are split by 2t. These Gaussian fluctuations then give rise to two overlapping Gaussian line shapes centered atε0±twith a variance ofδεs2for the local density of states (LDOS).
In contrast, the level repulsion results in a minimum energy separation 2t between ˜εband ˜εa for an antisymmetric fluctuationδεas(whereδε1= −δε2). Furthermore,δεasbreaks the symmetric and antisymmetric character of the two coupled VSs, and they tend to localize on each vacancy forδεast.
The resulting LDOS from these Gaussian fluctuations, shown in Fig.4(d), consists of two relatively sharp, highly asymmetric line shapes, with mean energies separated by more than the energy splitting 2t. In general, the fluctuationsδε1andδε2of the two vacancy energies will be a superposition of bothδεsand δεas. In the case of uncorrelated vacancy energy fluctuations δε1δε2 =0, the LDOS is a convolution of the line shape from δεas with a Gaussian line shape with a variance ofδε21,2/2 becauseδεsandδεascontribute equally toδε21,2, the variance of the single vacancy energy fluctuations. As the Gaussian shape dominates the broadening in such a convolution, the resulting LDOS as displayed in Fig.4(e)has a similar shape as two Gaussians with a FWHM reduced by almost 1/√
2 as compared to an isolated vacancy. This decrease of the broadening in the uncorrelated case is the underlying reason why the observed broadenings of the levels of the chains decrease with chain size.
For instance, uncorrelated vacancy site energy fluctuations can arise in situations where the vacancy energy fluctuations are dominated by localized modes at each vacancy such as optical phonons with nearly flat dispersions. In reality, however, a given individual phonon mode may act on the energy of both vacancies in a symmetric or antisymmetric fashion (consider e.g. the motion of an ion centered between two vacancies). Hence partially correlated vacancy site energy fluctuations cannot be excluded. Our experimental results are consistent with the assumption of fully uncorrelated fluctuations of the two VSs. Interestingly, in the uncorrelated case, the LDOS, shown in Fig.4(e)(red line), exhibits two peaks with an apparent separation that is substantially larger than the intrinsic, purely electronic splitting of 2t. This result is a characteristic effect of the level repulsion between ˜εb
and ˜εa and is in sharp contrast to a superposition of two monovacancy resonances separated by the intrinsic splitting [shown in Fig.4(e)(blue line)]. In the latter case, one would not be able to identify separate peaks due to the larger broadening and smaller splitting.
The enhancement of the apparent peak separation in the uncorrelated case over the intrinsic splitting is shown in Fig.4(f)as a function of the scaled intrinsic energy splitting 2t /σ, whereσ is the broadening of a single VS. We define the apparent peak separationε˜ as the separation between the centers of the two Gaussian line shapes with broadening (FWHM) ˜σ fitted to the calculated LDOS. The relative enhancement˜ε/2tof the apparent splitting is most important for small t. For large t, the splitting of divacancy energy levels approaches the intrinsic energy splitting of 2t. As for the single vacancy level, the broadening of a divacancy level
(b) (a)
(e) (f)
energy (eV)
potential energy (eV)
0.5 1 1.5 2
0 2.5
0 0.2 0.4 0.6 0.8 1
0 0.5 1 1.5 2
/~
2t/
uncorrelated intrinsic/correlated broadening
3NN
2NN
4NN 1
02.2 2.4 2.6 2.8 3.0 3.2
LDOS (a.u.)
superposition
3NN
~ 2t
(c) (d)
level splitting / energy level (eV) 2 0
as (eV) ( 1 = - 2)
exp. splitting
2t
2t 0
1 5
4
3
2
s (eV) ( 1 = 2)
0 0.2 0.3
-0.2
-0.3 -0.1 0.1
3
2.5 3.5
1
2 s as
~b
~a
LDOS 8.3
0 pdf (1/Å) potential energy (eV) 0 1 5
4
3
2
2t
8.3
0
4.9
0 pdf (1/eV)
s (eV) ( 1 = 2)
pdf (1/eV)
energy level (eV)
0 0.2 0.3
-0.2
-0.3 -0.1 0.1
2
0 3
2.5
4.9
0 2t ~b
~a
LDOS
uncorrelated
pdf (1/Å)
/ /
-1 -0.5 0 0.5 1
as (eV) ( 1 = - 2)
-1 -0.5 0 0.5 1
FIG. 4. (Color online) (a) and (b) Calculated adiabatic potential energy surfaces (PESs) of the electronic ground-state (black) and the electroni- cally excited and singly occupied diva- cancy states (red and blue) as a func- tion of symmetric and antisymmetric on-site vacancy energy fluctuationsδεs
(a) and δεas (b), respectively (see Ap- pendix C 2). The vibrational ground- state probability distribution functions (pdf) ofδεs(a) andδεas(b) are indicated by the green curves. Here, 2t is the intrinsic electronic level splitting. The inset in (a) showsδεsandδεasin terms of the on-site vacancy energy fluctuations δε1 and δε2. The black crosses mark the equilibrium values of δε1 and δε2
of the two energy minima when the divacancy is occupied by a single elec- tron. (c) and (d) Energy-level diagram for the divacancy states as a function of δεs (c) and δεas (d). The vertical gray arrows indicate the electron-attachment process and the black curves the re- sulting LDOS. (e) Calculated LDOS of the 3NN divacancy for uncorrelated vacancy energy fluctuations (red), which is compared to a superposition of two Gaussians separated by 2t and each with a broadening σ (blue). ˜ε de- notes the level splitting for uncorrelated vacancy energy fluctuations. (f) Scaled level splitting ˜ε/σ as obtained from a Gaussian fit to the calculated line shapes of the divacancy states for un- correlated vacancy energy fluctuations (red) compared to the intrinsic splitting (blue) as a function of the scaled in- trinsic level splitting 2t /σ. The calcu- lated and observed scaled splittings for different divacancy configurations are indicated by black squares and dashed horizontal lines, respectively. The green curve shows the apparent level broaden- ing ˜σ for uncorrelated vacancy energy fluctuations.
then scales with the square root of its relaxation energy (see AppendixC 2).
The hopping terms t can be extracted from Fig.4(f) by taking˜εequal to the observed splitting and using the single vacancy value 0.27 eV forσ. For example,t =0.11 eV was obtained from ˜ε=0.28 eV for the 3NN divacancy. The values obtained for the hopping termst are very reasonable as supported by density-functional theory (DFT) calculations of the unoccupied Kohn-Sham states of Cl divacancies in NaCl(2ML)/Cu(111). As shown in Fig. 4(f), the calculated values for 2t of the various divacancy configurations are
close to the values for the intrinsic splittings extracted from experimental data. However, the absolute divacancy energies are underestimated by the DFT calculations, as expected [see Fig.6(e)].
The coupling between the LISs of Cl divacancies and chains were studied in a simple, multiple σ-wave (zero angular momentum in 2D) scattering model of the interface- state scattering from the positively charged vacancies (see AppendixC 3). The results from this model, as indicated in Figs.1(o)–1(q), are able to fully capture the observed behavior of the coupled LISs. The absence of a LIS doublet below the
onset of the interface-state band is simply understood by the relatively strong interaction between the weakly bound LISs of the two vacancies at small intervacancy distances. With increasing distances between the vacancies, this interaction decreases, and a second LIS appears below the band onset.
The observed symmetric character of the LIS below the band edge and antisymmetric character of the extended LIS above εB for the 3NN vacancy are also revealed in the calculated LDOS images (see Fig.8). Furthermore, the obtained energies for the LISs of the vacancy chains are in excellent agreement with the experiments, as indicated in Fig.2(b).
IV. CONCLUSIONS
In summary, from an AFM and STS study, we find that the localized VSs and LISs at intentionally created Cl divacancies in a NaCl bilayer on Cu(111) form symmetric and antisymmetric states, in analogy to the bonding and antibonding orbitals of a hydrogen molecule. As expected, the energy splitting between these states increases with decreasing intervacancy distance. A comparison with theory shows that the energy splitting of the VSs is significantly enlarged by the strong coupling of the tunneling electrons with phonons in the NaCl film. Furthermore, VSs and LISs of vacancy chains form one-dimensional quantum-well states. The VS levels of the chains could be well described by a simple tight-binding model that takes the electrostatic interaction between neighboring vacancies into account. The model provides also a microscopic understanding why the level broadening is reduced with increasing chain size.
ACKNOWLEDGMENTS
We thank R. Allenspach for comments and acknowledge financial support from the ERC Advanced Grant CEMAS (agreement no. 291194) and the EU projects PAMS (610446) and QTea (317485). Allocation of computer resources through SNAC and CSC is gratefully acknowledged.
APPENDIX A: DISTANCE DEPENDENCE OF THE VSS AND LISS OF DIFFERENT CL DIVACANCIES TableIlists all measured and calculated values of the VS and LIS for different divacancy geometries. The calculations are explained in the subsequent paragraphs. For the VSs, the experimental energies were obtained by fitting two Gaussians to thedI /dV(V) spectra. The theoretical results were obtained from a phonon-broadening model, in which the intrinsic electronic splitting parameter t was calculated by density- functional theory (DFT) (see AppendixCfor details).
In the case of the LISs, the experimental energies were obtained by fitting two Lorentzians to thedI /dV(V) spectra.
The theoretical results were obtained from a phenomenologi- cal scattering model with parameters taken from independent experiments (see Appendix C 3 for details). For both VSs and LISs, the experimental and theoretical results demon- strate increasing level splitting with decreasing intervacancy distance.
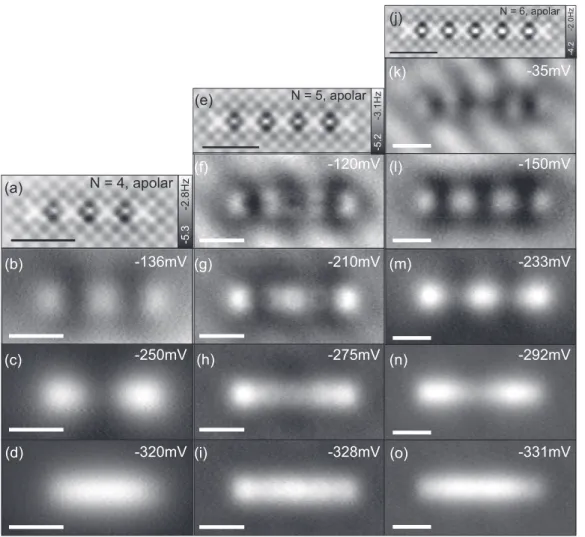
APPENDIX B: CL VACANCY CHAINSd I/d V(x,y) MAPS In Fig.5, constant-height AFM anddI /dV(x,y) maps of Cl vacancy chains (N =4,5,6) in the 5NN configuration are shown. EachdI /dV(x,y) map is recorded at the bias corre- sponding to a LIS resonance. The states have the typical shape of 1D quantum-well eigenstates. Above the NaCl/Cu(111) interface band onset atεB = −230 mV, however, these states are obscured by the states of the 2D free-electron band at the interface that give rise to standing-wave patterns [31].
APPENDIX C: MODELING OF VACANCY STATES AND LOCALIZED INTERFACE-STATES
The tunneling through the divacancy states in the absence of electron-phonon coupling has been simulated by DFT calculations, whereas the phonon broadening of the VSs of divacancies and longer chains has been modeled by a generalization of our earlier phonon-broadening model for a single vacancy in the strong electron-vibration coupling limit [32]. In the case of the LIS of mono- and divacancies,
TABLE I. Distance dependence of VS and LIS of Cl divacancies. Experimental and theoretical energy positions of the VSs and LISs [obtained from a superposition of two Gaussians (for VSs) or Lorentzians (for LISs)] of the dI /dV measurements and LDOS for Cl divacancies at various intervacancy distancesd.EsandEasrefer to the observed energy positions of the symmetric and antisymmetric states, andE denotes the corresponding level splitting. For the VSs,εis the level splitting obtained in the phonon broadening model using the level splittings 2tobtained from the DFT calculations, whereas for the LISs,εis the energy difference between the energiesεsandεasof the symmetric and antisymmetric states in theσ-wave, multiple scattering model.
VS (experiment) VS (theory) LIS (experiment) LIS (theory)
d( ˚A) Es(V) Eas(V) E(V) 2t ε(eV) Es(V) Eas(V) E(V) εs(eV) εas(eV) ε(eV) 2NN 5.6 2.43 2.92 0.49 0.42 0.45 −0.315 n/a n/a −0.322 n/a n/a
3NN 7.8 2.58 2.86 0.28 0.26 0.30 −0.308 n/a n/a −0.299 n/a n/a
4NN 8.7 2.67 2.85 0.18 0.16 0.21 −0.304 n/a n/a −0.293 n/a n/a
5NN 11.3 2.77 n/a n/a −0.282 −0.169 0.113 −0.281 −0.168 0.113
6NN 12 2.73 2.75 0.02 −0.29 −0.133 0.157 −0.279 −0.177 0.102
9NN 16 2.74 n/a n/a −0.277 −0.158 0.119 −0.269 −0.210 0.059
single ∞ 2.8 n/a n/a −0.249 n/a n/a −0.249a n/a n/a
aModel parameter taken from measurements.
-4.2-2.0Hz
N = 6, apolar
-331mV -292mV -233mV -150mV -35mV (j)
(k)
(l)
(m)
(n)
(o) -120mV
-210mV
-275mV
-328mV
-5.2-3.1Hz
N = 5, apolar (e)
(f)
(g)
(h)
-320mV (i) -250mV -136mV
-5.3-2.8Hz
N = 4, apolar (a)
(b)
(c)
(d)
FIG. 5. (a), (e), and (j) Constant-height AFM images of the 5NN chain withN=4,5, or 6 Cl vacancies with a CO tip. (b)–(d) Constant- height dI /dV(x,y) maps of the LISs of the N=4 chain. (f)–(i) Constant-height dI /dV(x,y) maps of the LISs of the N=5 chain.
(k)–(o) Constant-heightdI /dV(x,y) maps of the LISs of theN=6 chain. Note that the standing-wave patterns [31] above the interface-state band onset (εB= −230 mV) partly conceal the quantum-well states. Scale bars: 20 ˚A.
a DFT treatment is not practical because of the large system size required to describe the interface-state band, and we used instead a simple phenomenological model for the multiple scattering of the interface-state electrons from the vacancies.
The parameters of this model were determined by the observed interface state dispersion and bound state energy of the LIS for a single vacancy.
In all cases, the modeling of electron tunneling through the chain of vacancies is based on the Tersoff-Hamann (TH) approximation [38,39]. This approximation for the tunneling amounts to a simplified description of the tip using aσ-wave approximation for the electrons emitted from the tip apex and a Bardeen approximation for the tunneling, which is justified at large tip-surface distances and low biasesV. The differential tunneling current dVdI(V) then has a simple and transparent form in terms of the local density of states as
dI
dV(V)∝ −1
πImrt|g(εˆ F+eV)|rt, (C1) where rt is the position of the tip apex andεF is the Fermi energy. In principle, ˆg(ε) is the one-electron Green function
for the interacting electron system, including electron-phonon coupling.
1. DFT calculations of divacancy states
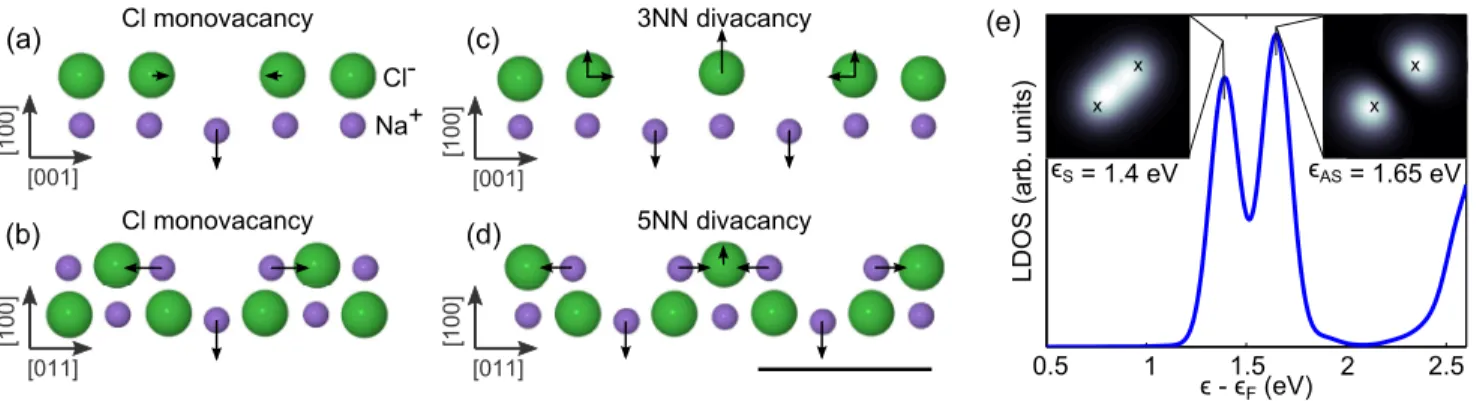
The divacancies 2NN, 3NN, 4NN, and 5NN3were geomet- rically optimized in the DFT calculations (see main text for details of the calculations). The resulting relaxed structures and the corresponding changes in atomic positions are illustrated in Figs.6(c)and6(d)for the 3NN and 5NN divacancies. These changes are similar to those obtained for a monovacancy, as shown in Figs.6(a)and6(b).
The calculated LDOS images at the energies of the VS peak doublet in the calculated spectra, shown in the insets of Fig.6(e), corroborate the experimental finding that the VS at lower energy is symmetric and the state at the higher energy is antisymmetric. The calculated energies of the symmetric
3Note that because of periodic boundary conditions, the 5NN divacancy in the supercell chosen corresponds to an infinite chain of vacancies.
(b) (d) (a)
(b (d
(a)
b) (dd)d)
Cl monovacancy
Cl monovacancy
3NN divacancy
5NN divacancy Cl-
Na+
[001]
[100]
[001]
[100]
[011]
[100]
[011]
[100]
(c) (e)
- F (eV)
S = 1.4 eV
x x x
x
0.5 1 1.5 2 2.5
LDOS (arb. units)
AS = 1.65 eV
FIG. 6. (Color online) (a) and (b) Cl monovacancy geometry in the polar (a) and apolar (b) direction. Largest displacements around a vacancy: nearest Na: 0.28 ˚A (lateral), Na below vacancy:−0.34 ˚A (vertical). For clarity, only the NaCl bilayer is shown. (c) and (d) Cl divacancy in the 3NN (c) and 5NN (d) configurations. Largest displacements around a 3NN divacancy: nearest Cl: 0.13/0.23 ˚A (lateral/vertical), middle Cl: 0.38 ˚A (vertical), nearest Na: 0.29 ˚A (lateral), Na below vacancy:−0.32 ˚A (vertical). Largest displacements around a 5NN divacancy:
nearest Cl: 0.15/0.22 ˚A (lateral/vertical), middle Cl: 0.16 ˚A (vertical), nearest Na: 0.27 ˚A (lateral), Na below vacancy:−0.32 ˚A (vertical).
Black arrows indicate the relative strength of the relaxations of ions that are displaced by more than 0.1 ˚A. (e) Calculated LDOS at 6 ˚A above a vacancy site of the 3NN divacancy in the NaCl bilayer on Cu(111). The insets show LDOS maps at 6 ˚A above the uppermost NaCl plane at the energies corresponding to the symmetric and antisymmetric VS. Scale bar is 10 ˚A.
and antisymmetric 3NN VS correspond toεs =1.4 eV and εas=1.65 eV, respectively. Note that the calculated energies correspond to one-electron energies of unoccupied Kohn- Sham states and not to the excited state energies corresponding to the electron attachment energies to the resonance states.
As previously found in the case of the monovacancy [32], the Kohn-Sham energy underestimates this attachment energy by roughly 0.5–1 eV. However, the relative energies of unoccupied states are typically much better described by DFT calculations.
The values obtained for the energy difference between the symmetric and antisymmetric states for the 2NN, 3NN, and 4NN are shown in Table I. These values are used as input parameters in the phonon-broadening model described below, as they are only due to the electronic coupling between the states.
2. Phonon broadening of chain vacancy states
In our previous theoretical treatment of the resonance tunneling through asingle VS, we applied a simple resonance- level model coupled to a single Einstein phonon mode [32]. In particular, we showed that the strong electron-phonon coupling limit, which prevails in our case, results in a Gaussian envelope of the VS line shape in the resonance tunneling spectra. Here we generalize this model to resonant tunneling through the states of a linear chain of vacancies(including a divacancy) but now coupled to a general phonon bath characterised implicitly by a correlation function for the phonon fluctuations of the on-site vacancy energies. In particular, we consider the two extreme limits for this function corresponding to uncorrelated and fully correlated phonon fluctuations of the on-site vacancy energies. Furthermore, as in the case of the single VS, we solve this model in the strong electron-phonon coupling limit.
To ease the presentation, the formalism is developed at zero temperature but the final results for the LDOS are also valid at nonzero temperature.
The electronic part of the single resonance level Hamil- tonian is straightforwardly generalised to N resonance
levels as
Hˆe(0)=Hˆa(0)+Hˆam, (C2) where
Hˆa(0)=ε(0)a
i
|ψaiψai| −
i,j
t(|ψaiψaj| +H.c.), (C3) is the Hamiltonian for the vacancy states and
Hˆam=
k
εk|ψkψk| +
i
k
(Vik|ψaiψk| +H.c.). (C4) is the Hamiltonian describing the interaction of the vacancy states with the metal states. Herer|ψaiare wave functions of the multiple VSs, labeled byi(i=1,2, . . . ,N), with degen- erate energiesεa(0), and−t <0 is the direct interaction energy between nearest-neighboring (i,j) VSs. The eigenstates of Hˆa(0)turn into resonances through the interactionVikwith the band of metal states|ψkwith energiesεk. The phonon part of the Hamiltonian has the general form
Hˆv=
λ
p2λ
2 +ω2λqλ2 2
. (C5)
Here,qλis the normal coordinate of the phonon modeλwith energyωλandpλis the associated momentum. The phonons are assumed to couple linearly inqλto the on-site energy of the VS ati. Thus the electron-phonon coupling ˆHevis only through the on-site energies and is then, as in the Holstein Hamiltonian, given by
Hˆev=
λ
εaiλqλ|ψaiψai|. (C6) Here the coupling strengthεaiλis given by the first derivative of the vacancy energyεaiof siteiwith respect to the normal coordinateqλ.
To proceed, we need the local density of states of the electron at the position of the tip apexrt, which according
to Eq. (C1) is given by ρ(ε,rt)= −1
πIm
⎛
⎝
i,j
rt|ψaigaij(ε)ψaj|rt
⎞
⎠, (C7)
where the matrix elements of the Green function with respect to the impurity states are given by
gaij(ε)= ψai|{0λ}λ|(ε+i0+−Hˆ)−1|{0λ}λ|ψaj. (C8) Here, |{0λ}λ = λ|0λ is the ground state for the phonon system and|0λis the ground state of the phononλand ˆH = Hˆe(0)+Hˆv+Hˆev. Eliminating the metal states in the wide metal band limit, one obtains in a standard manner:
gaij(ε)= {0λ}λ|ψai|
(ε+iγ) ˆIa−Hˆa(0)−Hˆev−Hˆv−1
×|ψaj|{0λ}λ, (C9) where γ is the energy-independent resonance broadening of the VSs due to their coupling with the metal states. Here, we have neglected the indirect couplings between the VSs mediated by the metal states, which are expected to be negligible for the weak coupling of the VSs to the metal states.
A further key simplification arises in the prevailing strong electron-vibration coupling and narrow resonance limits, in which ˆHvcan be neglected compared to ˆHevand a negligible life time broadeningγcompared to the phonon broadening of the electronic states,
ρaij(ε)≡ − 1
2π i(gaij(ε)−g∗aj i(ε)) (C10)
≈
··· λ
dqλ|qλ|0λ|2ψai|
×δ
εIˆa−H˜a(0)−H˜ev
|ψaj, (C11) where
q|0λ = 1
δqλ
√2π exp
− q
2δqλ
2
(C12) is the ground-state wave function of the phonon modeλ. The zero-point fluctuations of the phonon normal coordinatesqλ associated with these wave functions result in a multivariate Gaussian distribution of fluctuations of the vacancy on-site energies:
δεi=εai−εa(0)=
λ
εaiλqλ. (C13) The multidimensional integral over the normal coordinates in Eq. (C11) can then be reduced to a multidimensional integral over the vacancy energy fluctuations given by
ρaij(ε)=
···
idδεi
(2π)NdetCexp
⎛
⎝−
i,j
Cij−1δεiδεj/2
⎞
⎠
×ψai|δ(εIˆa−Hˆa({δεi}i))|ψaj, (C14) where
Hˆa({δεai}i)=Hˆa(0)+
λ
δεi|ψaiψai| (C15) and
Cij = δεaiδεaj =
λ
εaiλεaj λ 2ωλ
(C16) is the correlation function for vacancy on-site energy fluctua- tions at zero temperature. Here we have not attempted to cal- culate this correlation function in terms of the phonon modes, but considered instead the uncorrelated limit corresponding to
Cij = δεa2
δij, (C17)
and the fully correlated limit corresponding to Cij =
δε2a
. (C18)
Here,δεa2is obtained from the phonon broadening of a single VS.
For a single vacancy, the DOS in Eq. (C14) simply reduces to a Gaussian line shape,
ρa(ε)=g
ε−εa(0)
= 1
√2π σ exp
−
ε−ε(0)a 2 2σ2
, (C19) and is simply given by the fluctuations of the resonance energy induced by zero-point motion of the phonons. Here, σ2= δε2a, and the full width at half maximum (FWHM) of the broadening is then given by
σFWHM=2
2 ln 2 δεa2
. (C20)
In the uncorrelated limit forCij, the multivariate Gaussian distribution of δεi is independent over the different sites.
Accordingly, the LDOS in Eq. (C14) is obtained from Eqs. (C7) and (C11) by inserting the eigenenergiesεκ({δεi}i) and the eigenstates,
|ψκ({δεi}i) =
j
cκj({δεi}i)|ψaj, (C21) of ˆHa({δεi}i) into Eq. (C15) as
ρ(ε,rt)≈
··· i
dδεig(δεi)
j
cκj({δεi}i)r0|ψaj
2
×δ(ε−εκ({δεi}i)). (C22) The total DOS or the level distribution,ρ(ε), is obtained by an integration overr0and is then given by
ρ(ε)≈
κ
··· i
dδεig(δεi)δ(ε−εκ({εi}i)). (C23) The eigenstates and eigenenergies of ˆHa({δεi}i) will depend nonlinearly on the vacancy energy fluctuations {δεi}i. This dependence can be solved analytically for the divacancy, and the LDOS and the level distribution can then be obtained by a numerical quadrature as detailed below. The LDOS and the level distributions of longer chains can be efficiently generated by a Monte-Carlo sampling of the Gaussian distributions in the multidimensional integrals overδεi and a diagonalization of the corresponding ˆHa({δεi}i) for each sampled{δεi}i.
Before showing explicitly how the results for the level distribution of a divacancy were obtained for uncorrelated vacancy energy fluctuations from Eq. (C23), we will first
show how the results in Figs. 4(a)–4(d) for the divacancy were obtained. The energy levels in Figs.4(c)and4(d)were obtained by diagonalizing ˆHa(δε1,δε2) for fixedδε1andδε2. The eigenenergies of this two-state, eigenvalue problem are given by
˜
εa,b=ε(0)a +δεs±
t2+δε2as, (C24) where
δεs = 12(δε1+δε2) (C25) δεas= 12(δε1−δε2) (C26) are the symmetric and antisymmetric components ofδε1and δε2, respectively. For a symmetric fluctuation,δε1=δε2, the two divacancy states
˜
εa,b =ε(0)a +δεs±t, (C27) will shift rigidly withδεs[Fig.4(c)], whereas an antisymmetric fluctuation,δε1= −δε2, will shift them with respect to each other with a minimum splitting of 2t [Fig.4(d)] as
˜
εa,b=ε(0)a ±
t2+δεas2 . (C28) The two adiabatic potential energy curves in Figs.4(a)and 4(b)were obtained by first minimizing the potential energy of the phonons,
V({qλ}λ)=
λ
ω2λqλ2
2 , (C29)
with respect toqλunder the constraint thatδε1andδε2are both fixed. The resulting minimum value of this potential energy is then given by
Vmin(δε1,δε2)=
ij
1
2Kij−1δεiδεj, (C30) where
Kij =
λ
εaiλεaj λ
ω2λ . (C31)
Under the assumption that the phonon relaxation energy of a localized vacancy state in the divacancy, as obtained by minimizing,Vmin(δε1,δε2)+δεi, is the same as for the isolated single vacancy thenK12=0 and
Vmin(δε1,δε2)=
i
δεi2
4Erel, (C32)
where
Erel= K11 2 =K22
2 (C33)
is the phonon relaxation energy for a single vacancy. The adiabatic potential energy curves Va,b for δas and δs in Figs.4(a)and4(b)are then given by
Va,b(δεs)=εa(0)+δεs±t+ δεs2
2Erel, (C34) Va,b(δεas)=εa(0)±
t2+δεas2 + δε2as
2Erel. (C35)
The results in Figs. 4(a)–4(d) were based on parameters appropriate for the 3NN vacancy ε(0)a =2.73 eV and t = 0.13 eV. The relaxation energy was estimated using the following expression, as obtained from Eqs. (C16) and (C31):
Erel= δεa2
ω¯ , (C36)
where the characteristic phonon frequency ¯ω is defined in terms of a ratio of frequency moment as
¯ ω=
λ(aλ)2ωλ−1
λ(aλ)2ωλ−2. (C37) Using the value 32 meV of a typical NaCl optical phonon energy [40] for ω¯ and
δεa2 =0.115 eV as obtained from the observed σFWHM=0.27 eV, this estimate gives Erel=0.41 eV. Note that in our previous work [32] on the phonon broadening of the single vacancies, the broadening was extracted using the calculated relaxation energy of about 1 eV, which using the same value forω¯ gave a somewhat larger value for the phonon broadening than the observed one.
Now we proceed by showing the results for the level distribution of a divacancy. Using the result for the energy levels in Eq. (C24), the level distribution for uncorrelated vacancy energy fluctuations, Eq. (C23), can be expressed as
ρ(ε)=
±
dδεsdδεasg(δε˜ s) ˜g(δεas)
×δ
ε−ε(0)a −δεs∓
t2+δεas2
, (C38) where ˜g(δε) is the Gaussian function in Eq. (C19) but now with
˜
σ2=σ2/2= δε2a/2. The linear dependence of the divacancy energies on δεs show that ρ(ε) is simply a convolution of
˜
g(ε) with the level distribution, ρas(ε) for antisymmetric fluctuations of the vacancy energies, which is given by
ρas(ε)=
±
dδεasg(δε˜ as)δ
ε−ε(0)a ∓
t2+δε2as .
(C39) The corresponding distribution for symmetric fluctuations of the vacancy energies is then given by
ρs(ε)=
±
˜ g
ε−εa(0)∓t
. (C40)
Finally, in the fully correlated limit for the chain of the vacancies, δεai=δεa and the probability distribution collapses to a single Gaussian distributiong(δεa). In this case, H˜e({εai}i)=H˜e(0)+δεaI˜a, and its eigenstates are the same as for ˜He(0)and the eigenenergiesεκ of ˜Heare simply shifted by δεa from the eigenenergiesε(0)κ of ˜He(0). Thus, in this case, the LDOS and the level distribution are given by
ρc(ε,rt)≈
κ
i
cκir0|ψai
2
g
ε−εκ(0)
(C41) and
ρc(ε)≈
κ
g
ε−ε(0)κ
. (C42)
![TABLE I. Distance dependence of VS and LIS of Cl divacancies. Experimental and theoretical energy positions of the VSs and LISs [obtained from a superposition of two Gaussians (for VSs) or Lorentzians (for LISs)] of the dI /dV measurements and LDOS for Cl](https://thumb-eu.123doks.com/thumbv2/1library_info/5586579.1690560/7.911.75.840.929.1112/dependence-divacancies-experimental-theoretical-superposition-gaussians-lorentzians-measurements.webp)