Rising Labour Market Inequality:
Regional Disparities and Wage- Setting Institutions
Terry Gregory
University of Regensburg
Seite 1 von 1
10.02.2015 file:///D:/Dissertation/graphics/Universität_Regensburg_logo.svg
Rising Labour Market Inequality:
Regional Disparities and Wage-Setting Institutions
Dissertation
zur Erlangung des Grades eines Doktors der Wirtschaftswissenschaft
eingereicht an der Fakultät für Wirtschaftswissenschaften der Universität Regensburg
vorgelegt von:
Dipl.-Vw. Terry Gregory
Berichterstatter:
Prof. Dr. Dr. h.c. Joachim Möller JProf. Dr. Melanie Arntz
Tag der Disputation: 26.1.2015
Acknowledgment
After finishing this long thesis, it is a pleasure to devote some lines to all the people that I owe so many thanks. First of all, I would like to thank Joachim Möller for supervising my PhD thesis.
I am very grateful for receiving so many helpful and constructive comments during various doctoral seminars in Regensburg. I always enjoyed the atmosphere in the seminars and left Regensburg with a long list of valuable suggestions on how to improve my work. Many thanks also to all his PhD students and postdocs that stimulated an exciting discussion during these events. Thank you also to Jürger Jerger for beeing an excellent chairman during my defence in Regensburg.
A special warm thank you goes to Melanie Arntz who did excellent on-site supervision at ZEW. I really enjoyed the spirit of some Friday evening discussions when ZEW turned into a ghost house while we discussed scientific problems for hours, drawing wild pictures on white boards, and generating a continuous series of aha!-effects. This surely taught me how to think through and eventually solve an economic problem. I guess the fact that we share the same
“Rheinish” mentality also helped provide us with an optimum communication base. I really feel lucky to have such a great supervisor and mentor.
I also benefited from an excellent research environment at ZEW. My thanks go to the entire department for numerous discussions, helpful feedback and an inspiring atmosphere. Special thanks to Stephan Dlugosz, Bernd Fitzenberger and Francois Laisney for providing helpful assistance whenever simple OLS regressions did not do the job. I also owe many thanks to Jan Melcher, Rahel Felder and Helge Matthiessen for excellent student assistance. My gratitude also goes to Holger Bonin and the ZEW management for all their support and trust during my PhD.
We often take things for granted, but we shouldn’t.
Furthermore, I would like to thank my co-authors Roberto Patuelli, Florian Lehmer and Bodo Aretz for their contributions that helped to shape our joint research. Moreover, I would
I
and suggestions on my research. Also, thanks to Ulrich Zierahn, Anna Salomons, Konrad Stahl, Michael Meier and Sebastian Butschek for reading parts of my thesis and coming up with helpful suggestions on how to improve my work.
Of course, money is not everything, but without money, all is nothing. My research would not have been possible without the financial support of the Fritz-Thyssen Foundation, German Research Foundation, ZEW Sponsors’ Association for Science and Practice, Ministry of Labour and Social Affairs and several ZEW internal funding opportunities for which I feel very grateful.
Note that the authors are responsible for all results and conclusions derived in this dissertation and do not necessarily reflect the views of the sponsors.
I would also like to thank my family and friends, especially my parents. My mother’s discipline and my father’s optimistic American way of life has always been something that I took as an example and which shaped my thought probably more than I would admit – thank you so much! Finally, I owe a big thank you to my beloved wife who always supported me with personnel advice and understanding in times when work demanded extra hours. Her patience and support during the end of my thesis, when I was finalizing several papers at the same time, was beyond what one can hope for in challenging times. The least I can do is dedicate this thesis to my biggest supporter.
Mannheim, August 2014 Terry Gregory
II
To Luisa
Contents
Acknowledgement I
Content V
List of Tables X
List of Figures XII
Introduction 1
I Demographic Change and Regional Labour Market Disparities 15
1 Demographic Ageing and the Polarization of Regions - An Exploratory Space-
Time Analysis 17
1.1 Introduction . . . 18
1.2 The Polarization of Regions . . . 20
1.3 Innovation and Demographic Measures . . . 22
1.4 Global and Local Spatial Autocorrelation . . . 26
1.4.1 Global spatial autocorrleation . . . 27
1.4.2 Local Indicators of Spatial Association . . . 29
1.5 Space-Time Dynamics . . . 32
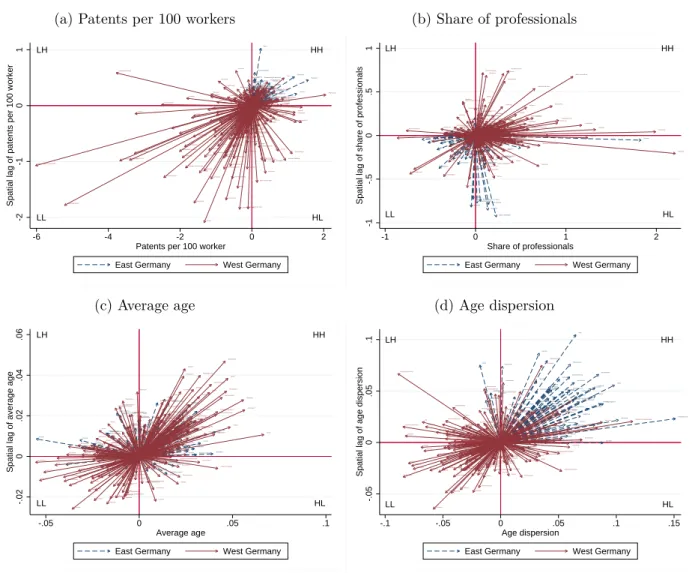
1.5.1 Standardised Directional Moran Scatterplots . . . 32
1.5.2 Space-Time Transitions . . . 35
1.6 Conclusion . . . 38
1.A Appendix . . . 41
2 What Old Stagers Could Teach Us - Examining Age Complementarities in
Regional Innovation Systems 47
2.1 Introduction . . . 48
2.2 Regional Knowledge Production Function . . . 50
2.3 Data . . . 54
2.4 Descriptives . . . 56
2.5 An IV Approach to Estimating the Regional Knowledge Production Function . . 60
2.6 Estimation Results . . . 64
2.7 Conclusion . . . 72
2.A Appendix . . . 74
3 Can Regional Employment Disparities Explain the Allocation of Human Cap- ital Across Space? 81 3.1 Introduction . . . 82
3.2 Theoretical Framework . . . 84
3.3 Data . . . 90
3.4 Descriptives . . . 98
3.5 Empirical Analysis . . . 102
3.6 Robustness . . . 107
3.7 Conclusion . . . 110
3.A Appendix . . . 113
II Minimum Wage Effects Along the Wage Distribution 115 4 The Minimum Wage Affects Them All: Evidence on Employment Spillovers in the Roofing Sector 117 4.1 Introduction . . . 118
4.2 The German Roofing Sector . . . 121
4.3 Administrative Linked Employer-Employee Data . . . 124
4.4 The Minimum Wage and Its Bite . . . 127
4.5 Employment Effects . . . 131
Contents
4.6 Robustness . . . 140
4.7 Conclusion . . . 143
4.A Appendix . . . 145
5 When the Minimum Wage Bites Back: Quantile Treatment Effects of a Sec- toral Minimum Wage in Germany 151 5.1 Introduction . . . 152
5.2 Literature on Minimum Wage Spillovers . . . 155
5.3 The German Roofing Sector . . . 158
5.4 Administrative Linked Employer-Employee Data . . . 162
5.5 Minimum Wage Bite and the Development of Wages . . . 164
5.6 Quantile Treatment Effects on the Distribution of Earnings . . . 170
5.7 Conclusion . . . 181
5.A Appendix . . . 184
Conclusion and Outlook 191
Bibliography 197
List of Tables
1.1 LISA transition probabilities for innovation and demographic measures (1995-2008) 36 2.1 Summary statistics for German labour market regions, 1994-2008 . . . 59 2.2 Cross-sectional estimates for West German regions . . . 65 2.3 Structural estimates of marginal products, second order and cross-partial deriva-
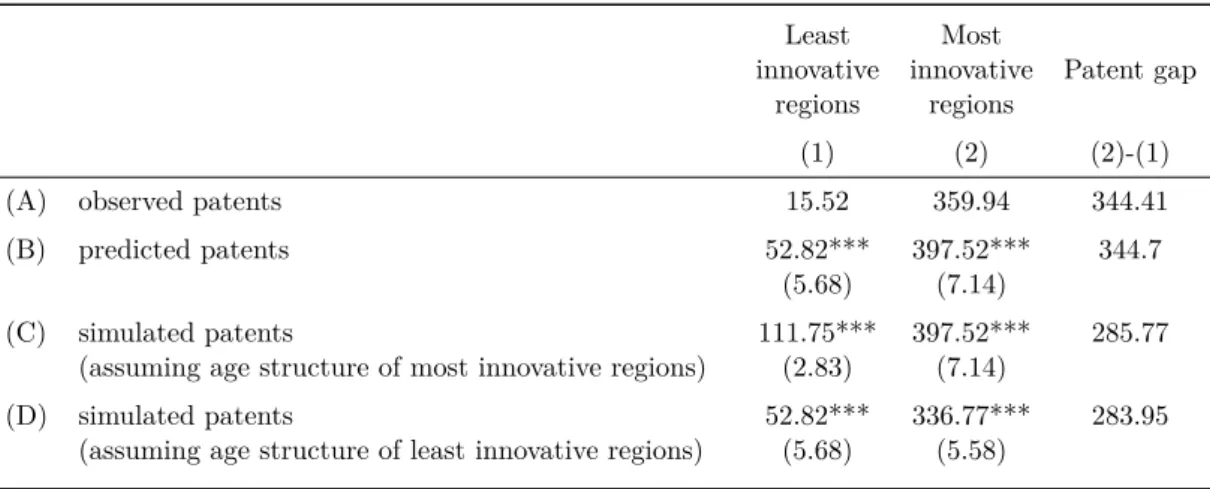
tives from Equation 2.5 (West-Germany) . . . 67 2.4 Observed, predicted and simulated performance gap between least and most
innovative regions with counterfactual age structures . . . 71 3.1 Summary statistics for gross labour flows and employees staying in the sending
region, 1995-2004 . . . 93 3.2 Average interregional disparities by skill quintile of the labour flows within and
between Eastern and Western Germany, 1995-2004 . . . 99 3.3 Average skill level of gross labour flows, 1995-2004 . . . 104 3.4 Log migration rates by quintile of the skill distribution, labour flow fixed effects
estimation 1995-2004 . . . 106 3.5 GMM estimation of the average and the relative average skill Level of gross
migration Flows . . . 109 4.1 Indicators of the MW bite measured in June prior to the next MW regulation,
LAK and BA data . . . 128 4.2 Characteristics of workers in Western and Eastern Germany by binding status,
BA data 1995-2008 . . . 130 4.3 Comparison of the roofing, the glazing, and the plumbing sector by various
economic indicators . . . 133
4.4 Average employment effects, inter- and intrasectional comparison, Eastern and Western Germany . . . 134 4.5 Robustness checks . . . 141 5.1 Various economic indicators for roofers and selected control sectors . . . 161 5.2 Indicators of the minimum wage bite measured in June prior to the next minimum
wage regulations (LAK and BA data) . . . 165 5.3 Worker characteristics for certain quantiles of the real daily wage distribution
(BA-data) . . . 166 5.4 Average changes in labour cost shares by firm size for firms with at least one MW
worker (LAK-data) . . . 169 5.5 Unconditional Quantile Treatment Effects of the minimum wage . . . 176 5.6 Placebo tests and robustness checks for estimations in Table 5.5 . . . 180
List of Figures
1 Unemployment rates for European NUTS-2 regions (2013) . . . 3
2 Population mean age for European NUTS-2 regions (2013) . . . 5
3 Minimum wage regulations in Germany as of August 2014 (in Euros) . . . 9
4 Minimum wage relative to median wages for OECD countries in 2012 . . . 11
1.1 Channels through which demographic ageing may trigger a trend towards more polarized regions . . . 21
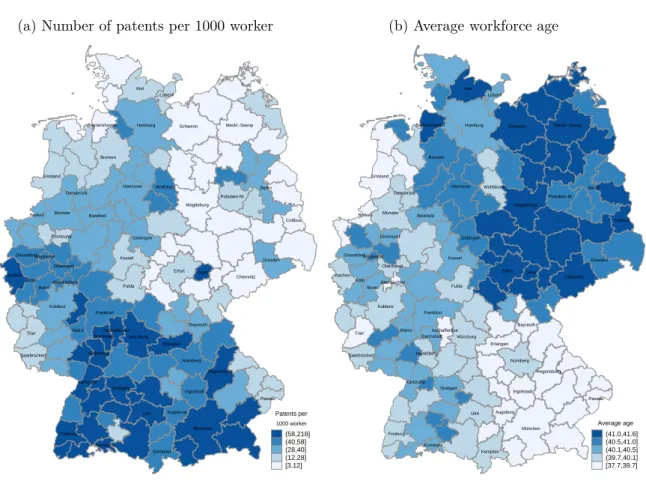
1.2 Regional quantile maps for innovation and average workforce age for the initial year 1995 and absolute changes between 1995-2008 . . . 25
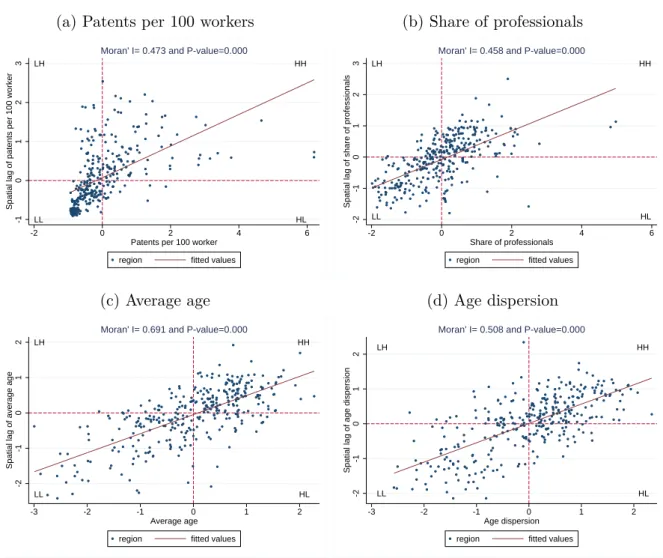
1.3 Moran’s I scatterplot for patents per 100 workers, average age, age dispersion and share of professionals in 1995 . . . 28
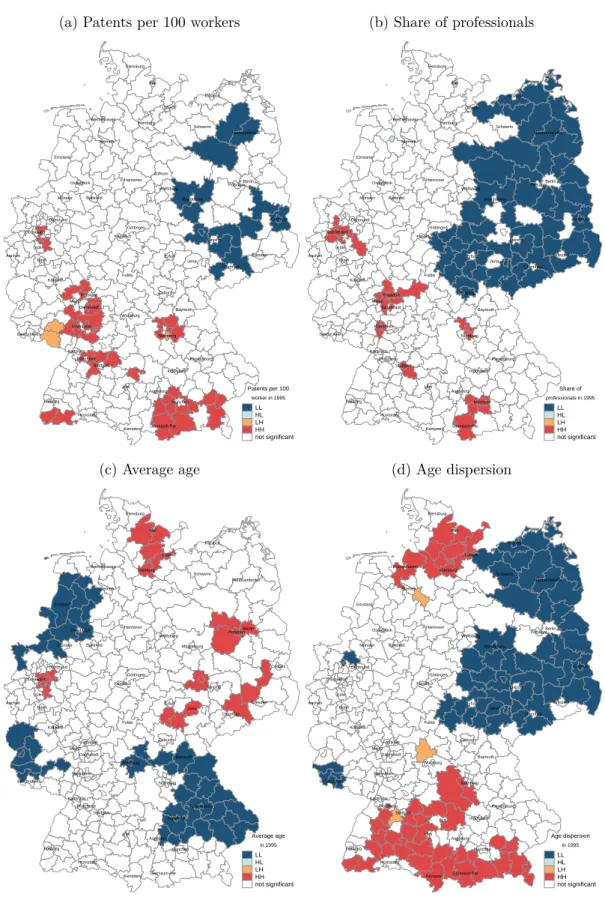
1.4 LISA cluster maps for patents per 100 workers, average age, age dispersion and share of professionals in 1995 . . . 30
1.5 Standardized Directional Moran Scatterplots for patents per 100 workers, average age, age dispersion and share of professionals (1995 to 2008) . . . 33
2.1 Workforce age and patent activity by labour market regions (1994-2008) . . . . 57
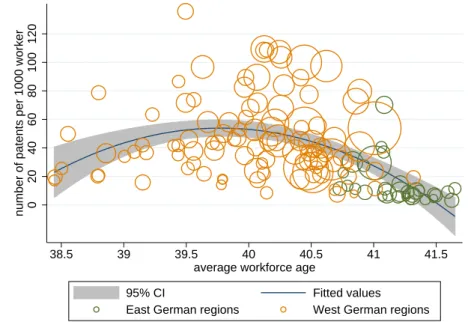
2.2 Scatterplot between average workforce age and patent production, average values for 1994-2008 . . . 58
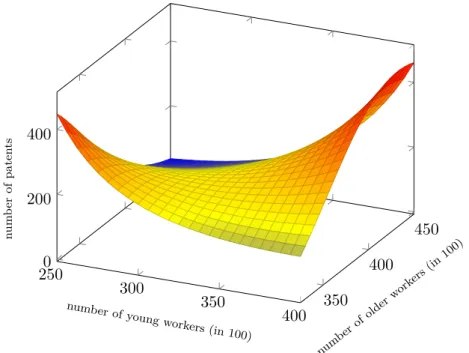
2.3 Predicted marginal effects on patent performance by the size of the younger, middle-aged and older workforce. . . 69
2.4 Simulated patent counts for varying inputs of young and older workers . . . 70
3.1 Parameters of the regional wage and employment distribution at the level of 27 aggregated planning regions . . . 97
3.2 (Labour) income differential ∆π(υ) =πwest(υ)−πeast(υ) for an average-skilled (υ= 0), high-skilled (υ= 1) and low-skilled (υ=−1) individual, 1995-2004 . . . 100 3.3 Net migration and net skill transfer in Eastern Germany, 1995-2004 . . . 101 3.4 Prediction of East-West migration selectivity based on the wage-based selection
model (3) versus the extended income-based selection model (3) in Table 3.3, 1995-2004 . . . 105 4.1 Overall revenues in Western and Eastern Germany by sector, 1994 - 2009 . . . . 122 4.2 Minimum wage level in the German roofing sector by region, 1995-2010 . . . 124 4.3 Kernel densities of hourly gross wages in Eastern and Western Germany, 1995
and 2008, LAK data . . . 129 4.4 Employment effects along the wage distribution, intersectoral comparison, by
wage decile and sub-period, Western (top) and Eastern Germany (bottom), BA data 1995-2007 . . . 139 5.1 Distribution of real hourly wages before and after the policy reform (LAK data) 153 5.2 Minimum wage level in the German roofing sector . . . 159 5.3 Development of revenues for roofers and selected control sectors . . . 160 5.4 Development of roofers real daily wages relative to plumbers (BA data) . . . 167 5.5 Development of upper tail wage dispersion in firms with at least one MW worker
(LAK data) . . . 170 5.6 Unconditional Quantile Treatment Effects of the minimum wage . . . 175 5.7 Unconditional vs. Conditional Quantile Treatment Effects of the MW . . . 177
Introduction
This cumulative dissertation comprises five research articles that pursue two distinct research agendas on the topic of labour market inequality. The first part deals with the role of geography for inequality and particularly stresses the role of demographic ageing and geographical migration in reinforcing regional disparities. The second part deals with wage-setting institutions, where the focus lies on the economic effects of minimum wages (MWs) on employment and earnings (inequality). The two topics are motivated in the following.
Part I: Demographic Change and Regional Labour Market Disparities
One of the most remarkable trends among advanced economies is the large and growing disparities between regional labour markets. For the US, Moretti (2012) documents a "great divergence" between communities that he describes as one of the most fundamental changes in the economy: While few regions with a well-educated labour force and a strong innovation sector are increasingly successful in creating new jobs and offering high wages, other regions with a less-educated workforce and depressed industries increasingly fall behind. As the main reason for this divide, the author sees long-run economic forces that are changing the economy in profound ways and which have a lot to do with the transition to a knowledge-based economy. More than traditional industries, the knowledge economy tends to be geographically concentrated, implying that initial regional conditions matter considerably for future development. Regions that are already successful tend to further attract young and educated workers, thus triggering a cumulative process towards more polarized regions. As a result, the salary of workers increasingly depends on where you live rather than on your personal characteristics. More generally, inequality in advanced economies to a large extent reflects a geographical divide.
Such divergence processes can also be observed for other advanced economies such as Germany.
While few cities in Eastern Germany such as Berlin, Jena and Dresden have been improving
economically and are increasingly able to attract young and highly qualified labour, other areas are suffering from low economic performance and out-migration of their young and talented workforce, leaving them depopulated. The latter indicates that Eastern Germany’s catching-up was to a large extent a geographically uneven process. In addition, a similar polarization trend can also be observed between West German regions, as the thesis shows. Moreover, increasing regional disparities may be relevant beyond the German case. In fact, Figure 1 maps the most recent unemployment rates for European NUTS-2 regions. For instance, the first quintile (light blue) depicts the 20% regions with the highest unemployment rate in 2013, whose values range from 2.5 to 5.6%. The fifth quintile (dark blue) contains the 20% regions with the lowest corresponding value. The map shows that whereas the unemployment rate is around 2.5% in some European countries, others reveal unemployment rates of up to 35.7%. These large disparities might seem surprising given several studies which show a convergence between European member states. However, despite this convergence, differences between regions within European states have actually been increasing (OECD, 2005). In fact, these geographic inequalities pose a key challenge for EU regional and territorial cohesion policy (European Parliament, 2007). Of course, the reasons for these disparities and divergence processes are complex and partly country-specific.
However, we will discuss some important determinants throughout this thesis for the case of German regions that should be relevant in a more European context as well.
Understanding the role of agglomeration forces and knowledge spillovers in exacerbating existing disparities is an important issue in this context. A lot has to do with the fact that most highly educated workers live in innovation hubs where they earn high salaries and have "good"
jobs, while low educated workers are left in regions with backward oriented industries. However, wages are thereby higher in some regions than others due to the sorting of high educated workers into these regions. Although this is interesting, it is less surprising. More important, high educated workers not only earn higher salaries, but also have a favourable impact on their surrounding regions. The reasons are local multipliers arising, for instance, through knowledge spillovers within and between firms in the local economy (for a recent overview, see Moretti 2011). Since such multipliers tend to be most relevant in creative industries, not all cities profit from such externalities though.
The observation of diverging regions may seem somewhat surprising given the influential work by O’brien (1992) Caimcross (1997) and Friedman (2005). According to their view, location
Introduction
Figure 1: Unemployment rates for European NUTS-2 regions (2013)
(12.1,35.7]
(8.3,12.1]
(5.6,8.3]
[2.5,5.6]
No data
Notes: Own illustrations based on data from Eurostat.
will become irrelevant in the globalized and highly connected world due to decreasing transport costs and advances in communication technologies. In their view, geography does not matter, which ultimately predicts a convergence across regions as a result of disappearing communication barriers. However, what we observe is exactly the opposite. Regional differences within countries are increasing, and location matters more than ever. In particular, forces are at play that are causing regions to be polarized. Therefore, understanding the determinants of regional disparities and potential reinforcement mechanisms is important for science, politics and society as a whole.
One aim of this dissertation is to consider the role of geographical migration for regional disparities. Migration is generally known to serve as an adjustment mechanism for territorial imbalances. Studies for the US show that wages in the US respond relatively flexible in response to adverse region-specific labour demand shocks (Blanchard and Katz, 1992). In particular, workers migrate from depressed regions to the better performing ones, thus equilibrating regional employment disparities. In contrast, interregional migration in Europe responds more slowly to a negative demand shock (Decressin and Fatás, 1995; Nahuis and Parikh, 2002), thus leading
to strong and persistent regional employment disparities (Abraham, 1996; Mertens, 2002) as reflected in Figure 1. More importantly, such disparities may even be self-reinforcing if prosperous regions tend to attract predominantly young and high-skilled workers (Kanbur and Rapoport, 2005; Fratesi and Riggi, 2007). This may in turn trigger a cumulative process towards more polarized regions. This thesis therefore provides new insights into the determinants of migration selectivity, especially in a European context with strong and persistent employment disparities.
A further reason for a strengthening of regional inequalities, that has widely been neglected, are long-term demographic forces that are operating in the background of many advanced economies. In fact, the map of the most recent population demographics for European NUTS-2 regions shown in Figure 2 reveals a large geographical divide with respect to the population mean age. For instance, the first quintile (light blue) depicts the 20% regions with the lowest mean age in 2013, whose values range from 35.9 to 40.2. The fifth quintile (dark blue) contains the 20% regions with the lowest corresponding value. The maps show that whereas some European regions comprise a mean workforce age of up to 47.6 years, others show corresponding mean ages of only 35.9 years. Moreover, Eurostat projections over the next 50 years based on these figures predict that workforce ageing will continue in all European countries. This demographic trend has raised the concern that an ageing workforce may reduce productivity, innovative capability and thus, ultimately, competitiveness in the global, knowledge-based economy. More strikingly, workforce ageing is very likely to affect labour markets in very different ways on a regional scale. The reasons are closely linked to the fundamental forces of agglomeration and regional migration. In the case of Germany, urban areas are those that are very successful in attracting young and skilled workers due to their cultural amenities and career perspectives (Buch et al., 2014). On the other hand, rural areas that are suffering from depopulation and, in particular, from out-migration of their youngest and most educated workforce. Since the age of workers is known to be a key determinant of innovative behaviour, this demographic divide may likely turn into an innovation and, hence, economic divide. Although most present in the case of Germany, similar trends can be observed for other European countries, indicated by Figure 2.
A further aim of this thesis is therefore to document recent demographic trends for the case of Germany and to provide insights on the empirical relevance of agglomeration and regional polarization tendencies in this context. By focusing on Germany, we will be able to explore regional dynamics on a very local level for a fast ageing country that has the second
Introduction
Figure 2: Population mean age for European NUTS-2 regions (2013)
(42.9,47.6]
(41.6,42.9]
(40.2,41.6]
[35.9,40.2]
No data
Notes: Own illustration based on data from Eurostat.
highest median age worldwide behind Japan1 and is characterised by a large demographic divide.
Moreover, this thesis aims to contribute to the debate on the age-creativity link by assessing the causal impact of an ageing workforce on regional performance and by investigating potential complementarities and substitutabilities between different age groups. The thesis will show that the link of workforce ageing on regional performance must not necessarily be negative at the aggregate level due to externalities arising from knowledge interactions between different age groups. The idea is that fluid abilities (speed of problem-solving and abstract reasoning) are known to decrease at older ages, whereas crystallized abilities (ability to use skills, knowledge and experience) remain at high functional levels until late in life. It will be tested whether young and older workers are complementary in the production of knowledge and how this complementarities may enhance innovation through knowledge exchange at the level of local labour markets. To the authors’ knowledge, such an investigation has not been conducted yet.
The first part of the thesis consists of 3 separate research articles (chapters) that were written
1Seehttp://esa.un.org/unpd/wpp/Documentation/pdf/WPP2012_HIGHLIGHTS.pdf.
with co-authors. The papers are all based on employment register data (Beschäftigten-Historik – BeH) from the German Federal Employment Agency, an administrative data set that contains information on the population working in jobs that are subject to social insurance payments.
For the different chapters, both the full BeH and 2% random samples are used. The BeH data is partly complemented with other regional data discussed in the data descriptions of the corresponding chapters. Chapter (1)lays the foundation for the subsequent chapters by exploring the spatial and temporal patterns of knowledge production and demographic measures within an Exploratory Space-Time Data Analysis (ESTDA). For the analysis, demographic measures including the average age and age dispersion as well as the share of creative professionals as one of the most important drivers of regional innovations are constructed. The workforce data are complemented by rich data from the European Patent Office (EPO) that include published patents in Germany. It is then explored to what extent innovations as well as creative and young workers tend to be geographically concentrated and how these concentrations have been evolving over time. Besides commonly used tools for cluster analyses, newer visualisation methods are applied that allow investigating the space-time dynamics of the spatial distributions and help to detect a potential reinforcement of clusters and spatial polarization tendencies. Moreover, the persistence of clusters as well as spatial contagion forces are investigated by means of transition probabilities. Overall, the results speak in favour of a demographic polarization trend across German regions. In particular, the detected post-reunification East-West divide is increasingly turning into a rural-urban divide. Whereas most urban regions are increasingly shaping a young and age-diverse workforce, almost all rural regions in both Eastern and Western Germany are affected by out-migration of their youngest cohorts. Since most East German regions constitute rural areas, they have been affected most by this trend, thus transitioning towards an age- homogenous economy with less mobile and older workers. However, the results also reveal a decent catching-up process of a few Eastern regions around the recently agglomerating capital city and a few other economic beacons that have increased their innovation output despite an ageing workforce. The findings indicate a first setting in of agglomeration forces after the transition from a communist to a market system. Due to the detected spatial contagion forces and cluster-wise path dependencies, regions are unlikely to reverse the trend though.
Motivated by the large demographic divide revealed in Chapter (1),Chapter (2)builds upon this descriptive preparatory work to examine the causal link between workforce age structure and
Introduction
patenting activity on the level of local labour markets. It also assesses potential complementarities and substitutabilities between different age groups within the local economy. The level of regional labour markets thereby constitutes the preferred unit of analysis for such an investigation, since the regional context appears to be most relevant for between-firm knowledge externalities and the generation of ideas (Peri, 2005). In order to address the potential endogeneity arising from e.g. selective migration, an Instrumental Variables (IV) approach is applied. In a first step, the age-creativity link is estimated in a quadratic specification, as is commonly done in the literature, using both cross-sectional and panel data. In a second step, a more flexible Translog production function is estimated using the number of young, middle-aged and older workers to gain insights into the complementarities and substitutabilities between these input factors. Overall, the results suggest a more complex pattern compared to the hump-shaped age-innovation profile typically found by existing studies. In particular, the findings indicate that younger workers boost regional innovations, but that this effect partly hinges on the presence of older workers in the same region. Moreover, cross-partial derivatives from Translog production functions suggest that abilities of younger workers and the experience of older workers are complementary in the production of knowledge. Despite this positive indirect effect of older workers on the production of knowledge, however, the findings point towards a reduced innovation level if demographic ageing shrinks the size of the younger workforce considerably in the future. Finally, Chapter (2) provides evidence that the difference in the age structure of the least and most innovative regions in Germany explains around a sixth of the gap in innovative performance, thus demonstrating the importance of demographic forces in shaping regional disparities.
One of the reinforcing mechanisms of regional disparities are skill-selective migration flows, as discussed above. Yet, the determinants of human-capital allocations across regions are still not fully understood. One of the few existing theoretical frameworks proposed by Borjas et al.
(1992) links selective migration to wage disparities only. In particular, high-skilled workers ceteris paribus should be attracted to regions that best reward their abilities by paying high wage returns to their skills as reflected in a high wage inequality. However, modelling the migration decision as a wage-maximising process only may not be sufficient in a European context with less flexible wages and where regional differences are more driven by persistent employment disparities. For this reason,Chapter (3)extends the Borjas framework to allow for a selection mechanism based on both wage and employment differentials and models the average skill level
of a migration flow as a positive function of both the wage and employment inequality in the destination as compared to the origin region. Unlike the Borjas framework, the model suggests that, besides mean wage, employment differentials also induce a positive skill sorting. The predictions for the average skill level of gross labour flows between German regions are then tested by regressing the average skill level of migration flows on the mean and dispersion of the regional wage and employment distribution. For the analysis, the panel dimension of the data is exploited in order to control for average time constant utility differentials between regions (e.g. amenity differentials). Moreover, to account for the endogeneity, a Difference Generalized Method of Moments (GMM) estimator proposed by Arellano and Bond (1991) is applied. The findings confirm the relevance of regional employment disparities for skill-selective migration, while regional wage differentials have no robust and significant impact. This chapter thus fills an important gap in understanding the self-reinforcing nature of interregional employment disparities. Although focusing on interregional migration, the main findings should apply to cross-country migration as well. Still, the results suggest that the recent emergence of intra- European migration flows from Southern Europe towards high employment countries such as Germany that has been found by Bertoli et al. (2013) is likely skill-biased, thus potentially aggravating the current North-South divide depicted in Figure 1.
Part II: Minimum Wage Effects Along the Wage Distribution
Whereas Part I deals with the influence of geography and demographic forces, Part II looks at the role of wage-setting institutions for labour market inequality. Investigating the influence of institutional factors has become increasingly relevant due to rising wage inequality (as measured by the 90-10 log wage differential) in many industrialized countries during the last four decades (Katz and David, 1999; Machin and Van Reenen, 2008). Although the wage structure in a few countries such as Germany stayed remarkably stable until the beginning of the 1990s it then also started to increase in these countries too. For instance, several studies show that wage dispersion increased both at the top and at the bottom of the wage distribution in Germany (for an overview see Fitzenberger, 2012). Compared to other international findings, the increase in German wage inequality is economically relevant and has led to decreasing real wages (Antonczyk et al., 2010). Particular attention has been given to the increase in lower tail wage inequality and the rise of the low-wage sector.
Introduction
Figure 3: Minimum wage regulations in Germany as of August 2014 (in Euros)
7.5 8.0
7.5 8.9
7.9 8.5
8.0 12.3
8.0 8.5 8.0 9.0
8.7 8.7
9.1 10.0
9.9 12.5
10.0 10.0
10.5 14.0
10.7 11.2 11.6 11.6
11.7 13.0 11.9 13.2
12.8 12.8
0 5 10 15
hairdressing trade security services temporary work building cleaning laundry services nursing care sector waste management electic trade painters scaffolding main construction sector stonemasons and carvers roofers vocational education and training mining specialists chimney sweeps
lowest MW highest MW
Number of workers
2.500 30.000 71.600 12.700 560.200 31.100 96.100 295.700 175.000 800.000 34.000 381.200
170.000 no data
no data
no data
Notes: Own illustration based on data from Destatis. The numbers of workers refer to all workers subject to social security contributions and are taken from the Confederation of German Trade Unions (DGB).
Rising wage inequality is one reason why most industrialized countries have implemented MWs targeted at increasing the wages of the working poor. The level and design of MW regulations, however, varies considerably between countries. In Germany, the first MW was introduced at a sectoral level for the construction sector in January 1997. Companies faced increasing competition from Eastern European firms who offered their services in Germany very cheaply due to lower wages that even undercut the collective wage agreements in Germany.
In order to protect these traditional crafts, trade unions and employers associations agreed as part of a general collective bargaining agreement on the implementation of a MW. However, since not all subsectors agreed on these regulations, only the main construction sector and a few months later other subsectors including the roofing, painting, varnishing and electric trade industry ended up implementing the first sector-specific MWs in Germany. For many years these industries were the only ones with a MW. Meanwhile, 16 industries have implemented a MW (see Figure 3 for an overview of existing MW regulations in Germany). The levels vary between Eastern and Western Germany as well as between worker groups (e.g. skilled vs. unskilled),
captured by the ’highest’ and ’lowest’ MW in Figure 3. Most recently, the newly elected grand coalition decided to implement a statutory MW of 8.50 Euros, beginning in 2015. An extensive discussion on the pros and cons of MWs predated this development in the public media.
There are only a few studies on MW effects in Germany. Most of these studies have recently come out of a comprehensive policy evaluation project in 2011 on behalf of the Federal Ministry of Labour and Social Affairs (BMAS) where six German research institutions evaluated eight out of twelfth sector-specific MWs in Germany. The aim of the evaluation was to assess the impact of the MW on employment, worker protection and competition in the sectors under study. Among others, the Centre for European Economic Research (ZEW) analysed the MW effects in the German roofing sector, which this part of the thesis builds upon (for a detailed report see Aretz, 2011). A summary of the results is published in Aretz et al. (2012b).
Two research articles in this part of the thesis originate from this policy evaluation project, but extend this work to highlight some new stylized facts on MW spillovers. Most MW research focuses on the average employment and average wage effects on workers with a binding MW for whom the wage falls below the MW level. However, depending on the production technology, the MW may also affect workers whose wage lies above the MW level. Such MW spillovers are mostly neglected in the empirical literature and many studies even use non-binding workers as a counterfactual for Difference-in-Differences analyses. The aim of the two research articles in Part II is to demonstrate how a MW may affect the employment probabilities and earnings of those workers located in the upper part of the wage distribution that are typically assumed to be unaffected by such policy interventions.
The German roofing sector turned out to be an interesting sector of study in this respect.
First, the MW level in the roofing sector is one of the highest for unskilled workers in Germany (compare Figure 3). In fact, only chimney sweeps, mining specialists and workers conducting vocational education and training services are subject to higher MWs (introduced only recently).
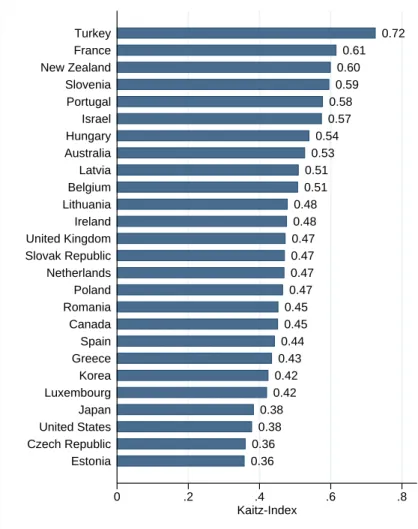
Moreover, since average wages are particularly low in the roofing sector, the MW bites particularly hard in this sector as reflected by a Kaitz-Index (the ratio of the MW level and the median wage) of around 1 in Eastern Germany. Compared to other OECD countries, the bite has to be considered exceptionally hard also by international standards. In fact, according to Figure 4, the Kaitz-Index varies between 0.4-0.7 for OECD countries. The German roofing sector thus represents an ideal setting to study MW spillovers since its bite is likely to aggravate wage and
Introduction
Figure 4: Minimum wage relative to median wages for OECD countries in 2012
0.36 0.36 0.38 0.38
0.42 0.42 0.43
0.44 0.45 0.45 0.47 0.47 0.47 0.47 0.48 0.48 0.51 0.51 0.53
0.54 0.57 0.58 0.59 0.60 0.61
0.72
0 .2 .4 .6 .8
Kaitz-Index Estonia
Czech Republic United States Japan Luxembourg Korea Greece Spain Canada Romania Poland Netherlands Slovak Republic United Kingdom Ireland Lithuania Belgium Latvia Australia Hungary Israel Portugal Slovenia New Zealand France Turkey
Notes: Data taken from OECD data base. Median wages are calculated for full-time workers.
employment effects along the entire wage distribution.
One research article presented in this part of the thesis is written with co-authors and another is single-authored. Both are based on two administrative linked employer-employee panels, one of which contains the full sample of workers in the roofing sector over the observation period of interest. Both investigations exploit a quasi-experiment since, for institutional reasons, the MW was introduced only in parts of the construction sector, including the roofing sector. Uncovered, yet comparable, sub-sectors may thus serve as a benchmark for the counterfactual development in the roofing sector in order to derive the treatment effects of the MW on subsequent outcomes.
In particular, Chapter (4) investigates the causal impact of the MW on the probability of remaining employed in the roofing sector. Since the entire construction sector experienced a dramatic decline in demand after the end of the unification boom in the mid 1990s that almost
halved the workforce in Eastern Germany, this is a highly relevant employment outcome. Results from an inter-sectoral and intra-sectoral comparison are contradicted, providing first insights into potential employment spillovers in the sector. The latter two identification strategies are then applied to a comparison of workers with and without a binding MW across sectors, which makes it possible to directly estimate the employment effects along the entire wage distribution.
Unobserved heterogeneity at the individual level is thereby taken into account, which may be relevant if employers mainly substitute workers along unobservable skills. The findings indicate that the average probability of remaining employed in the roofing sector has deteriorated due to the MW introduction, especially in Eastern Germany where the bite of the MW was particularly hard. Moreover, the results from the comparison of workers with and without a binding MW suggest negative employment outcomes for East German workers located higher up in the wage distribution. According to interviews with sector insiders, capital-labour substitution seems to be important in driving this finding. Overall, this chapter highlights the need for a broader perspective on the employment impact of MWs and also put doubts on any attempt to identify employment effects of MWs by comparing workers with and without a binding MW within a covered sector.
Chapter (5)complements Chapter (4) by focusing on the MW effects on the earnings (rather than on employment) along the distribution. The descriptive assessment of the hourly earnings distribution throughout the project already hinted at a strong wage compression not only at the lower but also at the upper part of the distribution, thus suggesting negative wage spillovers on high-wage earners. Motivated by this interesting observation, a similar quasi-experiment as in Chapter (4) is exploited using the wage distribution of uncovered sub-sectors as a counterfactual for the earnings of roofers in the absence of the policy reform. For the analysis, a recently developed unconditional quantile regression method suggested by Firpo et al. (2009) is applied that allows investigating the MW effects at each quantile of the distribution while keeping other factors constant. To yield further insights into a potential within-group (workers with similar characteristics) rather than overall wage compression effect, the results are contrasted to findings from conditional quantile regressions. Overall, the mean impact of the MW seems to miss a lot. In particular, the results suggest significant real wage increases of lower-decile workers that ripple up to the 0.6th quantile in Eastern Germany, whereas the weaker wage effects in Western Germany (5% at the lower tail) pillar up to about the median worker. However, the estimates
Introduction
also reveal some unexpected side effects of the reform. According to the estimates, the MW caused a reduction in real wages by up to 5% in Eastern Germany for the highest quantiles that mostly comprise skilled and experienced workers. The wage compression effect thereby not only reflects lower entry wages, but rather indicates wage restraints among upper quantile workers. This finding for Eastern Germany is consistent with evidence in favour of a rising cost burden. Particularly smaller firms with limited influence on market prices (price-takes) and fewer possibilities for substituting labour by capital have limited the scope for wage increases among their skilled employees. However, these wage restraints among highly paid workers only became possible due to increasing numbers of high-skilled workers queuing for jobs, which has strengthened the bargaining power of firms vis-a-vis skilled workers they still employ, a finding that indirectly results from the work presented in Chapter (4). As a consequence, wage differentiation and thus incentives for human capital investments have been shrinking in the sector and might also explain labour shortages that firms have been facing recently as reported by sector insiders.
Part I
Demographic Change and Regional
Labour Market Disparities
1 Demographic Ageing and the Polarization of Regions - An Exploratory Space-Time Analysis1
Joint with Roberto Patuelli2
Abstract: Demographic ageing is expected to affect labour markets in very different ways on a regional scale. Contributing to this debate, we explore the spatio-temporal patterns of recent distributional changes in the worker age structure and innovation output for German regions by conducting an Exploratory Space-Time Data Analysis (ESTDA). Besides commonly used tools, we apply newly developed approaches which allow investigating joint dynamics of the spatial distributions. Overall, we find that innovation hubs tend to be located in areas with high skill concentrations, but also seem to coincide with favourable demographic age structures. We show that these concentrations are persistent over time due to clusterwise path dependence and spatial contagion forces. The spatio-temporal patterns speak in favour of a demographic polarization process of German regions where the post-reunification East-West divide is increasingly turning into a rural-urban divide.
Keywords: innovation, demographic ageing, exploratory space-time analysis, re- gional disparities
JEL-Classification: J11, R12, R23
1Forthcoming inEnvironment and Planning A.
2University of Bologna and Rimini Centre for Economic Analysis (RCEA).
1.1 Introduction
Demographic ageing has increasingly become one of the most pressing challenges that industrial- ized economies are facing in the 21st century. According to the latest Eurostat projections for the next 50 years, workforce ageing will continue in all European countries, though its magnitude, speed and timing are likely to vary. Demographic trends have raised the concern that an ageing workforce may increase existing regional disparities in a global, knowledge-based economy, as innovation potential is likely to depend on the age structure of local workers. One reason is that innovation activity is strongly concentrated in agglomerated areas due to advantages derived from externalities due to the colocation of specific industries (localisation economies) and the accessibility of firms to a variety of skilled workers (urbanisation economies). Particularly young and educated workers are attracted to urban areas and thick labour markets due to cultural amenities and better career opportunities (Moretti, 2011; Buch et al., 2014). This may further increase existing disparities, as urban areas that are already good at attracting human capital and good jobs tend to attract even more. In contrast, rural areas suffering from depopulation further diminish their human capital base (brain drain).
Whereas such divergence process has been demonstrated for US labour markets (Moretti, 2012), such phenomena are less clear for the German and, more generally, European markets with limited worker and firm mobility relative to the US.3 Moreover, Germany is an interesting case of study due to its strongly ageing workforce and a large demographic divide. Spatial imbalances may have been reinforced by increasing labour-force participation of women who, seeking job opportunities, have increasingly been moving to prosperous urban areas. This trend has affected fertility patterns across regions and may further aggravate the rural-urban divide. Eastern regions have been suffering strongly from an ageing workforce due to age- and gender-selective out-migration. However, understanding the role of agglomeration forces in triggering a self-reinforcing process towards polarization might be interesting beyond the German case. For instance, Puga (2002) provides a discussion, based on location theories, of the possible (negative) causes of polarization within European countries, highlighting, for example, the role
3Südekum (2008) investigates the spatial variation of human capital across West German regions for a historical time period showing that concentration forces are much lower compared to the US. However, he focuses only on qualification degrees and it is unclear how these forces are developing lately, especially as Germany is moving towards an aging knowledge-based economy.
1.1. Introduction
of transport infrastructure.
The objective of this paper is to contribute to this debate and explore the spatial and temporal patterns of knowledge production and demographic measures by means of an Exploratory Space- Time Data Analysis (ESTDA) to yield insights into recent demographic trends and how they may change the regional innovation landscape. There are several studies that have already explored the spatial distributions of economic performance or income across European regions using local and global measures of spatial association (Le Gallo and Ertur, 2003; Ertur and Koch, 2006;
Dall‘erba, 2005; Patacchini and Rice, 2007). However, these studies use more general indicators of economic performance and consider space-time dynamics only partially. Exceptions are a study by Le Gallo (2004) and more recent studies by Hierro et al. (2013) and Fazio and Lavecchia (2013), which deal with the persistence of regional disparities by exploiting spatial transition probabilities. We build on this literature and extend these approaches by newer visualisation methods for a comprehensive ESTDA of our innovation and demographic measures.
In particular, our contribution is fourfold. Firstly, we describe the spatial distribution of regional age structure, human capital and innovation performance in the interesting case of a fastly ageing Germany and discuss the possible theoretical links between these variables. We thereby do not focus only on the average age of workers, but also consider age diversity in order to capture a wider picture of the workforce age distribution. Secondly, we use a rich data set from the European Patent Office (EPO) that includes all published patents in Germany. By focusing on patents as one direct measure of the innovation process at the regional level, we are better able to capture innovativeness than more general indicators of economic performance such as productivity and economic growth. Furthermore, by including the share of creative professionals in our analyses we additionally explore one of the most important drivers of regional innovation (Florida, 2002; Florida and Gates, 2003). Thirdly, instead of only using static (spatial) methods such as Local Indicators of Spatial Association (LISA), we apply new visualization tools such as directional Moran scatterplots, developed by Rey et al. (2011), which allow investigating the space-time dynamics of spatial distributions, and help to detect a potential reinforcement of clustering and polarization. In addition, we calculate LISA transition probabilities as suggested by Rey (2001) to study the persistence of regional disparities. To our knowledge, this paper is the first to combine all the above methods and provide a comprehensive ESTDA on the themes of labour force ageing and innovation output. Finally, the paper contributes to the discussion on
East-West convergence (divergence) after reunification which, after almost 25 years, still has important consequences for the theory and the design of policies in the demographic context.
Overall, our study shows that location matters in an aging knowledge-based economy as suggested by the detected spatial concentrations. In particular, we find that innovation hubs tend to be located in areas with high skill concentrations, but also seem to coincide with favourable demographic age structures. The study further demonstrates the persistence of these concentrations over time as indicated by clusterwise path dependence and spatial contagion forces in shaping the distributions. Moreover, the spatio-temporal patterns speak in favour of a demographic polarization process of German regions. According to our results, the post- reunification East-West divide is increasingly turning into a rural-urban divide. Whereas most urban regions are increasingly shaping a young and age-diverse workforce, most rural regions in both East and West Germany are affected by out-migration of their youngest cohorts.
The paper is structured as follows. First, we discuss the potential theoretical mechanisms of demographic polarization trends before introducing the database in Section 1.3. In Section 1.4 we then conduct an ESDA by first testing for spatial randomness (global Moran’ I) and describing patterns of spatial clusters and outliers (local Moran’ I). In Section 1.5 we then move to the space-time dynamics by investigating changes in the spatial clusters over time (directional Moran Scatterplots) and path-dependencies (LISA Transition matrices). Finally, Section 1.6 concludes.
1.2 The Polarization of Regions
There are several channels through which demographic ageing may affect the competitiveness of regions and thus, ultimately, increase regional disparities. As Figure 1.1 illustrates, the natural rate of population ageing does not only change the average age, but also shapes the age composition of the regional workforce through regionally differentiated fertility rates, changes in average life expectancy as well as differences in labour force participation rates. This may have several consequences for the production of knowledge in a region. On the one hand, an increasing average age may have a diminishing effect on the creativity of workers (age effect), which is known to decline with age (Simonton, 1988; Bratsberg et al., 2003; Jones, 2010). On the other hand, regions with increasing cohorts of older workers may even profit from an ageing workforce
1.2. The Polarization of Regions
Figure 1.1: Channels through which demographic ageing may trigger a trend towards more polarized regions
Demographic ageing
Average workforce age
in regioni
Age composition of the workforce
in regioni Skill composition
in regioni
Innovation in regioni
NPA NPA
Natural rate of population ageing (NPA)
Human capital effect
diversity effect
age effect AF AF
Attraction forces (AF)
Neighbouring regionj spatial spillovers
(diversity effect) if they develop a favourable age composition. The reason is that older workers are endowed with specific experience and (tacit) knowledge that may be complementary to the one of younger workers, as shown by a recent study at the regional level by Arntz and Gregory (2014). Moreover, there might be an indirect effect of demographic ageing on regional innovation through changes in the human capital base (human capital effect) arising, for instance, from older and formally more skilled worker cohorts (especially in the East) retiring and younger workers entering the labour market. The fact that the human capital base is an important driver of knowledge production and regional growth has been stated in various research (Lucas, 1988; Florida, 2002; Florida and Gates, 2003). The overall impact of these channels on regional knowledge production is, however, far from clear. The few existing studies at the country or regional level suggest a negative impact on GDP growth (Lindh and Malmberg, 1999; Brunow and Hirte, 2006) and total factor productivity (Feyrer, 2008). In contrast, Arntz and Gregory (2014), who use patent counts and citations, show that the overall impact of workforce ageing must not necessarily be negative, once the endogeneity of regional workforces is controlled for.
Given the overall effect, agglomeration forces then set in and reinforce existing disparities by pushing firms and skilled labour towards the innovation hubs, while leading to depopulation and
brain drain in rural areas. The reasons for such spatial agglomerations are higher productivity and wages (Glaeser et al., 1992; Rauch, 1993; Ciccone and Hall, 1996) arising from local externalities (localization and urbanization economies). Skilled, young and more mobile workers in particular are attracted to urban areas, which offer several advantages such as cultural amenities and better career perspectives (Moretti, 2011; Buch et al., 2014). Note that such in-migrants may originate from both other regions within the country and from abroad.4 Spatial clustering in knowledge production and human capital then occurs through localized knowledge spillovers (Jaffe, 1989; Audretsch and Feldman, 2004) and population relocation to surrounding urban counties (suburbanization). Overall, the above mechanisms may trigger a cumulative process towards increased polarization. This hypothesis is supported by several studies in the migration literature that show how selective migration, induced by interregional differences in wage and employment opportunities (Arntz et al., 2014) may lead to increasing spatial inequalities (Kanbur and Rapoport, 2005; Fratesi and Riggi, 2007) rather than serving as a re-equilibrating mechanism. In the next sections we explore the spatial distributions of innovation and demographic measures in the case of Germany in order to provide insights on the empirical relevance of such agglomeration and regional polarization tendencies.
1.3 Innovation and Demographic Measures
The present study focuses on workforce rather than population data, since we assume the regional age structure to affect regional innovation mainly through the working rather than overall population. For the calculation of the workforce age structure, we exploit the regional file of the Sample of Integrated Labour Market Biographies (SIAB) from the Institute of Employment Research (IAB) for the years 1995-2008. The data set is an employment subsample provided by the German Federal Employment Agency and contains information on workers that are subject to social insurance contributions by their employers, thus excluding civil servants and self-employed individuals. The data includes individual employment histories on a daily basis and contains, among others, information on the age and occupations of workers. We use annual cross sections at the cut-off date of 30 June and calculate regional indicators of demographic
4A study by Poot (2008) discusses several reasons why immigration may affect regional competitiveness in the context of demographic ageing.
1.3. Innovation and Demographic Measures
composition including average age, age dispersion (standard deviation) and the share of creative professionals5 (which we will refer to as our human capital base or skills). We restrict the analysis to full-time employed individuals subject to the social insurance contribution, that is, excluding minors and unemployed workers.6 Furthermore, we restrict our data set to working individuals between 18 and 65 years of age to avoid selection problems that would be associated, for instance, to the fact that those few underage workers are undergoing a vocational training.
As a regional definition, we use the 332 labour market regions defined in the regional file of SIAB data. These regions reflect aggregated counties to the extent that they comprise at least 100,000 inhabitants. We focus on this detailed regional level instead of using more aggregated labour market regions in order to distinguish between different degrees of urbanization.
As a measure of regional innovativeness, we use patent data which are provided by the European Patent Office (EPO). The use of such direct outcome measures is still rare in the literature dealing with the effects of ageing workers on competitiveness, especially in regional level studies7, but should be able to better capture innovativeness than more general indicators of economic performance. Our data set contains patent data both at the applicant and inventor level. Whereas the applicant (quite often, the firm) is the holder of the patent right, the inventors are the actual inventors cited in the document. We focus on patent inventors, since we are interested in their spatial distribution rather than in the location of the formal holder, which is often one of the firm’s headquarters. Since patents may have been developed by serval inventors located in different regions, we apply a fractional counting approach to assign to every region the respective share of the patent. For instance, an inventor who developed a patent in Mannheim with one further individual working abroad would generate 0.5 patents for this region. Following this procedure for each of the 332 regions, we calculate the number of patent applications for the years 1995-2008. Since the number of inventions of a region may simply reflect its size rather than the knowledge production efficiency, we furthermore condition the number of patents (multiplied by 100) by the number of employed workers of the region, obtaining a measure of
patent production per 100 workers.
There are several advantages and disadvantages of using patenting data at the regional level (Giese and von Reinhard Stoutz, 1998; Giese, 2002). On the one hand, patent applications
5For the classification of creative professionals, we follow Möller and Tubadji (2009).
6We hypothesize here that part-time workers are equally employed across regions.
7See, for instance, Brunow and Hirte (2006), Feyrer (2008) and Lindh and Malmberg (1999).
are a useful indicator of research and invention activities at the local level, as they include information on the origin of inventor activities, that is, the place of residence and therefore, indirectly, the approximate location of the research institute. On the other hand, not every invention becomes the subject of a patent application, nor does a patent necessarily become a marketable product or process. Moreover, the reasons for a patent application may not only rest on protecting an invention against unjustified use, but may reflect strategic concerns such as securing and extending regional markets, prestige advertisement and the demonstration of innovative capacity to economic counterparts (e.g., shareholders or funding partners). Despite these disadvantages, empirical evidence by Acs et al. (2002), who provide an exploratory and a regression-based comparison of the innovation count data and data on patent counts at the lowest possible levels of geographical aggregation, suggests that patents provide a fairly reliable measure of innovative activity. Similarly, a survey study by Griliches (1998) concludes that patents are a good indicator of differences in inventive activity.
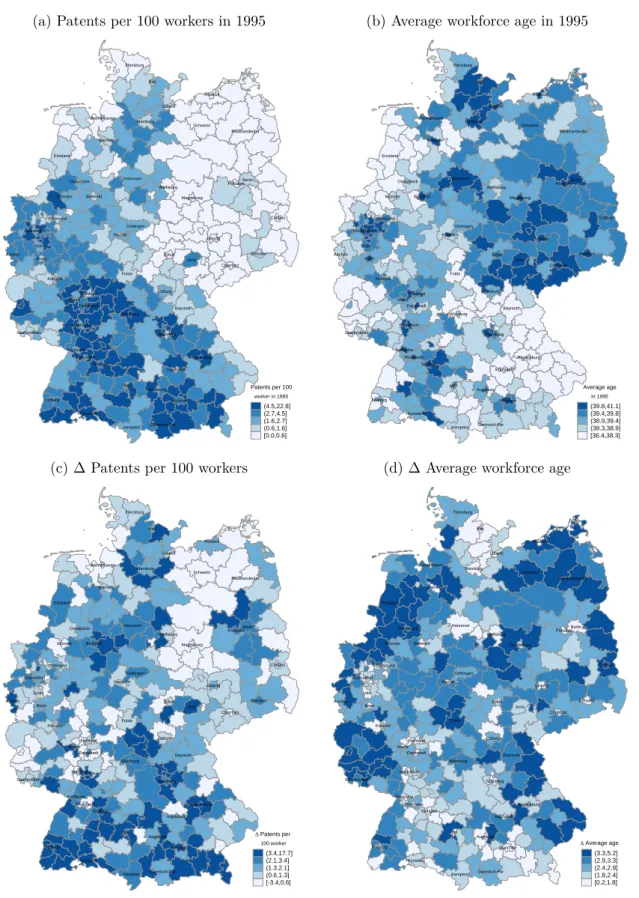
Figure 1.2 maps patents per 100 worker and average workforce age for our 332 regions for the initial year as well as the absolute change between 1995 and 2008. Similar maps for workforce age dispersion and the share of professionals are shown in Appendix 1.A.1. For instance, the first quintile in Figure 1.2a (light blue) depicts the first 20% of least innovative regions in 1995, whose values range from 0.2 to 1.4 patents per 100 workers. The fifth quintile (dark blue) contains the 20% most innovative regions. The maps show that innovations are mostly generated in urban counties around West German cities such as Duesseldorf, Frankfurt, Stuttgart, Freiburg, Nueremberg and Munich. These regions also employ most creative professionals. In contrast, only a few East German major cities such as Jena were halfway competitive in the production of knowledge a few years after reunification. The spatial distribution of average age further reveals that only a few West German regions exhibit relatively old workforce, including major cities and urban counties around Kiel, Hamburg, Bremen, Hannover, Duesseldorf, Frankfurt, Stuttgart, Nueremberg and Munich. The fact that most rural regions in West Germany comprise relatively young and age-diverse workforces reflects historically large shares of conservative farming families with traditional role models that led to relatively high fertility rates, particularly in Bavarian and North-Western counties (around Emsland). In contrast, East German regions depict relatively old and homogenous workforces indicating that plant closures and out-migration of young workers after reunification strongly affected their age structure. The latter has already
1.3. Innovation and Demographic Measures
Figure 1.2: Regional quantile maps for innovation and average workforce age for the initial year 1995 and absolute changes between 1995-2008
(a) Patents per 100 workers in 1995
Kiel
Lübeck Flensburg
Hamburg
Göttingen Wolfsburg Hannover Osnabrück
Emsland Bremen Bremerhaven
Düsseldorf
Bonn Köln Aachen
Münster Bielefeld
Dortmund
Darmstadt Frankfurt
Kassel
Fulda Koblenz
Mainz
Stuttgart Karlsruhe
Mannheim
Pforzheim
Freiburg Konstanz
Ulm
Ingolstadt
München
Garmisch-Par Regensburg Bayreuth Coburg
Nürnberg Würzburg
Augsburg
Kempten Saarbrücken
Berlin
Cottbus Potsdam Rostock
Neubrandenbu Schwerin
Chemnitz Dresden Leipzig Magdeburg
Erfurt Jena
(4.5,22.8]
(2.7,4.5]
(1.6,2.7]
(0.6,1.6]
[0.0,0.6]
worker in 1995 Patents per 100
(b) Average workforce age in 1995
Kiel
Lübeck Flensburg
Hamburg
Göttingen Wolfsburg Hannover Osnabrück
Emsland Bremen Bremerhaven
Düsseldorf
Bonn Köln Aachen
Münster Bielefeld
Dortmund
Darmstadt Frankfurt
Kassel
Fulda Koblenz
Mainz
Stuttgart Karlsruhe
Mannheim
Pforzheim
Freiburg Konstanz
Ulm
Ingolstadt
München
Garmisch-Par Regensburg Bayreuth Coburg
Nürnberg Würzburg
Augsburg
Kempten Saarbrücken
Berlin
Cottbus Potsdam Rostock
Neubrandenbu Schwerin
Chemnitz Dresden Leipzig Magdeburg
Erfurt Jena
(39.8,41.1]
(39.4,39.8]
(38.9,39.4]
(38.3,38.9]
[36.4,38.3]
in 1995 Average age
(c) ∆ Patents per 100 workers
Kiel
Lübeck Flensburg
Hamburg
Göttingen Wolfsburg Hannover Osnabrück
Emsland Bremen Bremerhaven
Düsseldorf
Bonn Köln Aachen
Münster Bielefeld
Dortmund
Darmstadt Frankfurt
Kassel
Fulda Koblenz
Mainz
Stuttgart Karlsruhe
Mannheim
Pforzheim
Freiburg
Konstanz Ulm
Ingolstadt
München
Garmisch-Par Regensburg Bayreuth Coburg
Nürnberg Würzburg
Augsburg
Kempten Saarbrücken
Berlin
Cottbus Potsdam Rostock
Neubrandenbu Schwerin
Chemnitz Dresden Leipzig Magdeburg
Erfurt Jena
(3.4,17.7]
(2.1,3.4]
(1.3,2.1]
(0.6,1.3]
[-3.4,0.6]
100 worker D Patents per
(d) ∆ Average workforce age
Kiel
Lübeck Flensburg
Hamburg
Göttingen Wolfsburg Hannover Osnabrück
Emsland Bremen Bremerhaven
Düsseldorf
Bonn Köln Aachen
Münster Bielefeld
Dortmund
Darmstadt Frankfurt
Kassel
Fulda Koblenz
Mainz
Stuttgart Karlsruhe
Mannheim
Pforzheim
Freiburg
Konstanz Ulm
Ingolstadt
München
Garmisch-Par Regensburg Bayreuth Coburg
Nürnberg Würzburg
Augsburg
Kempten Saarbrücken
Berlin
Cottbus Potsdam Rostock
Neubrandenbu Schwerin
Chemnitz Dresden Leipzig Magdeburg
Erfurt Jena
(3.3,5.2]
(2.9,3.3]
(2.4,2.9]
(1.8,2.4]
[0.2,1.8]
D Average age