Rifting under steam – how rift magmatism triggers
1
methane venting from sedimentary basins
2
C. Berndt1, C. Hensen1, C. Mortera-Gutierrez2, S. Sarkar1, S. Geilert1, M.
3
Schmidt1, V. Liebetrau1, R. Kipfer3,7, F. Scholz1, M. Doll4, S. Muff1, J. Karstens1, 4
S. Planke5, S. Petersen1, C. Böttner1, W.-C. Chi6, M. Moser1, R. Behrendt1, A.
5
Fiskal1, M.A. Lever7, C.-C. Su8, L. Deng7, M.S. Brennwald3, and D. Lizarralde9 6
1GEOMAR Helmholtz Centre for Ocean Research Kiel, Wischhofstr. 1-3, 24148 Kiel, 7
Germany 8
2Instituto de Geofísica, UNAM, Circuito Exterior, Cd. Universitaria, Coyoacán, D.
9
F., C. P. 04510, Mexico 10
3Department Water Resources and Drinking Water, Eawag, Überlandstrasse 133, 11
8600 Dübendorf and Noble Gas Laboratory, Institute of Geochemistry and Petrology, 12
ETH, 8092 Zürich, Switzerland.
13
4Fachbereich Geowissenschaften, Universität Bremen, Leobener Str., 28359 Bremen, 14
Germany 15
5Volcanic Basin Petroleum Research AS, Gaustadalleen 21, 0349 Oslo, Norway 16
6Institute of Earth Sciences, Academia Sinica, 128 Academia Rd, Sec.2, Nangang, 17
Taipei, Taiwan 18
7Department of Environmental Systems Sciences, ETH, Universitätstrasse 16 19
8092 Zürich, Switzerland 20
8Institute of Oceanography, National Taiwan University, No.1, Sec. 4, Roosevelt 21
Road, Taipei 106 ,Taiwan 22
9Woods Hole Oceanographic Institution, Woods Hole, MA 02543-1050 U.S.A.
23 24
25 26
ABSTRACT 27
During opening of a new ocean magma intrudes into the surrounding 28
sedimentary basins. Heat provided by the intrusions matures the host rock creating 29
metamorphic aureoles potentially releasing large amounts of hydrocarbons. These 30
hydrocarbons may migrate to the seafloor in hydrothermal vent complexes in 31
sufficient volumes to trigger global warming, e.g. during the Paleocene Eocene 32
Thermal Maximum (PETM). Mound structures at the top of buried hydrothermal vent 33
complexes observed in seismic data off Norway were previously interpreted as mud 34
volcanoes and the amount of released hydrocarbon was estimated based on this 35
interpretation. Here, we present new geophysical and geochemical data from the Gulf 36
of California suggesting that such mound structures could in fact be edifices 37
constructed by the growth of black-smoker type chimneys rather than mud volcanoes.
38
We have evidence for two buried and one active hydrothermal vent system outside the 39
rift axis. The vent releases several hundred degrees Celsius hot fluids containing 40
abundant methane, mid-ocean-ridge-basalt (MORB)-type helium, and precipitating 41
solids up to 300 m high into the water column. Our observations challenge the idea 42
that methane is emitted slowly from rift-related vents. The association of large 43
amounts of methane with hydrothermal fluids that enter the water column at high 44
pressure and temperature provides an efficient mechanism to transport hydrocarbons 45
into the water column and atmosphere, lending support to the hypothesis that rapid 46
climate change such as during the PETM can be triggered by magmatic intrusions into 47
organic-rich sedimentary basins.
48 49
50 51
INTRODUCTION 52
When testing climate models by hind casts for past prominent warming events it has 53
become clear that significant drivers are missing (Panchuk et al., 2008; Carozza et 54
al., 2011). Most striking, the reason for a 5-6°C global warming during the PETM 55
remains elusive, although it is clear that more than 2000 Gt of carbon must have 56
entered the atmosphere within a relatively short time span of a few thousand years 57
(Dickens et al., 1995; Zachos et al., 2001). Light carbon isotope ratios were 58
interpreted to suggest that large amounts of biogenic carbon were released through 59
run-away hydrate dissociation events (Kennett et al., 2000). But recent studies call 60
this interpretation in question (Dickens, 2011; Biastoch et al., 2011). Most 61
alternative explanations are also marred by contradictions with available data 62
(Higgins and Schrag, 2006). This includes the hypothesis of carbon mobilization by 63
magmatic intrusions into carbon-rich continental margin sediments during the 64
opening of the North Atlantic (Svensen et al., 2004), because it is difficult to 65
understand how this process could have injected large amounts of carbon into the 66
atmosphere within a short time.
67 68
THE ACTIVE HYDROTHERMAL MOUND IN THE GUAYMAS BASIN 69
New data acquired in the Guaymas Basin (Fig. 1, S1) support the ‘tectonic-magmatic’
70
explanation for warming during the PETM. Our data show a 1050 m-wide and 100 m- 71
high mound located above thick sediments approximately 1 km southeast of the 72
northern rift axis of the Guaymas Basin that is emitting carbon-rich hydrothermal 73
fluids (Fig. 2a). The mound and most of the southern flank of the Guaymas rift valley 74
are underlain by an approximately 100 m-thick chaotic seismic facies (50 to 150 ms 75
two-way-travel time (TWT)) that is part of a widespread mass transport deposit. In the 76
area of the mound another chaotic and low seismic amplitude seismic facies continues 77
further downward to at least 2900 ms TWT or approximately 200-250 metres below 78
seafloor. We interpret this facies as a conduit for the ascending hydrothermal fluids.
79
At this depth high seismic amplitude reflections extend southward from below the rift 80
axis into the basin. These reflections are likely caused by magmatic intrusions which 81
occur throughout the Guaymas Basin (Lizarralde et al., 2010). The bathymetric data 82
(Fig. 1) also show the trace of a NE-SW striking normal fault that stretches to the 83
mound and is dipping westward (Fig. S2). As it strikes in the same direction as the 84
elongate mound axis it is probable that the shape of the mound is controlled by this 85
fault. An approximately 20 m-thick chaotic seismic facies immediately below the base 86
of the mound may indicate that hydrothermal seepage was initially occurring over a 87
broader area and became more focused once fluid pathways had formed. The up to 88
30°-steep flanks of the mound suggest a high internal angle of repose of the mound- 89
forming material.
90 91
A 2.2 km-long profile of ten heat flow stations across the vent field and a 0.4 km-long 92
profile of five stations along the mound consistently show heat flow values larger than 93
0.3 W/m². The maximum heat flow on top of the mound is heterogeneous with values 94
exceeding 10 W/m², whereas values below 3W/m2 were measured only 100 m away 95
from the center (Supplementary Table S1). This heat flow pattern is similar to the heat 96
flow distribution at sediment-free mid ocean ridges (Rona et al., 1996). The strong 97
lateral heat flow variations indicate focused heat transport by hydrothermal fluids 98
within narrow fluid pathways.
99
100
Samples recovered from the top of the mound show porous Fe-rich sulfides (Fig. S3) 101
consisting predominantly of a boxwork of pyrrhotite crystals with minor pyrite, and 102
marcasite, and rare Zn- and Cu-sulfides (e.g. sphalerite, chalcopyrite, isocubanite).
103
These are accompanied by a small fraction of non-sulfide minerals (e.g., carbonates, 104
opal-A and secondary Fe-oxyhydroxides). The mineralogy makes the samples from 105
the northern rift axis similar to the massive sulfides recovered from the southern 106
Guaymas Basin (Koski et al., 1985; Peter and Scott, 1988). However, they lack the 107
abundant petroleum found in the southern rift samples. In analogy to black smoker 108
deposits from Escanaba Trough the observed mineral assemblage suggests formation 109
temperatures in the range of 270-330°C (Zierenberg et al., 1993).
110 111
TIMING OF HYDROTHERMAL ACTIVITY 112
A 5m-long gravity core was taken ~500 m away from the hydrothermal vent field 113
(Fig. 3). The upper 4 m of the core consist of organic-rich, hemipelagic diatomaceous 114
clay that is typical for most of Guaymas Basin (Damm et al., 1984). By contrast, the 115
lowermost 1 m of core consists of coarse-grained hydrothermal deposits intercalated 116
with clay lenses suggesting the mound to consist of hydrothermal deposits. Given Pb- 117
210-based sedimentation rates of 0.74 m/kyr inside the hydrothermal vent field 118
(Station 40) and of 0.79 m/kyr just outside the hydrothermal vent field along the 119
Northern Guaymas rift axis (Station 66), the hydrothermal deposits are likely 5 to 6 120
kyr old. This is a minimum age estimate as older hydrothermal material likely exists 121
below and towards the centre of the vent complex. However, we note that sill 122
intrusions quickly cool off after emplacement (Jamtveit et al., 2004) and even thick 123
intrusions can only sustain hydrothermal systems for a few kyr. Thus, we infer that 124
the mound structure must have formed during the last 5-10 kyr.
125
ORIGIN OF THE HYDROTHERMAL FLUIDS 126
We collected sea water in the vicinity of the hydrothermal field (Fig. 3) with Niskin 127
bottles and measured the dissolved gases with an adapted membrane-inlet mass- 128
spectrometer (MIMS (Mächler et al., 2012)). The water is strongly enriched in helium 129
(He) relative to the atmospheric equilibrium conditions (Fig. S5). At the flanks and 130
the bottom of the rift valley He concentrations are similar to the concentrations found 131
in the southern part of the Guaymas Basin(Lupton, 1979) whereas He in the water just 132
above the active smokers is supersaturated by more than a factor of 4 (Fig. S6). This 133
enrichment indicates that the vent injects He directly into the water column. The 134
injected He is strongly enriched in 3He. The 3He/4He ratio (10.8.10-6, Fig. S6, Tab. S3) 135
agrees with that of excess He from the southern part of the Guaymas Basin (Lupton, 136
1979) pointing to the same general MORB source, and confirms that water circulation 137
in the Guaymas Basin distributes He-rich water from the black smoker region 138
throughout the basin (Marinone, 2003).
139 140
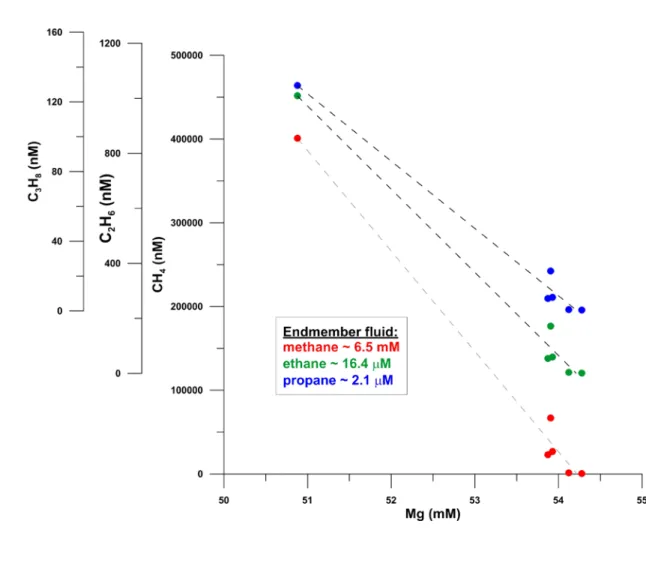
Dissolved concentration of light hydrocarbons determined in water sampled at the 141
smoker field (Fig. 3) by Niskin bottles are highly enriched (factor ≥ 105) compared to 142
bottom water concentrations (Tab. S2). Calculated end member concentrations (i.e.
143
CH4= 6.5 mM; Fig. S7) are similar to that of vent fluids measured in the Southern 144
Guaymas Basin. There, CH4 generation was related to thermocatalytic degradation of 145
organic matter in sediments intruded by magmatic rocks (CH4 ~6.3 mM, C1/C2+
146
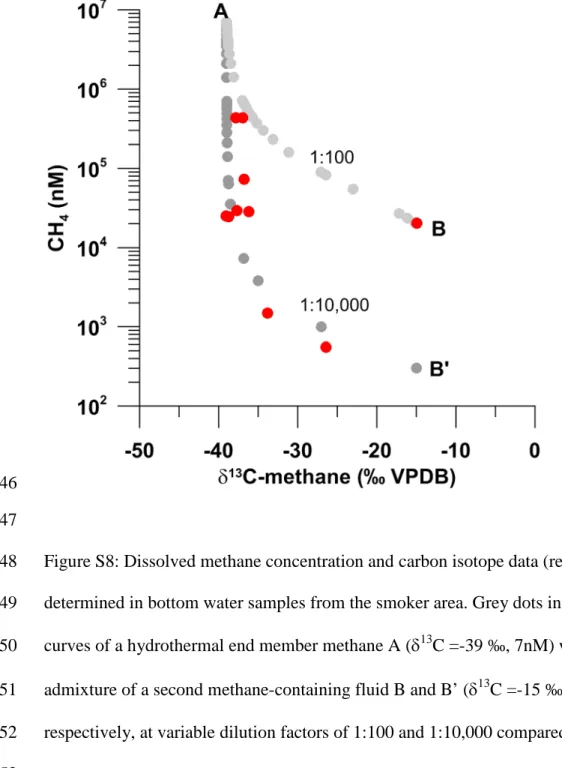
~80)(Welhan and Lupton, 1987). The isotopic composition of methane (δ13C : -39 to - 147
14.9 ‰) at our site also indicates thermogenic methane most likely derived from local 148
sediments, however, with admixture of isotopically heavy methane (Fig. S8). This is 149
consistent with high enrichment in Rn (Tab. S2). The heaviest δ13C-CH4 is likely 150
related to an abiogenic methane source derived from water rock interaction (e.g., East 151
Pacific Rise-type methane (Welhan and Lupton, 1987)). The presence of abiogenic 152
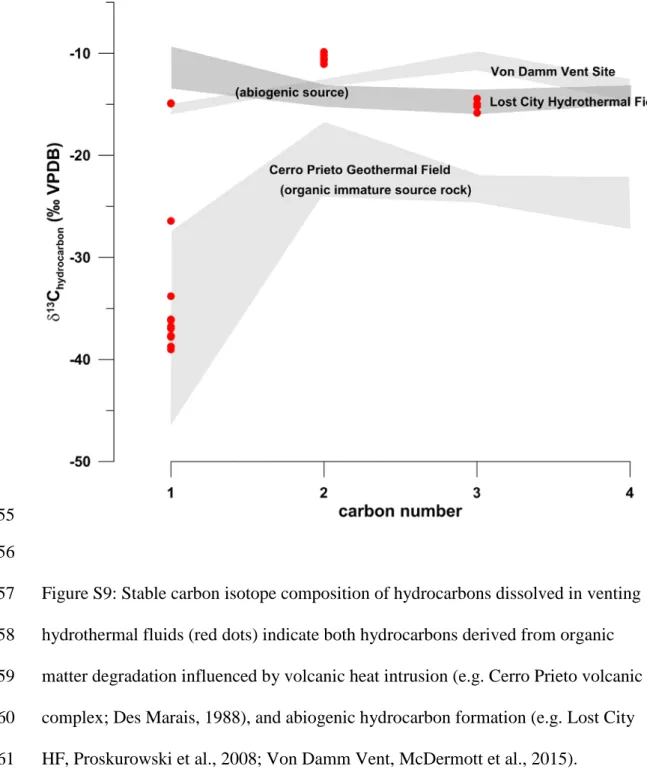
hydrocarbon is also supported by the isotopic heavy composition of ethane and 153
propane (McDermott et al., 2015; Proskurowski et al., 2008) (Fig. S9). Although the 154
high-temperature aureole at the sill-sediment contact zone appears to be the plausible 155
source for production of hydrocarbons by hydrothermal alteration of organic matter 156
and abiogenic hydrocarbon release by hydrothermal alteration of magmatic rocks 157
(McDermott et al., 2015), our concentration and isotope data do not exclude 13C- 158
enrichment of methane by (high-temperature) secondary oxidation within the 159
sediments (Pan et al., 2006; Biddle et al., 2012). In fact, the strongest methane input 160
from the smoker vent field exhibits an isotopically light δ13C-trend as it is postulated 161
for the PETM event (Dickens, 2011), and any subsequent methane oxidation product 162
would maintain this signal. We note that isotopically-light carbon of biogenic origin 163
accounts for most of the CH4 that is emitted from the black smoker field, despite the 164
presence of an isotopically-heavy hydrocarbon source of abiogenic, magmatic origin.
165
Thus, we conclude that magmatic activity acts mainly as the heat source that fosters 166
and triggers CH4 production and release from the post-rift sediments. While abiogenic 167
methane along with MORB-source fluids is indeed emitted, it amounts only to a 168
minor share of the total liberated CH4 (mixing ratio: 1 : 102 - 104, Fig. S8).
169 170
COMPARISON TO MOUND STRUCTURES ON THE NORTH ATLANTIC 171
MARGIN 172
The Guaymas mound resembles positive relief structures on the Paleocene-Eocene 173
seafloor of the Vøring Basin off mid-Norway that have been interpreted as mud 174
volcanoes previously (Svensen et al., 2004; Aarnes et al., 2015). Although deeply 175
buried, the Norwegian mound structures have similar sizes and internal seismic 176
appearance as the newly discovered active vent structure in the northern Guaymas 177
Basin. The Norwegian mound structures are characterized by a transparent to 178
stratified seismic facies confined by a mostly continuous, low-amplitude seismic 179
reflection (Fig. 2b). The bases of these dome structures also have rugged topography 180
with decreased seismic amplitudes and they overlie zones of disturbed seismic 181
reflections with seismic amplitudes different from their host rocks. These seismic 182
anomalies may indicate sediment alteration during vent activity (Fig. 2b). In addition 183
to similar dimensions, the Norwegian and Guaymas structures both have very steep 184
slopes (Fig. 2c) indicating comparable rheological properties which is uncommon 185
even for the steepest mud volcanoes so far described for marine environments 186
(Pinheiro et al., 2003). Seismic data are never fully conclusive – however, the striking 187
morphological similarity and the location of the structures above seismically imaged 188
fluid pathways indicates that the Guaymas vent may be a suitable analogue for the 189
structures that formed at the beginning of the PETM. This link points to an important 190
role of sediment alteration by ascending hydrothermal fluids and mineral precipitation 191
in the formation of the mounds.
192 193
IMPLICATIONS 194
Hydrothermal systems injecting hot, CH4- and CO2-rich fluids high up into the water 195
column are a much more efficient mechanism for releasing large amounts of carbon 196
into the atmosphere than mud volcano-style cold seeps. Such focused ‘hot’ input 197
efficiently bypasses microbial benthic filters that may oxidize much of the CH4 to the 198
less potent greenhouse gas CO2. Even more important is the observation that 199
hydrothermal systems can inject CH4 and CO2 vigorously several hundred meters 200
high up into the water column. In a shallow marine rift environment such as the North 201
Atlantic volcanic rifted margins during the PETM (Planke et al., 2000), such gas 202
plumes may directly reach the atmosphere. Thus, the new observations support the 203
hypothesis that the PETM was caused by the vigorous and wide spread magmatic 204
systems of the North Atlantic large igneous province (Svensen et al., 2004) rather 205
than by large-scale hydrate dissociation.
206 207
ACKNOWLEDGMENTS 208
This work is being funded by the German Ministry of Science and Education (BMBF) 209
through the MAKS project. We thank the master and the crew of research vessel 210
Sonne for their invaluable support during cruise SO241.
211 212
REFERENCES CITED 213
Biastoch, A., Treude, T., Rüpke, L.H., Riebesell, U., Roth, C., Burwicz, E.B., Park, 214
W., Latif, M., Böning, C.W., Madec, G., and Wallmann, K., 2011, Rising Arctic 215
Ocean temperatures cause gas hydrate destabilization and ocean acidification:
216
Geophysical Research Letters, v. 38, p. n/a–n/a, doi: 10.1029/2011GL047222.
217
Biddle, J.F., Cardman, Z., Mendlovitz, H., Albert, D.B., Lloyd, K.G., Boetius, A., and 218
Teske, A., 2012, Anaerobic oxidation of methane at different temperature regimes 219
in Guaymas Basin hydrothermal sediments: The ISME Journal, v. 6, p. 1018–
220
1031, doi: 10.1038/ismej.2011.164.
221
Carozza, D.A., Mysak, L.A., and Schmidt, G.A., 2011, Methane and environmental 222
change during the Paleocene-Eocene thermal maximum (PETM): Modeling the 223
PETM onset as a two-stage event: Geophysical Research Letters, v. 38, p. n/a–
224
n/a, doi: 10.1029/2010GL046038.
225
Damm, Von, K.L., Edmond, J.M., Measures, C.I., and Grant, B., 1984, Chemistry of 226
submarine hydrothermal solutions at Guaymas Basin, Gulf of California:
227
Geochimica et Cosmochimica Acta, v. 49, p. 2221–2237, doi: 10.1016/0016- 228
7037(85)90223-6.
229
Dickens, G.R., 2011, Down the Rabbit Hole: toward appropriate discussion of 230
methane release from gas hydrate systems during the Paleocene-Eocene thermal 231
maximum and other past hyperthermal events: Climate of the Past, v. 7, p. 831–
232
846, doi: 10.5194/cp-7-831-2011.
233
Dickens, G.R., O'Neil, J.R., Rea, D.K., and Owen, R.M., 1995, Dissociation of 234
oceanic methane hydrate as a cause of the carbon isotope excursion at the end of 235
the Paleocene: Paleoceanography, v. 10, p. 965–971.
236
Higgins, J.A., and Schrag, D.P., 2006, Beyond methane: Towards a theory for the 237
Paleocene-Eocene Thermal Maximum: Earth and Planetary Science Letters, v.
238
245, p. 523–537, doi: 10.1016/j.epsl.2006.03.009.
239
Welhan, J.A. and Lupton, J.E., 1987, Light Hydrocarbon Gases in Guaymas Basin 240
Hydrothermal Fluids: Thermogenic Versus Abiogenic Origin: AAPG Bulletin, v.
241
71, p. 215–223, doi: 10.1306/94886d76-1704-11d7-8645000102c1865d.
242
Jamtveit, B., Svensen, H., Podladchikov, Y.Y., and Planke, S., 2004, Hydrothermal 243
vent complexes associated with sill intrusions in sedimentary basins, in 244
Geological Society of London, 9 p. p. 233–241.
245
Kennett, J.P., Cannariato, K.G., Hendy, I.L., and Behl, R.J., 2000, Carbon Isotopic 246
Evidence for Methane Hydrate Instability During Quaternary Interstadials:
247
Science, v. 288, p. 128–133, doi: 10.1126/science.288.5463.128.
248
Koski, R.A., Lonsdale, P.F., Shanks, W.C., Berndt, M.E., and Howe, S.S., 1985, 249
Mineralogy and geochemistry of a sediment‐hosted hydrothermal sulfide deposit 250
from the Southern Trough of Guaymas Basin, Gulf of California: Journal of 251
Geophysical Research: Solid Earth, v. 90, p. 6695–6707, doi:
252
10.1029/JB090iB08p06695.
253
Lizarralde, D., Soule, S.A., Seewald, J.S., and Proskurowski, G., 2010, Carbon release 254
by off-axis magmatism in a young sedimented spreading centre: Nature 255
Geoscience, v. 4, p. 50–54, doi: 10.1038/NGEO1006.
256
Lupton, J.E., 1979, Helium‐3 in the Guaymas Basin: Evidence for injection of mantle 257
volatiles in the Gulf of California: Journal of Geophysical Research: Solid Earth, 258
v. 84, p. 7446–7452, doi: 10.1029/JB084iB13p07446.
259
Marinone, S.G., 2003, A three-dimensional model of the mean and seasonal 260
circulation of the Gulf of California: Journal of Geophysical Research, v. 108, p.
261
3325–27, doi: 10.1029/2002JC001720.
262
Mächler, L., Brennwald, M.S., and Kipfer, R., 2012, Membrane Inlet Mass 263
Spectrometer for the Quasi-Continuous On-Site Analysis of Dissolved Gases in 264
Groundwater: Environmental Science & Technology, v. 46, p. 8288–8296, doi:
265
10.1021/es3004409.
266
McDermott, J.M., Seewald, J.S., German, C.R., and Sylva, S.P., 2015, Pathways for 267
abiotic organic synthesis at submarine hydrothermal fields: Proceedings of the 268
National Academy of Sciences, v. 112, p. 7668–7672, doi:
269
10.1073/pnas.1506295112.
270
Pan, C., Yu, L., Liu, J., and Fu, J., 2006, Chemical and carbon isotopic fractionations 271
of gaseous hydrocarbons during abiogenic oxidation: Earth and Planetary Science 272
Letters, v. 246, p. 70–89, doi: 10.1016/j.epsl.2006.04.013.
273
Panchuk, K., Ridgwell, A., and Kump, L.R., 2008, Sedimentary response to 274
Paleocene-Eocene Thermal Maximum carbon release: A model-data comparison:
275
Geology, v. 36, p. 315–5, doi: 10.1130/G24474A.1.
276
Peter, J.M., and Scott, S.D., 1988, Mineralogy, composition, and fluid-inclusion 277
microthermometry of seafloor hydrothermal deposits in the southern trough of 278
Guaymas Basin, Gulf of California: Canadian Mineralogist.
279
Pinheiro, L.M., Ivanov, M.K., Saoutkine, A., Akhmanov, G., Magalhães, V.H., 280
Volkonskaia, A., Monteiro, J.H., Somoza, L., Gardner, J.M., Hamouni, N., and 281
Cunha, M.R., 2003, Mud volcanism in the Gulf of Cadiz: results from the TTR-10 282
cruise: Marine Geology, v. 195, p. 131–151, doi: 10.1016/S0025-3227(02)00685- 283
0.
284
Planke, S., Symonds, P.A., Alvestad, E., and Skogseid, J., 2000, Seismic 285
volcanostratigraphy of large-volume basaltic extrusive complexes on rifted 286
margins: Journal of Geophysical Research, v. 105, p. 19–335–19–351.
287
Proskurowski, G., Lilley, M.D., Seewald, J.S., Früh-Green, G.L., Olson, E.J., Lupton, 288
J.E., Sylva, S.P., and KeLLey, D.S., 2008, Abiogenic Hydrocarbon Production at 289
Lost City Hydrothermal Field: Science, v. 319, p. 604–607, doi:
290
10.1126/science.1151194.
291
Rona, P.A., Petersen, S., Becker, K., Herzen, Von, R.P., Hannington, M.D., Herzig, 292
P.M., Naka, J., Lalou, C., and Thompson, G., 1996, Heat flow and mineralogy of 293
TAG Relict High-Temperature Hydrothermal Zones: Mid-Atlantic Ridge 26°N, 294
45°W: Geophysical Research Letters, v. 23, p. 3507–3510, doi:
295
10.1029/96gl03257.
296
Svensen, H., Planke, S., Malthe-Sørenssen, A., Jamtveit, B., Myklebust, R., Eidem, 297
T.R., and Rey, S.S., 2004, Release of methane from a volcanic basin as a 298
mechanism for initial Eocene global warming.: Nature, v. 429, p. 542–545, doi:
299
10.1038/nature02566.
300
Zachos, J., Pagani, M., Sloan, L., Thomas, E., and Billups, K., 2001, Trends, 301
Rhythms, and Aberrations in Global Climate 65 Ma to Present: Science, v. 292, p.
302
686–693, doi: 10.1126/science.1059412.
303
Zierenberg, R.A., Koski, R.A., Morton, J.L., and Bouse, R.M., 1993, Genesis of 304
massive sulfide deposits on a sediment-covered spreading center, Escanaba 305
Trough, southern Gorda Ridge: Economic Geology, v. 88, p. 2069–2098, doi:
306
10.2113/gsecongeo.88.8.2069.
307 308
309 310 311 312
FIGURE CAPTIONS 313
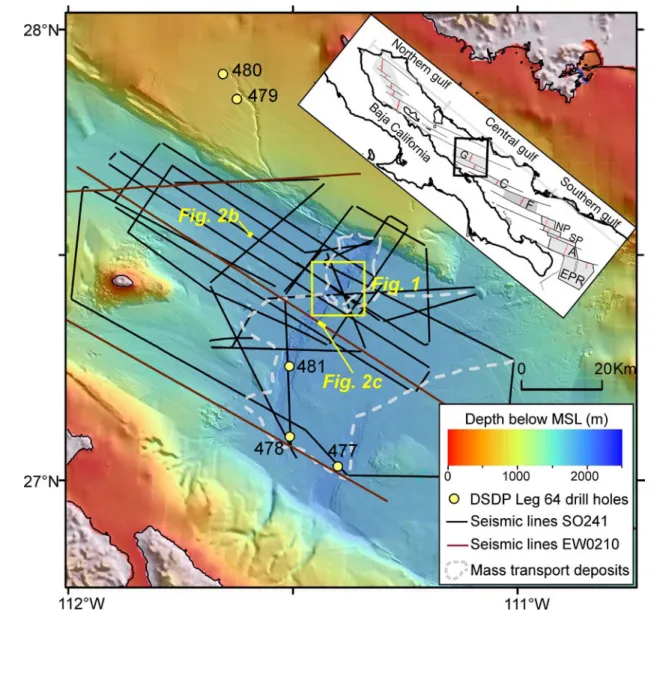
Figure 1. The Guaymas Basin is one of the rift basins formed by opening of the Gulf 314
of California in NW-SE direction. The recently discovered black smoker is located 315
just south of the northern rift axis.
316 317
Figure 2. Comparison of the seismic signature of the active black smoker (a) and an 318
extinct structure in the Guaymas (b and c) and extinct structures observed in the 319
Vøring Basin during the opening of the Northeast Atlantic off Norway (d and e).
320
Width (f) and height (g) of the active black smoker in the Guaymas Basin are similar 321
to structures in the Vøring Basin as indicated by the red line in the blue histograms.
322
Green lines, average width and height. MTD, mass transport deposit. CSF, chaotic 323
seismic facies underneath the smoker. Vertical axis on all seismic images shows two 324
way travel time in ms.
325 326
Figure 3. Three-dimensional view of the mound structure discovered in the Guaymas 327
Basin. Station IDs of CTD tracks (green lines), HyBis dives (red lines), gravity core 328
(yellow triangle), and in situ sensor data (pCH4 (µatm) / pCO2 (µatm) / temperature 329
(°C)) are labelled.
330 331
Figure 4. Schematic diagram illustrating the processes at the active vent site. The 332
green area indicates under-mature sediments from which organic carbon can be 333
mobilized by the heat transfer from the magmatic intrusions limiting the depth within 334
which the bulk of the fluids may originate. MTD: Mass transport deposit.
335 336
1GSA Data Repository item 201Xxxx, including supplementary figures and references 337
as well as additional information on heat flow measurements, geochemical analysis of 338
sediment pore water and water column samples, determination of the sedimentation 339
rate and further seismic information, is available online at 340
www.geosociety.org/pubs/ft20XX.htm, or on request from editing@geosociety.org or 341
Documents Secretary, GSA, P.O. Box 9140, Boulder, CO 80301, USA.
342 343 344
GSA Data Repository Materials 345
346
Seafloor temperature measurements 347
The temperature gradients were measured using a 5 m-long temperature-gradient 348
lance with six miniaturized temperature data loggers (MTL). These loggers measured 349
the temperature at a sampling rate of 1 s with an absolute accuracy of approximately 350
0.1 K (Pfender and Villinger 2002). The relative temperature resolution is 0.001 K. In 351
addition, at six sites a 5 m-long gravity corer with attached MTLs was used. An 352
additional logger at the top of both instruments measured the bottom water 353
temperature as a reference. All measurements were tilt corrected. The derived 354
temperature data were not corrected for sedimentation and terrain effects.
355 356
We have measured the thermal conductivity on recovered core material that was 357
sampled at or close to the depth of the measured temperature positions using the KD2 358
Pro Needle Probe Instrument. For the samples without a thermal-conductivity 359
measurement, i.e. those without cores, we assumed a constant thermal conductivity of 360
0.7 W/m K. The data were processed using the method published by Hartmann and 361
Villinger (2002). This method determines undisturbed sediment temperatures from the 362
observed temperature decays.
363
Heat flow values were calculated by using Fourier’s Law as the product of the 364
temperature gradient and thermal conductivity.
365 366
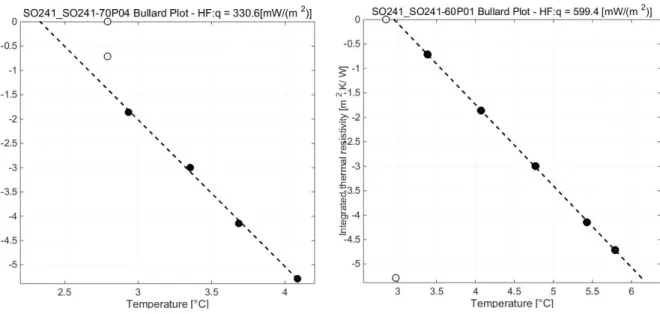
We used Bullard method in which the integrated thermal resistance is plotted as a 367
function of temperature. Usually this relationship is linear. However, transient 368
processes such as high sedimentation rates, seasonal temperature fluctuations, focused 369
advection processes or heat generation may cause non-linear deviations. Fourteen out 370
of the 15 presented heat flow sites show a linear relationship between temperatures as 371
function of integrated thermal resistance. Just one site shows non-linear relation at 372
shallow sediment depth.
373 374
We interpret the overall high heat flow values with large lateral variations as a result 375
of hydrothermal fluid movements along narrow pathways. The high temperature 376
gradient (Supplementary Table S1) excludes conductive heat transfer. Conductive 377
heat transfer cannot explain either the large lateral heat flow variations on a spatial 378
scale of 100 m. This indicates that there is rigorous hydrothermal venting. All of the 379
SO241-70 sites show advective components. Three out of these four are interpretable 380
as discharge areas (in the northern and central part of the graben), but the Bullard plot 381
of (Site SO241-70P04) shows a downward concave curve at shallow depth, which 382
may be the result of seawater recharge into the crust before it is being heated up.
383 384
Geochemistry 385
Water samples were taken by using a towed SBE9-CTD rosette device equipped with 386
11 Niskin bottles (a 10 l) and additional HydroC-pCH4 and -pCO2, turbidity, and 387
bottom distance sensors (modified after Schmidt et al., 2015). CTD-Stations VCTD09 388
(and -10) were towed directly above the hydrothermal vent field in variable distance 389
to seafloor (Fig. 3). However, only VCTD09 data is shown in Table S2 as it exhibit 390
notable inorganic variations of hydrothermal tracers in water masses in 5-20 m 391
distance to seafloor. Niskin bottles were closed when temperature, pCO2 and turbidity 392
suddenly increased indicating hydrothermal plume anomalies. The Niskin bottles 393
were sub-sampled directly after CTD retrieval for inorganic element chemistry, 394
nutrients, partial pressures of dissolved gases and stable and radio-isotope 395
characteristics (Tab. S2) and water samples were analysed onboard for nutrient 396
concentrations. Sub-samples taken for the analysis of major cations (Na+, K+, Li+, 397
Mg2+, Ca2+, Sr2+, Ba2+) as well as B and Si were measured in the shore-based 398
laboratory at GEOMAR Helmholtz-Centre for Ocean Research by ICP-OES 399
(http://www.geomar.de/en/research/fb2/fb2-mg/benthic-biogeochemistry/mg- 400
analytik/icp-aes/). ICP sub-samples were acidified directly after sampling to prevent 401
any precipitation of minerals. The elements Ba, Mn, Si, and Li are enriched compared 402
to seawater values. The concentration ranges between 128 – 1766 nM for Ba, 0.02 to 403
23.9 µM for Mn, 0.16 – 0.69 mM for Si and 23.1 – 59.2 µM for Li (Table S2). All 404
elements show the strongest anomalies (mostly enrichment) in bottle 12 (VCTD09).
405
Mg shows a slight concentration decrease compared to seawater. The strongest 406
depletion of Mg (51 mM) was also encountered in bottle 12. TIMS measured 87Sr/86Sr 407
ratios normalized on SRM-987 (0.710248) ranges between 0.708906 and almost 408
modern seawater (0.709176) matching 0.709170 (± 1 E-5, typical 2 SEM this session) 409
showing the lowest value in bottle 12 which was sampled closest to the active vent.
410 411
We calculated the amount of hydrothermal fluids in the Guaymas Basin bottom water 412
using a simple two-end member mixing model between the seawater and primary 413
hydrothermal fluid which was assumed to be void of Mg. Based on this we calculated 414
the maximum percentage of the hydrothermal fluid in the water samples. The lowest 415
Mg concentration of 51 mM in the water sample of bottle 12 yields a hydrothermal 416
fluid percentage of ~6 %. Based on this we determined the hydrothermal end member 417
composition of the enriched elements in the sampled water column and compared 418
those to the concentrations measured at the southern Guaymas spreading center by 419
Von Damm et al. (1985).
420 421
Hydrothermal end member concentrations for Si and Ba yielded 9.36 mM and 28 µM, 422
respectively and fall well into the end member concentration ranges observed by Von 423
Damm et al. (1985) in the southern Guaymas Basin (Si: 9 - 14 mM; Ba: 7 – 42 µM).
424
Si concentration is at the lower end of the concentration range and might point to a 425
lower hydrothermal temperature or Si precipitation during ascent or after fluid 426
discharge. Hydrothermal end member concentrations calculated for Mn yield 420 µM, 427
which is higher than the concentrations observed in the southern Guaymas 428
hydrothermal fluids, which range between 128 and 236 µM (Von Damm et al., 1985).
429
Von Damm et al. (1985) propose the precipitation of alabandite (MnS) as an 430
explanation for the observed low values. Li, in contrast, shows slightly lower 431
calculated end member concentrations (584 µM) compared to the southern Guaymas 432
fluids, which range between 630 and 1076 µM. These lower values might be 433
explained by a Li sink in the sediments through which the hydrothermal fluids 434
percolate.
435 436
Concentrations of dissolved He and Ne (as well as Ar, Kr and Xe) and the 3He/4He, 437
22Ne/20Ne, 36Ar/40Ar isotope ratios in water samples taken in copper tubes were 438
analysed as routine samples in the noble gas laboratory of the Swiss Federal Institute 439
of Technology Zurich (ETHZ) and the Swiss Federal Institute of Aquatic Science and 440
Technology (Eawag). Details on sampling and of the experimental method are given 441
in Beyerle et al. (2000). He and Ne concentrations are covered with an overall 442
standard error of ±2%, the 3He/4He ratio has a standard error of 1%.
443 444
For the on-board analysis concentrations of dissolved He, Ar, Kr, N2, O2, CO2, and 445
CH4 during the expedition, we used a portable gas-equilibrium membrane-inlet mass- 446
spectrometric system (GE-MIMS) similar to that described in Mächler et al. (2012).
447
Whereas the original GE-MIMS was designed for gas analysis in continuous high- 448
volume water flows through a large membrane contactor, the GE-MIMS used here 449
was modified to allow analysis of an 8 l water sample taken from a 10 l Niskin 450
sampler within 10 min (Brennwald et. al., 2015, a, b). To allow reliable gas analysis 451
in this limited amount of water, the gas consumption from the membrane contactor 452
into of the MS was reduced to 0.1 ccSTP/min (> 2 ccSTP/min in the original GE- 453
MIMS). This allowed maintaining gas/water solubility equilibrium in miniature 454
membrane contactor modules (two LiquiCel MicroModules operated in parallel) at a 455
total water throughput of 0.5 L/min (> 5 L/min in the original GE-MIMS). The low 456
gas consumption was achieved by replacing the capillary flow resistance followed by 457
a split-flow/aperture gas inlet to the MS vacuum by a new splitless design using a 458
single capillary (9 m long, 0.1 mm inner diameter, Brennwald et al., 2015b). The gas 459
outflow from the capillary is analysed in a quadrupole MS (Stanford Research 460
Systems RGA 200) operated in dynamic mode. As the membrane contactors operate 461
at solubility equilibrium, the partial pressures of the noble gases N2 and O2 in the gas 462
phase of the membrane contactors are similar to those in air. The GE-MIMS data for 463
these species were therefore calibrated using ambient air as a reference gas (< 5 % 464
accuracy, 1 σ). The partial pressures of CO2 and CH4 are reported as un-calibrated 465
raw data.
466 467
In order to determine the variation of excess amounts of the noble gas radon 468
(222Rn(exc.)) close to the hydrothermal vent, selected CTD samples were measured on 469
board by Liquid Scintillation Counting (LSC). Using a portable Hidex TriathlerTM 470
system and MaxiLightTM as scintillation cocktail for the measurement of total 222Rn 471
content uncertainties of 15% (SD) are typical for the counting statistics. After more 472
than 3 months storage re-measurements were conducted at GEOMAR to correct for 473
the fraction of total 222Rn potentially provided by the decay of dissolved 226Ra. The 474
analytical procedure followed the approach described by Purkl and Eisenhauer 475
(2004). The maximum sample size was restricted to 1.5 l combined with 20 ml of 476
LSC cocktail, which is close to the maximum extraction efficiency as recently 477
deduced by Schubert et al. (2014). The re-measurements for supported 222Rn 478
contribution did not reveal concentrations above the detection limit of the applied 479
LSC setup. Consequently, a simple, robust, and reliable semi-quantitative measure on 480
the relative enrichment in 222Rn(exc.) can be presented in Tab. S2 in terms of 481
enrichment factors compared to bottle 5. Since bottle 5 shows the lowest 222Rn 482
activity in dpm/L (decay per minute/liter) of the investigated CTD casts it provides 483
the best available approximation to water column background 222Rn activity and was 484
set as reference point (Tab. S2). The lowest published 222Rn data (0.1 and 0.2 dpm/L) 485
of Santos et al. (2011) for central waters of the Concepcion Bay (West of our study 486
area) and of Prol-Ledesma et al. (2013) for the northern Gulf of California (Wagner 487
and Consag basins, down to zero dpm/100L) may be assumed as typical background 488
values and are similar to the lowest values that we have encountered (bottle 5, 1768 489
m: 0.17 dpm/L (± 0.1, SD; calibration pending). However, applying the same 490
approach to the sample recovered closest to the vent (bottle 12, 1773 m) yielded the 491
maximum 222Rn(exc.) activity of 13.8 dpm/L for our data set. Independent from exact 492
quantitative setup calibrations, this approach provides a robust enrichment factor for 493
222Rn(exc.) in the same order of magnitude as deduced for He in this study (Tab. S2).
494
However, almost twice as high levels of 222Rn(exc.) of 2430 dpm/100L were reported 495
for the hydrothermal impact on the waters of the northern Gulf of California in the 496
Wagner and Consag basins (Prol-Ledema et al., 2013). There they attribute the 497
positive anomalies of 222Rn to a fault system coinciding with the presence of strong 498
flares suggesting hydrothermal circulation in a thick sediment cover and revealing the 499
location of up-flow areas.
500 501
Dissolved hydrocarbons (C1-C3) from individual water samples were released 502
onboard by equilibration of 112 ml water samples in a septum-sealed 117 ml 503
headspace vial at room temperature (He-head space, 50 µl HgCl2-solution added).
504
Hydrocarbon composition of the head space gas was determined by using a Thermo 505
Trace gas chromatograph (GC) equipped with flame ionization detector (carrier gas:
506
He 5.0; capillary column: RT Alumina Bond-KCl, column length: 50 m; column 507
diameter: 0.53 µm). Precision of ±1-3% was achieved when measuring standard 508
hydrocarbon mixtures. Molar hydrocarbon concentrations in Table S2 were calculated 509
by applying Henry coefficients according to Mackay and Shiu (2006).
510 511
Stable carbon isotope ratios of methane and higher hydrocarbons (C1-C3) from water 512
samples were measured by using continuous flow GC combustion - Isotope Ratio 513
Mass Spectrometry. Hydrocarbons were separated in a Thermo Trace GC (carrier gas:
514
He; packed column: ShinCarbon, 1.5 m). The subsequent conversion of hydrocarbons 515
to carbon dioxide was conducted in a Ni/Pt combustion furnace at 1150°C. The 516
13C/12C-ratios of the produced CO2 were determined by a Thermo MAT253 isotope 517
ratio mass spectrometer. All isotope ratios are reported in the δ-notation with respect 518
to Vienna Pee Dee Belemnite (VPDB, analytical precision 0.5 ‰).
519 520
Sedimentation Rates 521
The wet sediment was weighed, freeze dried at -80°C and reweighed to determine the 522
water content, then ground in a mortar. Radionuclides were then measured as follows.
523
Two HPGe detectors were engaged for 210Pb and 226Ra analysis including GMX-type 524
(ORTEC GMX-120265) and well-type (ORTEC GWL-100230) detectors which 525
interfaced to a digital gamma-ray spectrometer (DSPecPlus™). For the GMX-type 526
detector, absolute counting efficiencies for various photon energies were calibrated 527
using IAEA reference materials 327A, 444 spiked soil, CU-2006-03 spiked soil, 528
RGTh and RGU for sample weight at 100g as a reference, and coupled with an in- 529
house secondary standard for various masses (from 10 to 250 g) to calibrate the effect 530
of sample mass on the attenuation of γ-rays of various energies. For the well-type 531
detector, the counting efficiencies were calibrated by IAEA-RGTh and RGU from 0.5 532
to 3.5 g. 214Pb was used as an index of 226Ra (supported 210Pb) whose activity 533
concentration was subtracted from that of the measured total 210Pb to obtain excess 534
210Pb (210Pbex). The 210Pb and 214Pb activities were quantified based on photon peaks 535
centered at 46.52 and 351.99 keV, respectively. The activities of radionuclides were 536
decay-corrected to the date of sample collection. All radionuclide data were calculated 537
on salt-free dry weight basis. Error bars represent ±1σ around the mean based on 538
counting statistics and standard propagation of errors.
539 540
Supplementary references not in the main manuscript 541
Beyerle, U., Aeschbach-Hertig, W., Imboden, D. M., Baur, H., Graf, T., Kipfer, R.
542
(2000) A mass spectrometric system for the analysis of noble gases and tritium 543
from water samples. Env. Sci. Technol., 34, 2042-2050.
544
Brennwald, M.S., Rüssel, R., Kipfer, R. (2015a) Recent advances in the on-site 545
analysis and process-based interpretation of dissolved (noble) gases in water 546
bodies. Goldschmidt Abstracts, 386.
547
Brennwald, M.S., Rüssel, R., Kipfer, R. (2015b) Landing (noble) gas analytics in the 548
field: towards real time insitu gas determination. Goldschmidt Abstracts, 387.
549
Des Marais, D. J., Stallard, M. L., Nehring, N. L. & Truesdell, A.H. Carbon isotope 550
geochemistry of hydrocarbons in Cerro Prieto geothermal field, Baja California 551
Norte, Mexico. Chemical Geology 71, 159–167, 1988.
552
Hartmann A, Villinger H (2002) Inversion of marine heat flow measurements by 553
expansion of the temperature decay function. Geophysical Journal International 554
148 (3): 628-636. doi:10.1046/j.1365-246X.2002.01600.x 555
Lupton, J. E. (1979) Helium-3 in the Guaymas Basin: evidence for injection of mantle 556
volatiles in the Golf of California, Journal of Geophysical Research 84:
557
7464.7452.
558
Mackay, D. & Shiu, W. Y. A critical review of Henry’s law constants for chemicals 559
of environmental interest. J. Phys. Chem. Ref. Data 10 (4), 1175–1199 (2006).
560
Mächler, L., Brennwald, M. S., and Kipfer, R. (2012) Membrane inlet mass 561
spectrometer for the quasi-continuous on-site analysis of dissolved gases in 562
groundwater. Environmental Science and Technology 46: 8288-8296.
563
Padilla y Sánchez, R.J., Domínguez Trejo, I., López Azcárraga, A.G., Mota Nieto, J., 564
Fuentes Menes, A.O., Rosique Naranjo, F., Germán Castelán, E.A., Campos 565
Arriola, S.E., 2013, National Autonomous University of Mexico Tectonic Map of 566
Mexico GIS Project, American Association of Petroleum Geologists GIS Open 567
Files series.
568
Pfender M, Villinger H (2002) Miniaturized data loggers for deep sea sediment 569
temperature gradient measurements. Marine Geology 186: 557-570 570
Prol-Ledesma R.M., Torres-Vera M.A., Rodolfo-Metalpa R., Ángeles C., Lechuga 571
Deveze C.H., Villanueva-Estrada R.E., Shumilin E. and Robinson C. (2013) High 572
heat flow and ocean acidification at a nascent rift in the northern Gulf of 573
California. Nature Communications, DOI: 10.1038/ncomms2390.
574
Purkl S. and Eisenhauer, A. (2004) Determination of Radium Isotopes and 222Rn in a 575
groundwater affected coastal area of the Baltic Sea and the underlying sub-sea 576
floor aquifer. Marine Chemistry, 87 . pp. 137-149.
577
Santos I., Lechuga-Deveze C., Peterson R.N. and Burnett W.C. (2011) Tracing 578
submarine hydrothermal inputs into a coastal bay in Baja California using radon.
579
Chemical Geology, 282, pp. 1-10.
580
Schmidt, M., Linke, P., Sommer, S., Esser, D. & Cherednichenko, S. Natural CO2
581
seeps offshore Panarea – A test site for subsea CO2 leak detection technology.
582
Marine Technology Society Journal 49 (1), 19-30 (2015).
583
Schubert M., Kopitz J. and Chalupnik S. (2014) Sample volume optimization for 584
radon-in-water detection by liquid scintillation counting. Journal of Environmental 585
Radioactivity, 134, pp. 109-113.
586
Von Damm, K. L., Edmond, J. M., Measures, C. I., Grant, B. (1985) Chemistry of 587
submarine hydrothermal solutions at Guaymas Basin, Gulf of California.
588
Geochimica Cosmochimica Acta 49: 2221–2237.
589
590
591 592
Figure S1: Seismic base map showing the distribution of available 2D seismic data in 593
the Guaymas Basin and major structural elements (after Padilla y Sánchez et al., 594
2013). Central and Southern gulf spreading centers are labelled, G–Guaymas, C–
595
Carmen, F–Farallon, NP–North Pescadero, SP–South Pescadero, A–Alarcon, EPR–
596
East Pacific Rise.
597 598 599
600
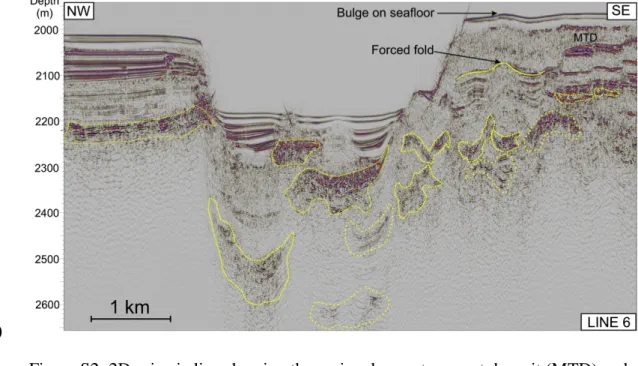
Figure S2: 2D seismic line showing the regional mass transport deposit (MTD) and 601
interpreted sill intrusions (yellow polygons).
602 603 604
605
Figure S3: Photograph of a massive sulfide sample collected on the southern summit 606
of the mound structure.
607 608
609 610
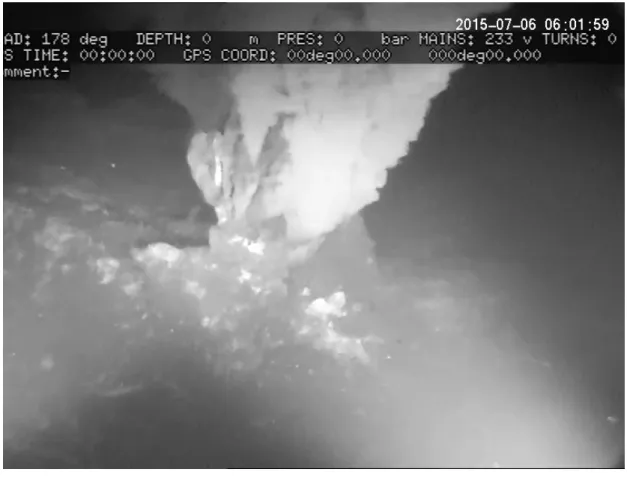
Figure S4: Video still of one of the seven active vents on top of the mound structure.
611 612
613 614
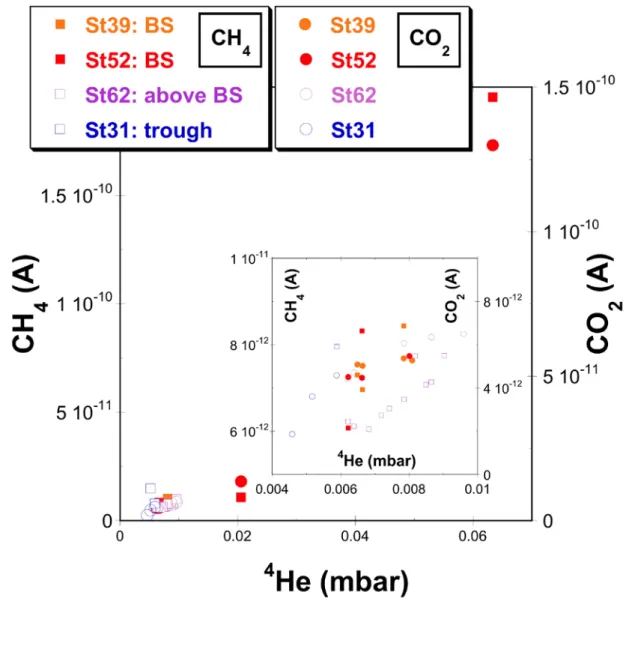
Figure S5: MIMS-determination of dissolved (4)He, CH4 and CO2 partial pressures 615
(mbar) measured at, above and in the vicinity of the hydrothermal vent site (Stxy:
616
station number xy, BS: 'Black Smoker - within the hydrothermal field (stations: 39, 617
52)', above BS: 'free water column above vent sites (station 62)', trough: samples in 618
the deep trough of the northern Guaymas Basin (station 31)).
619
The partial pressures of CO2 and CH4 are reported as un-calibrated raw MIMS 620
detector signals.
621
622 623
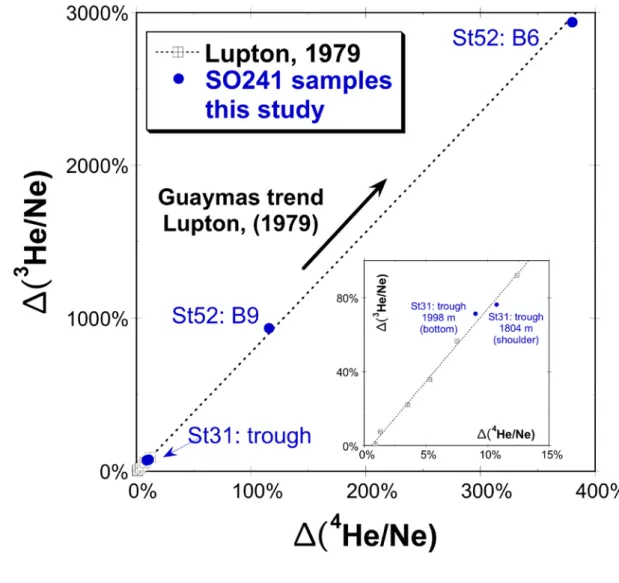
Figure S6: Dissolved He and Ne concentrations measured at the hydrothermal vent 624
site in comparison to earlier noble gas measurements in the southern part of the 625
Guaymas Basin (Lupton, 1979). The samples from the vent site fall on the line 626
defined by the earlier measurements from the southern Guaymas Basin and thus carry 627
isotopic light He (3He/4He: 10.8.10-6, Lupton, 1979) from the same general MORB 628
source. For comparison noble gas (isotope) concentrations are reported and 629
normalized as in Lupton, 1979:
630 631
632
633
where Xm depicts the measured concentration of X, and XASW is the expected 634
atmospheric equilibrium concentration (atmospheric saturated water: ASW) for the 635
given physical condition of the water. As iHeASW and NeASW only barely change with 636
varying temperature and salinity the NeASW/iHeASW ratio is virtually independent of 637
the actual physical condition of the water. Stxy: 'station number, 'Bz': bottle number.
638
Station 52: Black Smoker site, Station 31: open water column of the trough.
639
640
641 642
Figure S7: Hydrocarbon end member concentrations (methane, ethane, propane) 643
calculated for hydrothermal fluids venting at the smoker area.
644 645
646 647
Figure S8: Dissolved methane concentration and carbon isotope data (red dots) 648
determined in bottom water samples from the smoker area. Grey dots indicate mixing 649
curves of a hydrothermal end member methane A (δ13C =-39 ‰, 7nM) with 650
admixture of a second methane-containing fluid B and B’ (δ13C =-15 ‰), 651
respectively, at variable dilution factors of 1:100 and 1:10,000 compared to fluid A.
652 653 654
655 656
Figure S9: Stable carbon isotope composition of hydrocarbons dissolved in venting 657
hydrothermal fluids (red dots) indicate both hydrocarbons derived from organic 658
matter degradation influenced by volcanic heat intrusion (e.g. Cerro Prieto volcanic 659
complex; Des Marais, 1988), and abiogenic hydrocarbon formation (e.g. Lost City 660
HF, Proskurowski et al., 2008; Von Damm Vent, McDermott et al., 2015).
661
662
Figure S10: Calculated heat flow for Site SO241-70P04 (top) and SO241-60P01 663
(bottom) using the Bullard Plot method. Black dots represent sensors used to calculate 664
the heat flow whereas unfilled dots represent the sensor positions, which were not 665
used for any calculations because they were affected by surface artifacts such as 666
incomplete penetration of the lance.
667 668
669 670
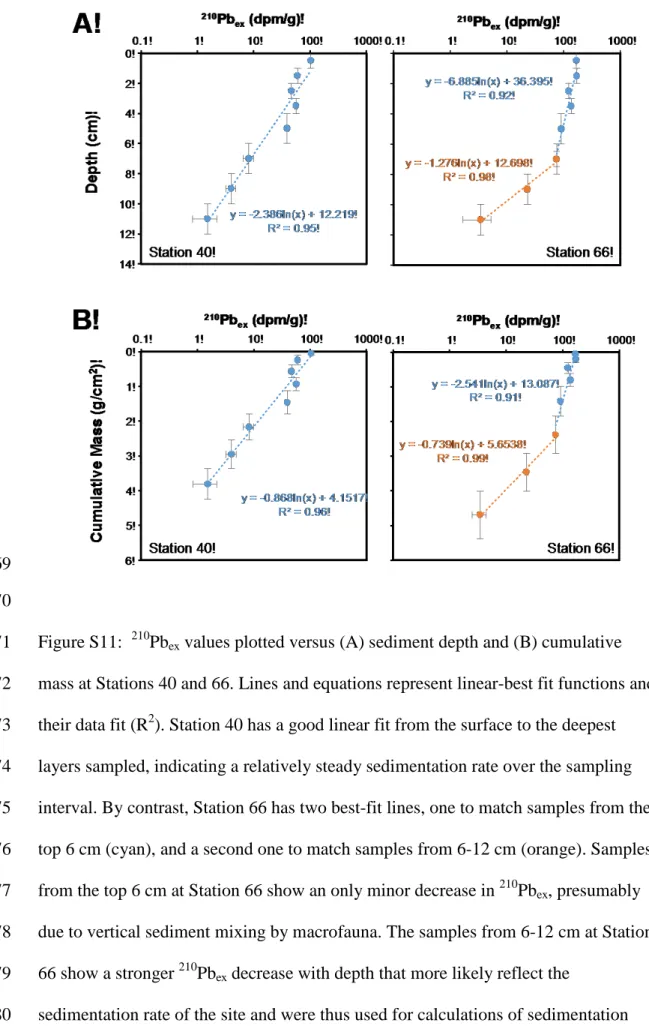
Figure S11: 210Pbex values plotted versus (A) sediment depth and (B) cumulative 671
mass at Stations 40 and 66. Lines and equations represent linear-best fit functions and 672
their data fit (R2). Station 40 has a good linear fit from the surface to the deepest 673
layers sampled, indicating a relatively steady sedimentation rate over the sampling 674
interval. By contrast, Station 66 has two best-fit lines, one to match samples from the 675
top 6 cm (cyan), and a second one to match samples from 6-12 cm (orange). Samples 676
from the top 6 cm at Station 66 show an only minor decrease in 210Pbex, presumably 677
due to vertical sediment mixing by macrofauna. The samples from 6-12 cm at Station 678
66 show a stronger 210Pbex decrease with depth that more likely reflect the 679
sedimentation rate of the site and were thus used for calculations of sedimentation 680
rates. While the profiles of 210Pbex show good agreement independent of the y-axis 681
units at Station 40, there is a considerable difference between 210Pbex profiles at 682
Station 66 depending on whether sediment depth or cumulative mass are used as y- 683
axis units. This discrepancy is likely an artefact of core compaction during sediment 684
sampling. We consider 210Pbex relationships with cumulative mass, which correct for 685
compaction effects during coring, to be more reliable (especially at Station 66), and 686
thus report sedimentation rates that have been corrected for cumulative mass in this 687
article.
688
Supplementary Tables 689
Table S1: Heat flow measurements carried out during SO241 690
691
692
Bottle Latitude Longitude Depth Temperature Salinity Methane (C1) Ethane (C2) Propane (C3) δ13C-C1 δ13C-C2 δ13C-C3 222Rn(exc.)a Mn Mg Sr 87Sr/86Sr Si Ba Li N W (m) (°C) (‰) (nM) (nM) (nM) (‰ VPDB) (‰ VPDB) (‰ VPDB) enrich. fact. (µmol/l) (mmol/l) (µmol/l) (mmol/l) (nmol/l) (µmol/l)
1 27.41258 -111.3870 1504 3.1 34.60
2 27.41284 -111.38696 1766 2.9 34.61 1366.1 3.7 0.8 -33.8 0.02 53.0 88.6 0.16 128 23.1
3 27.41288 -111.38696 1767 2.9 34.61 1.7 <d.l. 54.1 88.7 0.70917
0 0.18 145 24.9
4 27.41204 -111.38732 1768 4.1 34.55 508.2 0.8 0.4 -26.4 0.14 52.8 88.2 0.18 147 23.3
5 27.41204 -111.38732 1768 4.1 34.64 1.0 <d.l. 54.3 89.2 0.70916
7 0.18 143 24.9
6 27.4121 -111.38732 1768 4.3 34.68 66885.7 171.7 22.9 -36.8 -9.9 -15.8 0.49 52.9 88.4 0.18 451 23.8
8 27.4121 -111.38732 1768 4.4 34.62 16.2 3.79 53.9 89.6 0.70912
9 0.26 946 29.0
9 27.41212 -111.38734 1772 6.9 34.64 26801.6 59.1 7.8 -37.7 -10.5 1.33 53.9 88.6 0.70915
6 0.20 410 26.5
26010.5 57.4 8.2 -36.2
10 27.41214 -111.3872 1775 17.4 34.96 22987.6 54.2 7.1 -39.0 -11.1 4.5 1.18 53.9 88.9 0.70915
9 0.20 383 26.3
22466.2 52.1 6.8 -38.7
11 27.41214 -111.3872 1775 28.0 34.17 18684.1 42.6 6.1 -14.9
-10.7 -14.4 1.10b 52.9b 88.3b 0.19b 353b 24.7b
-14.9
12 27.41212 -111.38718 1773 12.1 34.26
360284.0 849.3 137.4 -10.2 -15.0
81.5 23.9 51.0 90.6 0.70890
6 0.69 1766 59.2
400801.8 893.0 110.2 -37.0
1009.3 129.4 -37.8
aEnrichment factor of 222Rn relative to the lowest value measured on this CTD station (bottle 5). See text for details.
bInorganic geochemistry values are a mixture of bottle 10 (~20%) and bottle 11 (~80%)
Table S3: Isotope ratios of He and Ne reported as the percentage deviations of He/Ne and 695
4He/Ne from the solubility ratios (see Lupton (1979) for details).
696 697
Location Bottle Latitude Longitude ∆(3He/Ne)
[%] ∆(4He/Ne) [%]
N W
Black Smoker 6 27.4121 -111.38732 2937 380
Black Smoker 9 27.41212 -111.38734 936 116
Background trough bottom 2 37.30207 -111.52433 71 9 Background trough shoulder 7 37.30207 -111.52433 76 11
698 699