GEOMAR, Helmholtz Centre for Ocean Research, Kiel
Master Thesis
Seasonal condition and growth performance of Eastern Baltic cod larvae based on
RNA/DNA ratios
by Luisa Berghoff Matr.No.: 996907
supervised by Dr. Catriona Clemmesen, Dr. Bastian Huwer and Dr. Holger Haslob
examined by Prof. Dr. Thorsten Reusch and Dr. Catriona Clemmesen
I
Contents
1 Summary ... 1
2 Introduction ... 3
2.1 Cod in the Baltic Sea ... 3
2.2 Historical development of stock size, fishing mortality and recruitment ... 5
2.3 Requirements for Recruitment ... 5
2.4 Sensitivity of Early Life History stages ... 7
2.5 Nutritional Condition and Growth Performance ... 8
3 Material and Methods ... 11
3.1 Field sampling ... 11
3.2 Laboratory analyses... 12
3.3 Determination of growth and growth performance estimates ... 14
3.4 Zooplankton sampling (abundance/biomass) ... 18
3.5 Data and statistical analysis... 19
4 Results ... 20
4.1 Length-frequency distribution of Baltic cod larvae ... 20
4.2 Nutritional condition of Baltic cod larvae (standardized R/D ratios) ... 23
4.3 Hydrographical profiles at representative stations in the years 2006 and 2011 ... 26
4.4 Specific growth rate of Baltic cod larvae ... 28
4.5 Growth performance of Baltic cod larvae ... 33
4.6 Suitable prey fields and correlation with nutritional condition of Baltic cod larvae ... 39
5 Discussion ... 48
5.1 Abundance and length-frequency of Baltic cod larvae ... 48
5.2 Nutritional condition, growth rate and growth performance of Baltic cod larvae ... 49
5.2.1 Nutritional condition ... 49
II
5.2.2 Growth rate ... 50
5.2.3 Growth performance ... 52
5.3 Relation between nutritional condition and suitable prey fields ... 53
5.4 Relevancy for recruitment ... 56
6 Conclusion ... 63
7 Acknowledgements ... 64
8 References ... 65
9 Declaration of Authorship... 74
______________________________________________________________________ Summary
1
1 Summary
During the second half of the 20th century, anthropogenic exploitation and changes in atmospheric forcing resulted in high variations in recruitment and size of the Eastern Baltic cod stock. Successful spawning of Eastern Baltic cod is presently restricted to the most westerly deep basin of the Baltic Sea, the Bornholm Basin. Within the Bornholm Basin, high variability in environmental conditions has shown to be an important driver for the successful development of cod early life stages. The larval stage has been suggested to be important in shaping year-class strength as survival rates of fish larvae can be limited during different ‘critical periods’
depending on prevailing abiotic and biotic conditions. Annually performed ichthyoplankton surveys collect samples from the main spawning ground of Eastern Baltic cod to determine abundance and distribution patterns of cod early life stages and results for the year 2011 revealed highest larval cod abundance (ca. 70·109) since the mid-1980s (ca. 110·109). Abundances of Baltic cod larvae were unexpectedly low in 2004-2010 and high in 2011-2012. Larvae analysed in this study came from the high-abundance year 2011 and additionally provided data from 2006 and 2007. Hence, information on both, years of high and low abundance of cod larvae were available allowing for a direct comparison of contrasting situations in the field. The seasonal nutritional condition and growth performance (Gpf) of Eastern Baltic cod larvae in the years 2006, 2007 and 2011 were analysed based on the RNA and DNA ratio (R/D ratio) of whole larval tissue. The R/D ratio is a biochemical indicator for the recent nutritional condition and can be further converted into estimates of larval growth rate and growth performance. Furthermore, for 2006 and 2011 the R/D based nutritional condition of Baltic cod larvae was related to available data on the phenology, abundance and biomass of the main zooplankton species. This study demonstrated larval abundance, nutritional condition and growth performance to vary on an inter- and intra-annual basis. Both, nutritional condition and growthincreased with larval size.
Baltic cod larvae in the year 2011 presented higher nutritional condition and Gpf than in the years 2006 and 2007, mainly driven by high values in May 2011. Comparison with literature-derived reference growth rates revealed that Baltic cod larvae generally grow poorly. Latest sampling months at the end of the spawning season in November 2006 and 2011 presented relatively good nutritional condition of cod larvae. Good correlation between the nutritional condition of cod larvae and the occurrence of early developmental stages of the main copepod species, with
______________________________________________________________________ Summary
2 highest importance of Pseudocalanus spp., was found. Relatively high nutritional condition and growth rates in November, in combination with low abundances of the main copepod species, led to the assumption that high numbers of specimens of the rotifer genera might have a positive influence on cod larvae. This study provides evidence from the field that Baltic cod larvae might depend strongly on the spatial and temporal match and the magnitude of early developmental stages of the species Pseudocalanus spp. in order to increase their nutritional condition. Higher nutritional condition potentially increases the growth rate of Baltic cod larvae which can further result in reduced mortality. Thus, variability in larval nutritional condition and growth has a high potential to contribute to variability in year-class strength.
____________________________________________________________________ Introduction
3
2 Introduction
2.1 Cod in the Baltic Sea
Since the mid-20th century, when the exploitation of the Baltic Sea became more intense, Atlantic cod (Gadus morhua) has been a popular hence commercially important fish species of the Baltic Sea (Sparholt 1994, Eero et al. 2008). Cod is a demersal species that preys on other fish (e.g. herring and sprat in the Baltic) as well as on various invertebrates (e.g. Saduria entomon and Harmothoe sarsi in the Baltic). Depending on the life-history stage of cod, habitats are variable and include shallow coastal waters down to greater depths of the continental shelf.
The eggs are pelagic and also the larvae and the small juveniles stay in the pelagic zone until the juveniles settle to the bottom at a length of ca. 5 cm (Hüssy et al. 1997) and go over to a demersal life-style. In general, juveniles occur in nursery grounds (e.g. sea grass beds) being less than 10 to 30 m deep and providing shelter against predation (Cohen et al. 1990, Uzars and Plikshs 2000), while adults usually prefer deeper and colder water.
The species Gadus morhua is characterised by different subpopulations forming distinct spawning stocks geographically inhabiting the North Atlantic, the Arctic and the Baltic Sea.
Within the Baltic Sea, cod is managed as two separate stocks, the Western and the Eastern Baltic cod stock (Bagge et al. 1994), which also show a number of biological differences and are genetically distinct (Hüssy et al. 2016). The management area of the Western Baltic cod is located in the Belt Sea, the Sound and the Arkona Basin (Subdivision (SD) 22 – 24; ICES 2012).
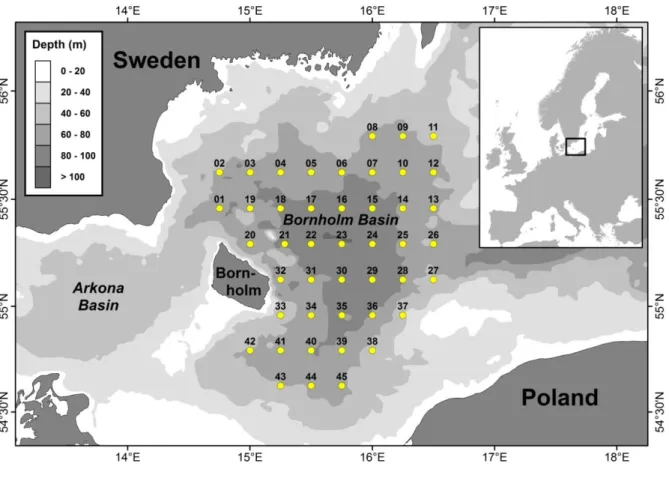
The management area of the Eastern Baltic cod (further referred to as Baltic cod) stock is located in the Central and Eastern Baltic inclusive of the Bothnian Sea, Bothnian Bay and the Gulf of Finland (ICES SDs 25-32). In the past, Baltic cod spawning grounds were concentrated on the three major Baltic basins: the Bornholm Basin, the Gdansk Deep and the Gotland Basin (Fig. 1, ICES subdivisions 25-32, Bagge et al. 1994, MacKenzie et al. 1996).
____________________________________________________________________ Introduction
4 Fig. 1: Map of the Baltic Sea showing the location of cod spawning areas (black) and ICES subdivisions (SD, numbers) for the management of important fish species in the Baltic Sea. The management area of the Eastern Baltic cod stock extends from SD 25 to SD 32. The red dashed lines indicate the loss of the two spawning grounds for Eastern Baltic cod in the Gdansk Deep and the Gotland Deep since the late- 1980s (Köster et al. 2005). The green line around SD 25 shows the recently only spawning ground of Eastern Baltic cod in the Bornholm Basin. The Fig. was modified after Bagge et al. (1994).
Within these deep basins a permanent halocline persists throughout the year (Elmgren et al.
1984) enabling cod eggs to float naturally at great depths. Due to changes in climatic forcing, the lack of inflows of oxygen-rich, highly saline water from the North Sea and the resulting increase of areas with persistently low oxygen, the Gdansk Deep and the Gotland Basin became more and more unsuitable environments for cod eggs. At present, the Bornholm Basin is therefore considered as the only spawning ground for Baltic cod where successful reproduction is possible (Fig. 1, ICES 2012).
____________________________________________________________________ Introduction
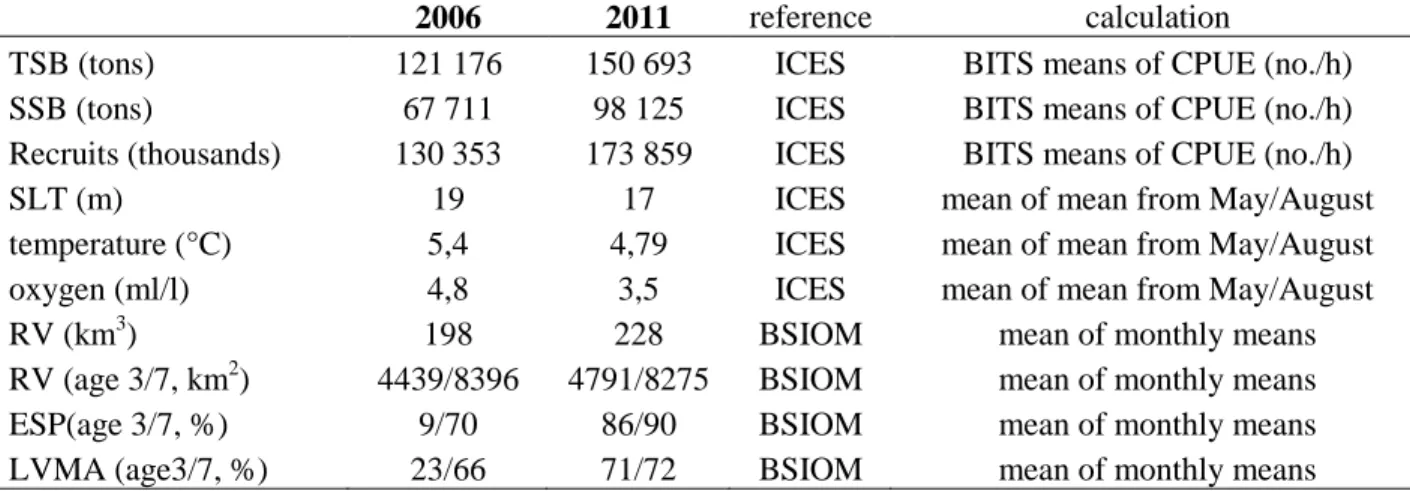
5 2.2 Historical development of stock size, fishing mortality and recruitment
The International Council for the Exploration of the Sea (ICES) has been assessing the stock biomass of cod in the Baltic Sea since 1966 down to the present day. Since 2014, problems in the analytical stock assessment of Eastern Baltic cod have led to the recent use of spawning stock biomass (SSB) indices from BITS surveys (Baltic International Trawl Surveys) for estimation of a SSB proxy (ICES 2014).
With the initiation of assessment by ICES, the stock biomass of Baltic cod showed extreme fluctuations. Relatively low spawning stock biomass (SSB) was recorded during the 1960s (about 200.000 tonnes), followed by a heavy increase reaching historically high levels during the early 1980s (about 700.000 tonnes). From the early 1990s to 2006 cod biomass has been below average. By extending the time series back to 1946, Eero et al. (2007) showed Baltic cod to have been relatively heavily exploited during the second half of the last century. Exploitation in conjunction with disadvantageous environmental conditions, led to a fast decline in cod abundance during the mid-1980s. As fishery management has improved, fishing mortality between 2008 and 2011 has been estimated to be the lowest in the time series. Between 2006 and 2009 investigations by ICES (2012) calculated Baltic cod recruitment (at age 2) to be above average of the last 20 years. However, the combination of increasing recruitment and hence stock biomass and an apparently low amount of available food for cod has led to a reduced mean weight of older cod (4-7 years) since 2007 (Eero et al. 2012, 2015, ICES 2012, 2013).
2.3 Requirements for Recruitment
In order to define the key processes determining the fluctuations in SSB and recruitment success of Baltic cod, a variety of investigations and modelling on the early life history stages of Baltic cod have been conducted (e.g. Grønkjær and Wieland 1997, Wieland et al. 2000, Möllmann et al. 2000, Hinrichsen et al. 2002, 2005, Köster et al. 2003a, 2005, Huwer et al. 2011).
Investigations on hydrographical prerequisites in the deep Basins, triggering important processes within the reproductive cascade of cod (gonad maturation, fertilization, egg survival, hatching rate, larval behavior), generated the concept of the so-called “Reproductive Volume” (RV;
Westin and Nissling 1991, Nissling and Westin 1991, Nissling and Vallin 1996, Köster et al.
____________________________________________________________________ Introduction
6 2005). The RV describes the volume of water, which provides at least the physical lower limits (O2 ≥2ml·l-2; salinity ≥11, and temperature ≥1.5°C) for successful reproduction of cod.
Considering the stratification of the Baltic Sea characterised by I) a permanent halocline at great depths separating water layers of different densities and II) a thermocline during summer months caused by surface heating, the proliferation of oxygenated saline water into the basins is dependent on horizontal water inflows from the North Sea. In the past, these so-called Major Baltic Inflows (MBI´s) were recorded every 1 to 3 years, while changes in climatic forcing reduced the frequency and magnitude of intervals to approximately every ten years since the early-1980s (Feistel et al. 2008). During stagnation periods oxygen contents below and within the halocline are reduced creating an unsuitable habitat for many organisms. The last major salt water inflows were reported in 1993 and 2003, a smaller one in 2006 and again in 2014 (Schinke and Matthäus 1998, Meier 2007, Nausch et al. 2013, Mohrholz et al. 2015). The frequency and intensity of these inflows has been suggested to have an influence on the recruitment success of Baltic cod. Köster et al. (2005) reported higher egg abundances after the MBI in 1993, but the abundances were not represented by higher larval abundances and recruitment levels in subsequent years. Earlier investigations by Köster et al. (2003a) already found that higher egg survival rates were not correlated with high abundance of larvae. However, larval abundances were correlated with recruitment level. Despite an increased SSB of Baltic cod, assessments on the reproductive volume by the ICES/HELCOM Working group on Integrated Assessments of the Baltic Sea (WGIAB; ICES 2013) indicated poor abiotic conditions for cod recruitment of the year-classes 2010 and 2011. However, the year-class of 2011 appeared to be above the recent average with highest estimations of recruits at age-2 (174 mill.) since 1988 (ICES 2014). Also abundances of Eastern Baltic cod larvae in 2011 were reported to be exceptionally high throughout the entire spawning season (Köster et al. unpubl., Holger Haslob and Bastian Huwer, pers. comm.), indicating the importance of processes influencing early life history stages and especially the survival of larvae for successful recruitment.
____________________________________________________________________ Introduction
7 2.4 Sensitivity of Early Life History stages
Considering the different developmental stages of Baltic cod fish, high egg mortalities are mainly caused by above–mentioned unfavourable hydrographical conditions and to a certain extent by clupeid predation (Köster and Schnack 1994, Köster and Möllmann 2000, and Köster et al. 2005). Recent investigations by Neumann et al. (2014) found changes in the ichthyoplankton abundance and composition in the diet of the two Baltic clupeid species herring (Clupea harengus) and sprat (Sprattus sprattus), indicating reduced predation pressure in the latest period, potentially contributing to the improvement of cod recruitment.
Cod eggs in the Bornholm Basin usually occur in depths below 55m with a peak in abundance between 60 and 70 m (Bagge et al. 1994). After hatching, cod larvae need to conduct an ontogenetic vertical migration in order to prey on suitable copepod developmental stages in shallower water layers, followed by a reversed migration at increasing sizes into deeper layers providing cooler temperatures and larger prey items (Grønkjær and Wieland 1997, Grønkjær et al. 1997, and Huwer et al. 2011). Despite variations in egg mortality, the larval phase may be the bottleneck for successful recruitment of fish (Köster et al. 2003a). The Critical Period hypothesis (Hjort 1914, 1926) already linked the fate of year-class strength to variability in the performance of larvae finding suitable and sufficient prey items during first-feeding (critical stage: transition from endo- to exogenous nutrition). The Critical Period hypothesis was further supplemented by the Match-Mismatch hypothesis (Cushing 1974, 1975, 1990) declaring the importance of timing in terms of hatching larvae and the production of suitable zooplankton prey. Especially for temperate fish, the match of fish production and prey field would result in a narrow time window (few days or weeks) allowing for larval survival.
Besides variable predation pressure by clupeids (e.g. Köster and Schnack 1994, Köster and Möllmann 2000) and fluctuations in circulation patterns influencing dispersion and/or retention of larvae (Hinrichsen et al. 2001, 2003a), prey abundance and composition have been found to be crucial for larval cod survival (Munk 1997, Hinrichsen et al. 2003b, 2005, Köster et al. 2005).
The decline of the copepod species Pseudocalanus spp. during the last two decades is considered to be a trigger for a shift from a non-limited to a food-limited state for larval cod and also a shift in spawning time from late spring to summer months (Wieland et al. 2000, Möllmann et al.
____________________________________________________________________ Introduction
8 2000, Hinrichsen et al. 2003b). Biophysical modelling approaches have been conducted in order to identify the probability of survival of Baltic cod larvae (e.g. Hinrichsen et al. 2001, 2002, 2003b). However, information on larval Baltic cod growth and survival and the resulting implications for recruitment success from field studies are still scarce, and have so far largely been limited to the main spawning time (e.g. Grønkjær and Wieland 1997, Grønkjær et al. 1997, Huwer et al. 2011). Thus, it is of high interest to further investigate the nutritional condition, growth and survival chances of Baltic cod larvae in the field on a broader seasonal and inter- annual scale in order to contribute to a better understanding of the factors that influence recruitment success and the development of the future stock biomass.
2.5 Nutritional Condition and Growth Performance
In order to analyse the survival success of early developmental stages of fish, laboratory experiments and – to a smaller extent – field-studies revealed the cellular ratio of RNA and DNA (R/D ratio) to be a suitable biochemical indicator reflecting the recent nutritional condition and growth rate (G) of larvae (e.g. Clemmesen 1994, Grønkjær et al. 1997, Buckley et al. 1999, Huwer et al. 2011, Peck et al. 2015, Foley et al. 2016). Along the lines of the ”stage-duration hypothesis” (Houde 1987, Anderson 1988), the energetic input during the larval phase is concentrated on growth and storage of energy is negligible (Folkvord 2005). As larvae increase in size, mortality due to starvation and predation are generally thought to decrease and hence growth and nutritional condition become important factors affecting the year-class strength (Caldarone et al. 2003, Buckley et al. 2006, Huwer et al. 2011).
The ribosomal RNA contributes to the biosynthesis of proteins and increases in concentration during growth phases depending on the prevailing nutritional condition of a larva. The DNA content of a cell remains about constant in either well-fed or starving larval fish. Variable nutritional conditions of larvae have been found to be reflected by the R/D ratio within a few days allowing for estimations of environmental conditions experienced by larvae shortly before the time of sampling (e.g. Clemmesen 1994, Caldarone et al. 2005, Peck et al. 2015, Foley et al.
2016). Further, R/D ratios have been found suitable to be converted into estimations of growth by usage of R/D-models. As fishes are poikilotherms, biosynthesis of proteins per unit RNA is
____________________________________________________________________ Introduction
9 dependent on the surrounding temperature. Laboratory experiments revealed a positive linear relationship between R/D ratio, temperature and size-specific growth (e.g. Buckley et al. 1984, Folkvord et al. 1996, Otterlie et al. 1999). R/D-based growth models including temperature terms have been developed for cod only and for a cod-haddock data set (RD-T-models, Caldarone et al. 2005, Folkvord 2005, Buckley et al. 2008). Next to information on growth rates, the more objective, temperature and size independent growth performance (Gpf) can be estimated. By help of reference growth rates from laboratory reared, fast-growing larvae, field- observed specific growth rates can be standardized (size-temperature-dependent growth model, STDG model, Folkvord 2005). The quotient of maximum possible growth realized by a larva at given size and temperature is described by comparing field-observed growth rates with model- based predicted growth rates.
Nutritional condition and growth performance have been found to be suitable indicators to understand and detect key regulatory mechanisms and their variability determining survival and hence the inter-annual recruitment success (e.g. Clemmesen et al. 1997, Grønkjær et al. 1997, Folkvord 2005, Buckley et al. 2008, Huwer et al. 2011). The shift from a non-limited to a food- limited environment for Baltic cod larvae proposed by different studies (Möllmann et al. 2000, Hinrichsen et al. 2003b) suggests intra- and inter-annual variances in the nutritional condition and growth performance of larvae mainly depending on the encounter with suitable and sufficient abundances of prey organisms. Field samples investigated in this study originate from the seasons 2006, 2007 (only August) and 2011. Especially the year 2011 was of high interest as larval abundances were exceptionally high throughout this season, despite indications of poor abiotic conditions for successful reproduction of Baltic cod by the WGIAB (ICES 2013). Based on the analyses of nutritional condition, growth and growth performance of Baltic cod larvae, this study aimed to investigate inter- and intra-annual variation between these years, with additional consideration on the occurrence of suitable prey fields.
____________________________________________________________________ Introduction
10 In summary, this study aimed to disprove the following null hypotheses:
H01: Nutritional condition and growth of Baltic cod larvae is consistent between the years.
H02: Nutritional condition and growth of Baltic cod larvae is consistent within the spawning season.
H03: The nutritional condition of Baltic cod larvae has no relation to the seasonal occurrence, abundance and stage composition of dominant zooplankton species.
____________________________________________________________ Material and Methods
11
3 Material and Methods
3.1 Field sampling
Cod larvae were caught in the Bornholm Basin of the Baltic Sea in 2006, 2007 and 2011. In this southern area of the Baltic Sea several ichthyoplankton surveys have been conducted throughout the years (Table 1). Cod larvae from these surveys were kindly provided by Bastian Huwer (DTU Aqua, Kopenhagen) and Holger Haslob (GEOMAR).
Fig. 2: Standard station grid for sampling of ichthyoplankton samples within the Eastern Baltic cod spawning area of the Bornholm Basin. Fig. provided by Bastian Huwer.
Within a standard station grid covering the area of the Bornholm Basin, double oblique hauls with a Bongo net were conducted (Fig. 2). During some cruises, additional Multinet (MN) hauls were deployed providing vertically resolved samples of 5m depth intervals (Table 1). For each station a hydrographical profile (temperature, salinity and oxygen concentration) was recorded
____________________________________________________________ Material and Methods
12 via CTD measurements. These CTD data were calibrated and allocated by Hans-Harald Hinrichsen (GEOMAR, Kiel). Once on board, cod larvae were quickly sorted out of the catch, pictures with an included scale bar were taken for later length analysis and each larva was put into an individual vial with seawater to be frozen at -80°C. Handling was conducted as fast as possible and samples were kept on ice preventing nucleic acids of larval tissue to degrade. Back at the respective institute, samples were stored again at -80°C.
3.2 Laboratory analyses
The ratio of RNA and DNA (R/D ratio) was determined according to the method described in Huwer et al. 2011. R/D data from 2006 and 2007 were kindly provided by Bastian Huwer. Cod larvae from the spawning season 2011 were analysed in the course of the year 2015 within this master thesis.
Pictures taken of each individual cod larva during the cruises were analysed by help of the software program image tool, determining the standard length (SL, mm) and taking notes on the larval appearance (e.g. number of eyes, shape). After unfreezing, cod larvae were gently washed in deionized water and after 30 minutes of refreezing at -80°C transferred into a freeze drier (Christ alpha 1-4) for at least 18 hours at -50°C and 0,100 mbar. The determination of larval dry weight (DW) in mg was conducted with a Sartorius SC2 micro balance. In order to facilitate later homogenization of larval tissue, differently sized glass beads were added into each vial (Sartorius, diameter: 2mm and 0, 17-0,5mm) to aid in mechanical disruption of the tissue.
Starting from this step, samples were kept on ice. In consideration of the given DW, a defined volume of Tris-SDS buffer (Tris 0.05; NaCl 0,1M; SDS 0, 01%; EDTA 0, 01; pH 8) was added to the larvae and incubated for 30 minutes. After hydration of larval tissue, vials were put into a shaker (RETSCH type MM2, at intensity 100, and room temperature) for 15 minutes. and then transferred into a Sigma 3-18 K centrifuge running for 8 minutes at a speed of 6803 RPM (RCF:
3829g, temperature: 1°C). After centrifugation, the supernatant of each sample was either transferred into a new vial for further dilution steps or directly into a black 96-well-cliniplate.
____________________________________________________________ Material and Methods
13 Table 1: Sampling
material
____________________________________________________________ Material and Methods
14 Larger larvae had to be diluted in order for their nucleic acid content to stay in the range of the defined calibration curves of RNA (y=41.20(±4.24)·x; R2=0.998±0.001; 16S-23S-ribosomal, Roche 10 206 938 001) and DNA (y=80.47(±7.01)·x, R2 = 0,995 ± 0.002; -DNA, Roche 10 745 782 001) avoiding a loss in quality. For better accuracy, the calibration curve and a control homogenate consisting of larval herring tissue with a known R/D ratio were added to the 96- well-cliniplate on each day of laboratory analyses.
Before running the analyses, two integrated dispensers of the Ascent Fluoroscan (Thermo Fisher) were prepared with Ethidium bromide (EB, 2.5mg·ml-1 dilution, Roth 2218.2) and TE buffer (Tris 0.05; NaCl 0,1M; EDTA 0, 01; pH 8), respectively. Measurements were conducted at an excitation wavelength of 355 nm and an emission wavelength of 590 nm at a temperature of 25°C. For determination of the R/D ratio, fluorescence was measured in three steps: I) the pure samples (autofluorescence), II) after addition of EB (total nucleic acids) and III) the remaining DNA after incubation with RNAse (Serva Ribonuclease A, from bovine pancreas) for 30 minutes at 37°C. Subtracting the autofluorescence and the fluorescence of DNA from the total nucleic acid fluorescence led to the remaining fluorescence of RNA. By help of the calibration curves, relative fluorescence values could then be converted into µg values of RNA and DNA.
3.3 Determination of growth and growth performance estimates
In this study, the multi-species-model developed by Buckley et al. (2008) was applied (covering a temperature range of 3.4-28°C) to estimate weight specific growth (G). The model was based on a meta-analysis including 13 studies with information on R/D values of fish larvae, rearing temperature and their instantaneous growth rates.
Data of R/D ratios from the different studies were standardized based on the method developed by Caldarone et al. (2006). This method uses a common slope ratio of 2.4 in order to convert R/D ratios from different laboratories into standardized R/D values (sRD), delivering data comparable between different methods and laboratories.
____________________________________________________________ Material and Methods
15 Accordingly, R/D ratios of analyzed cod larvae from 2006 and 2011 were first standardized to a slope ratio of 2.4 and then used in the equation originating from the multi-species growth-model data set by Buckley et al. (2008):
– (1) Where G is the instantaneous growth rate, sRD is the standardized RNA/DNA ratio and T is the temperature experienced by the cod larvae.
For the estimation of larval growth rates, information on temperature experienced by each individual larva is essential as metabolic rates increase with higher temperature. Temperatures in the Bornholm Basin vary within the water column due to stratified water masses, in particular during summer when solar radiation results in a thermocline in the upper part of the water column (Fig. 3). Besides, larvae have been found to conduct an ontogenetic vertical migration (Grønkjær and Wieland 1997, Grønkjær et al. 1997, Huwer et al. 2011). Therefore, the accuracy of information on temperature experienced by the larva depends on the gear used for sampling.
Sampling of larvae during the years 2006 and 2011 was conducted with either a Bongo net or a Multinet. Multinet samples enable vertically resolved sampling providing information at 5m depth intervals. As the conduction of Multinet hauls is rather time consuming, sampling of cod larvae during ichthyoplankton surveys is mainly conducted with Bongo nets. Bongo net hauls are not vertically resolved but rather integrate over the entire water column. Hence information on depth-dependent temperature at the exact sampling location was not available.
____________________________________________________________ Material and Methods
16 Fig. 3: Exemplary hydrographical profile at station BB23 in August 2011 with assumed size-dependent distribution patterns of Baltic cod larvae. Arrows and numbers 1-3 next to the graph indicate the assumed distribution patterns of Baltic cod larvae based on their standard length.
Field-based investigations on growth of Baltic cod larvae have focused on larvae sampled with a Multinet, providing information on the vertical distribution of cod larvae (e.g. Huwer et al.
2011). In order to gain information on growth rates of cod larvae originating from both Bongo net and Multinet hauls, a uniform approach for the calculation of temperature was developed based on information on general size-dependent vertical migration patterns of Baltic cod larvae found in the literature (Table 2). Literature-based migration patterns were further extended by information on size-dependent depth distribution of cod larvae obtained by Multinet hauls. Based on information on ontogenetically driven vertical migration, pre-feeding larvae (<4.5 mm) are assumed to be concentrated within hatching depths, reflected by the halocline (50-70 m, Fig. 3).
In order to find suitable prey for initiation of first-feeding, larvae of 4.5 to 6 mm are considered to migrate from the halocline into shallower depths, while water temperatures above the thermocline usually appear to be high potentially causing thermal stress for cod larvae (20-50 m, Fig. 3). Finally, established feeding larvae (>6 mm) have been found to start a reversed migration into deeper waters due to increased larval size and the ability to feed on bigger prey located
____________________________________________________________ Material and Methods
17 within and below the halocline (20-50 m, Fig. 3; Grønkjær and Wieland 1997, Grønkjær et al.
1997, Huwer et al. 2011).
Table 2: Summary of size groups, their function and assumed vertical distribution modified after Grønkjær and Wieland 1997 and Huwer et al. 2011.
size class SL [mm] functional group depth range [m]
1 < 4.5 pre-feeding yolk-sac larvae 50 - 70
2 4.5 - 6 first and early feeding larvae 20 - 50
3 > 6 established feeders 20 - 70
Based on this information, the methodology used for calculation of temperatures experienced by cod larvae was applicable for both sampling gears (Bongo and Multinet). Temperature means of the defined depth intervals were calculated at each respective sampling station and assigned to the different size classes (Table 2).
The growth rate G from equation 1 was then converted into specific growth rate (SGR, % d-1) according to:
(2)
Field-based estimations of SGR can be compared to laboratory derived models producing suitable reference growth predictions. By help of reference growth rates (Gref) of laboratory reared larvae, hypothetically growing at maximum rate, field-observed specific growth rates could be put into relation. In this study, Gref was calculated according to the size-temperature dependent growth model (STDG-model) presented by Folkvord (2005) using the available data on dry weight and observed ambient temperature of sampled Baltic cod larvae. Observed biochemically derived growth rates were divided by growth rates predicted by the Folkvord model resulting in the so called growth performance (Gpf):
Gpf = SGR/Gref (3)
____________________________________________________________ Material and Methods
18 This calculation allowed estimating the fraction of maximum growth realized by a larva of a given size and under a defined temperature. Hence, it was possible to obtain an objective growth calculation independent of the parameters size and temperature. According to limit values of the STDG-model, larvae with a dry weight < 30 µg were excluded from the Gpf analysis. Also all larvae with a negative reference growth rate were disqualified in terms of unrealistic growth conditions.
3.4 Zooplankton sampling (abundance/biomass)
Reaching beyond the mere knowledge on nutritional condition and growth of Baltic cod larvae, also the phenology of zooplankton species and hence possible match/mismatch situations with cod larvae were analysed in the years 2006 and 2011. These data were kindly provided by Jörg Dutz (IOW, Warnemünde). No data were available for the year 2007.
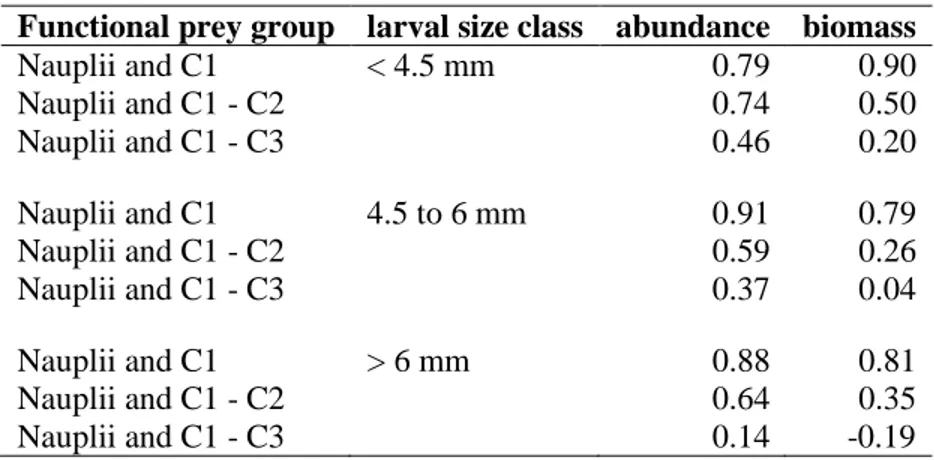
Parallel to ichthyoplankton sampling, additional Baby-Bongo (150 µm, 0.12 m2 mouth opening) hauls were conducted at representative stations within the Bornholm Basin station grid (Fig. 2) in order to sample zooplankton. The samples were analysed in terms of copepod composition and their developmental stages. Taxonomic identification of copepods was conducted in the laboratory with a compound microscope. Copepods were divided into an overall nauplii stage (N1-N6 combined), 5 copepodite stages (C1 up to C5) and adult stages which further were differentiated into sexes (male and female). After counting and identification, the abundance of each species and stage was extrapolated by help of the filtered volume of water derived from flow meter readings. Abundances were given as individuals · m-3. By help of species-specific conversion factors according to the HELCOM standards, abundances of copepods and other taxa were converted into estimations of biomass in µg C · m-3. Investigations on the stomach content of cod larvae by Voss et al. (2003) showed that throughout the season cod larvae in the size range of 4 to 6 mm predominantly feed on nauplii stages. Copepodite stages of the species Acartia spp. were completely avoided with an active selection for Pseudocalanus spp..
Accordingly, the main focus was attributed to link the abundance/biomass of early developmental stages of Pseudocalanus spp. with the nutritional condition (standardized R/D) of
____________________________________________________________ Material and Methods
19 Eastern Baltic cod larvae. Additional analyses with the overall spectrum of sampled copepods and other taxa (cladocera and rotifers) were also conducted. For corresponding months, sRD of cod larvae was compared with different combinations of copepod developmental stages: I) N1- N6 + C1, II) N1-N6 + C1-C2 and III) N1-N6 + C1-C3. These developmental groups were pooled for all copepod species and Pseudocalanus spp. alone. The choice of the stage-groups was based on the fact, that nauplii could not be quantitatively sampled with a 150 µm Baby-Bongo.
However, the occurrence of copepodite stage 1 premises a previous existence of nauplii.
3.5 Data and statistical analysis
Larvae >15 mm were excluded from the analyses, as most Atlantic cod species undergo a metamorphosis from larvae to juvenile approximately starting at a SL of 12 mm (Kvenseth and Oiestad 1984; Pedersen et al. 1989). Larvae were always considered as I) one group and as II) three different size classes based on their functional size group (Table 2). The length-frequency distribution of cod larvae in each month was checked for bimodal length distribution by application of the Hartigan's dip test statistic for unimodality. For the variables of sRD, growth and growth performance a multi-factorial analysis of variance (ANOVA) was conducted including the factors year, month and size class and their respective interactions. The data were checked for normal distribution and homogeneity of variance both visually and by application of suitable tests (parametric tests: Shapiro test, Fligner test; non-parametric tests: Kruskal-Wallis, Levene-test). Data were either square root or log transformed if necessary to fit assumptions.
________________________________________________________________________ Results
20
4 Results
Eastern Baltic cod larvae analysed in this study originated from the spawning seasons 2006, 2007 and 2011. Only larvae with a standard length < 15 mm were analysed. Laboratory analyses were conducted on 944 larvae from 2011. Provided data from the years 2006 and 2007 comprised information on sRD and growth of 187 and 142 cod larvae respectively. The data from 2006 and 2011 were seasonally resolved originating from several sampling months, while data from 2007 were only sampled during August. Hence information on cod larvae originating from the year 2007 were exclusively included into analyses of larval growth performance.
4.1 Length-frequency distribution of Baltic cod larvae
Monthly means (±sd) of larval cod standard length for all size classes and in relation to the three size classes from the years 2006 and 2011 are displayed in Table 3. The relative length frequency-distribution is given for each sampling month (Fig. 4) with a 0.5 mm resolution of larval standard length. The standard length (SL) of larvae caught in 2006 ranged from 2.51 to 12.62 mm with a mean SL of 5.95 (± 2.02) mm. In 2011, minimum SL of cod larvae was 2.97 mm extending to a maximum of 14.5 mm with a mean of 5.93 (± 1.41) mm. Between the years, the proportion of the defined size classes (sc1: <4.5mm, sc2: 4.5 – 6 mm; sc3: >6mm) in the order sc1, sc2 and sc3 contributing to the total number of cod larvae was 28%, 34% and 38% in 2006 and 11%, 49% and 40% in 2011.
The mean SL of cod larvae during the first sampling month of the respective years were 4.46 (±
0.51) mm in April 2006 and 4.73 (± 0.58) mm in March 2011. In April 2006, the proportion of larvae in the size classes 1, 2 and 3 was 73%, 20% and 7%. For the same size groups, March 2011 showed following proportions: 27%, 73% and 0%. Throughout the year 2006 the mean SL of Baltic cod larvae increased up to 7.42 (± 2.59) mm in November. At that time, the contribution of larvae to the different size classes showed a shift from smaller to bigger larvae (sc1: 19%, sc2: 19% and sc3: 62%). In 2011, mean standard length of cod larvae increased to 7.22 (± 2.52) mm in November with 0%, 42% and 58% for the size classes 1, 2 and 3. The year 2011 was characterized by decreasing rates of sc2 (May: 69%, June: 55%, August: 45% and November: 42%) and increasing proportion of sc3 (May: 12%, June: 21%, August: 48% and
________________________________________________________________________ Results
21 November: 58%). In both years statistical tests showed no bimodal distribution of larval standard length over the year (all p>0.05).
Table 3: Mean (±sd) of Baltic cod larval standard length (mm) and sample number (N) in each sampling month in 2006 and 2011. Cod larvae are considered both independent of size classes and in relation to size class 1, 2 and 3 (<4.5, 4.5 – 6 and >6 mm respectively). NA = not available. (Note: The numbers (N) of presented Baltic cod larvae originate from samples collected for biochemical analyses.)
Year month Size class Mean ± sd N Year month Size class Mean ± sd N 2006 all all sizes 5.95 ± 2.02 187 2011 all all sizes 5.92 ± 1.41 944
1 4.07 ± 0.42 52 1 4.16 ± 0.29 102
2 5.14 ± 0.45 64 2 5.21 ± 0.40 461
3 8.07 ± 1.68 71 3 7.27 ± 1.19 381
April all sizes 4.46 ± 0.51 15 March all sizes 4.73 ± 0.58 11
1 4.26 ± 0.16 11 1 3.93 ± 0.42 3
2 4.63 ± 0.01 3 2 5.04 ± 0.23 8
3 NA 1 3 NA 0
June all sizes 6.16 ± 2.38 57 May all sizes 5.17 ± 0.82 106
1 3.90 ± 0.53 15 1 4.19 ± 0.26 20
2 5.18 ± 0.48 21 2 5.17 ± 0.38 73
3 8.77 ±1.85 21 3 6.73± 0.85 13
July all sizes 5.73 ± 1.54 94 June all sizes 5.31 ± 1.33 128
1 4.06 ± 0.41 22 1 4.13 ± 0.28 31
2 5.14 ± 0.40 36 2 4.98 ± 0.34 70
3 7.36 ± 1.08 36 3 7.57 ± 1.01 27
November all sizes 7.42 ± 2.59 21 August all sizes 6.10 ± 1.29 656
1 4.32 ± 0.19 4 1 4.19 ± 0.30 48
2 5.29 ± 0.69 4 2 5.27 ± 0.41 292
3 9.04 ± 1.88 13 3 7.17 ± 0.98 316
November all sizes 7.21 ± 2.52 43
1 NA 0
2 5.32 ± 0.28 18 3 8.59 ± 2.53 25
________________________________________________________________________ Results
22 Fig. 4: Length-frequency distribution (%) of Baltic cod larvae caught in the Bornholm Basin over the sampling months in 2006 and 2011. (Note: The numbers (N) of presented Baltic cod larvae originate only from samples collected for biochemical analyses.)
________________________________________________________________________ Results
23 4.2 Nutritional condition of Baltic cod larvae (standardized R/D ratios)
In the following, the results of standardized R/D ratios (sRD) in the years 2006 and 2011 are presented. Individual data on sRD ratios of Baltic cod larvae between the years of interest are shown in Fig. 5. Mean sRDs of all size classes and of the three functional size groups for different months over the two spawning seasons are graphically displayed in Fig. 6. Information on monthly means and standard deviations are given in Table 4.
The results of a multi-factorial analysis of variance showed significant influence of the factors year, month and size class on the sRD ratio of Baltic cod (Table 7). Interactions between the predictors were shown between year and month and month and size class (p< 0.001 respectively;
Table 7).
Fig. 5: Individual data on standardized R/D ratios (sRD) over standard length (SL, mm) of Baltic cod larvae in 2006 (orange) and 2011 (grey).
Between the years 2006 and 2011 differences in the overall mean sRD were found (2.24 (± 0.55) and 2.39 (± 0.62), respectively). With increasing standard length (SL) of Baltic cod larvae the mean sRD ratio also increased and variances decreased. Both years showed differences in mean sRD between sampling months (Table 4).
________________________________________________________________________ Results
24 In 2006, overall highest mean sRD was found for June (Table 4, Fig. 6, left panel). The separation of cod larvae into three functional size groups presented a similar picture with each size class showing highest mean sRD during June. For larvae < 4.5 mm mean sRD was higher in the first two sampling months (April and June) than compared to the subsequent ones (Fig. 6c).
Size class 2 (sc2, 4.5 – 6mm) displayed decreasing mean sRD from June to November (Fig. 6e), while values for larvae > 6mm (sc3) presented similar mean sRD between July and November (Fig. 6g).
For the year 2011, highest mean sRD for all larvae and also for each individual size class was found in May (Table 4, Fig. 6, right panel). After the peak of highest nutritional condition in May 2011, larvae of sc1 displayed similarly lower mean sRD in June and August (Fig. 6e).
Larvae of sc2 and sc3 demonstrated overall lower mean sRD from June to November while the month August showed slightly higher values for sc2 and lower values for sc3 (Fig. 6f and h).
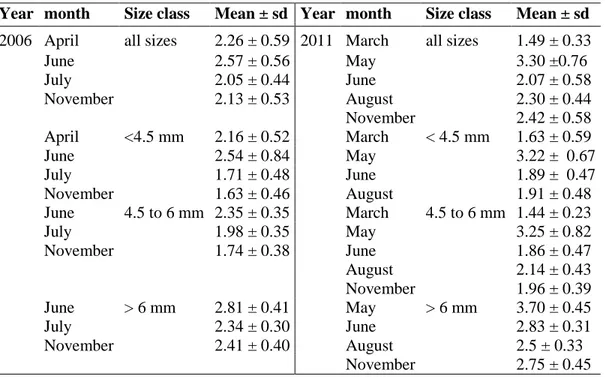
Table 4: Monthly means (±sd) of standardized R/D ratios of Eastern Baltic cod larvae in 2006 and 2011.
Year month Size class Mean ± sd Year month Size class Mean ± sd 2006 April all sizes 2.26 ± 0.59 2011 March all sizes 1.49 ± 0.33
June 2.57 ± 0.56 May 3.30 ±0.76
July 2.05 ± 0.44 June 2.07 ± 0.58
November 2.13 ± 0.53 August 2.30 ± 0.44
November 2.42 ± 0.58 April <4.5 mm 2.16 ± 0.52 March < 4.5 mm 1.63 ± 0.59
June 2.54 ± 0.84 May 3.22 ± 0.67
July 1.71 ± 0.48 June 1.89 ± 0.47
November 1.63 ± 0.46 August 1.91 ± 0.48
June 4.5 to 6 mm 2.35 ± 0.35 March 4.5 to 6 mm 1.44 ± 0.23
July 1.98 ± 0.35 May 3.25 ± 0.82
November 1.74 ± 0.38 June 1.86 ± 0.47
August 2.14 ± 0.43
November 1.96 ± 0.39 June > 6 mm 2.81 ± 0.41 May > 6 mm 3.70 ± 0.45
July 2.34 ± 0.30 June 2.83 ± 0.31
November 2.41 ± 0.40 August 2.5 ± 0.33
November 2.75 ± 0.45
________________________________________________________________________ Results
25 Fig. 6: Standardized R/D (sRD) ratios of Baltic cod larvae sampled in the Bornholm Basin in the course of the spawning seasons 2006 and 2011. Bar charts represent the mean (±sd) of all larvae independent of size class (a & b), size class 1 (c & d), size class 2 (e & f), and size class 3 (g & h). The sample sizes (N) for each year and month are presented in the respective bar charts. All N < 4 were excluded from the analyses.
________________________________________________________________________ Results
26 4.3 Hydrographical profiles at representative stations in the years 2006 and 2011
The determination of size-dependent temperature values for the calculation of larval growth rates was based on CTD data at respective sampling stations. Representative stations within the Bornholm Basin are given for each month of the investigated years 2006 and 2011 in Fig. 7.
In both years, salinity increased in depths mainly around 50 m (Fig. 7 a-i) and a year-round halocline was observed. Water masses in the first sampling month in 2011 (March 2011, Fig. 7e) displayed evenly distributed temperatures within the water body above the halocline. With proceeding season, the development of a thermocline around a depth of 20 m could be observed (April 2006, Fig. 7a; May 2011, Fig. 7f). Hydrographical profiles in the latest sampling month November presented a reduction of the thermocline and a more homogenous distribution of temperature (Fig. 7d and i). The initiation of mixing water masses later in the season, caused overall higher temperatures in intermediate depths.
Between the months, variations in temperature means could be observed for all depth ranges (Fig. 7a-i). Overall, temperature values for sc1 averaged over all stations (respective mean of 50- 70 m) were slightly higher 2006. Temperatures for sc2 (20-50 m) and sc3 (20-70 m) showed small variations from the earlier season until June in both years (Fig. 7a-b and e-g). Slightly increased temperatures in July 2006 almost doubled until the last sampling month in November (Fig. 7c and d). Warmer temperatures in August 2011 were only increased by around 1 °C in November (Fig. 7h-i).
________________________________________________________________________ Results
27 Fig. 7: Hydrographical profiles (temperature, salinity and oxygen) at representative sampling stations in the centre of the Bornholm Basin in the years 2006 (a-d) and 2011 (e-i).
________________________________________________________________________ Results
28 4.4 Specific growth rate of Baltic cod larvae
Results on individual and mean specific growth rates (SGRs) of all larvae and also in relation to different size classes are shown in Fig. 8, 9 and 10. Specific growth rate calculations are based on the multi-species model by Buckley et al. (2008). The values of mean specific growth rates (±
sd) are given in Table 5.
Between the years significant differences in specific growth rates were found (Fig. 8). With an average SGR of 1.69 (± 2.98) %·d-1 the year 2011 presented higher growth rates compared to 2006 (0.35 (± 2.37) %·d-1). Results of a multi-factorial ANOVA showed significant influences of the factors year, month and size class on the specific growth rate of Baltic cod larvae (Table 7).
Between the main factors, month and size class interacted most significantly (p<0.001), followed by the interaction of the factors year and month (p=0.008) and year and size class (p=0.009). No significant interaction between the three factors (year, month, size class) was found (p=0.2).
Fig. 8: Individual data on specific growth rates [% d-1] of Baltic cod larvae in the years 2006 (orange) and 2011 (grey). SGRs were calculated according to the multi-species model developed by Buckley et al.
(2008).
Overall, specific growth rates (SGR) in 2006 ranged from -0.45 (±1.75) to 3.49 (± 2.85) % increase in dry weight per day (Fig. 9a). For all larvae and also for the different size classes SGR was found to be highest in November (Fig. 9a-d). Larvae < 4.5 mm (sc1) displayed positive mean growth rates in April, June and November (Fig. 9b). Mean growth rates for size class 2
________________________________________________________________________ Results
29 only presented positive growth during November (Fig. 9c), while larvae > 6mm (sc3) showed positive mean specific growth rates in all analysed months (Fig. 9d).
During the season 2011 the overall mean SGR of Baltic cod larvae varied over the months resulting in values ranging from -4.33 (± 1.30) to 3.51 (± 2.47) %·d-1 (Fig. 10a). Considering all larvae independent of size, larval growth rates during November were found to be highest. For the different size classes, larvae of sc1 and sc2 showed highest mean SGR in May 2011 (Fig.
10b-c). Larvae belonging to sc1 presented positive mean growth rates only in May, while larvae of sc2 also presented positive growth in August and November. Considering larvae with a standard length > 6 mm (sc3), mean growth rates over the season 2011 were overall positive with highest mean SGR in November followed by the month May (Fig. 10d).
In order to demonstrate the influence on the outcome of specific growth rates of Baltic cod larvae, depending on the assigned temperature value put into the multi-species model, mean values of SGR for larvae sampled only with Multinets are shown in Fig. 10e-g. Vertically resolved samples allowed for calculations of temperature means over 5m depth intervals and a direct association to larvae sampled at respective depths. Fig. 10e shows mean SGRs of Baltic cod larvae < 4.5 mm ranging from -1.51 (± 1.94) to 4.57 (± 2.97) %·d-1. While May presented highest average SGR, also mean growth rates in August were positive (4.13 (± 2.77) %·d-1).
Except for mean SGRs in June and August being slightly smaller, mean specific growth rates of size class 2 and 3 in May increased when the more precise temperature means from the MN hauls were used (Fig. 10f and g). SGRs in May were highest with an average value of 5.65 (±
3.91) and 11.67 (± 4.74) %·d-1, respectively. Specific growth rates in June were on average -1.93 (±1.57) for sc2 and 0.33 (±1.06) %·d-1 for sc3.
________________________________________________________________________ Results
30 Fig. 9: Mean specific growth rates (SGR, % ·d-1, ±sd) of Baltic cod larvae caught in 2006. SGR is given over the season and sample sizes (N) are shown above or below the respective bar chart. Bar charts represent the mean SGR of all size classes (a), size class 1 (b), size class 2 (c) and size class 3 (d).
________________________________________________________________________ Results
31 Fig. 10: Mean specific growth rates (SGR, %·d-1, ±sd) of Baltic cod larvae caught in 2011. SGR is given over the season and sample sizes (N) are shown above or below the respective bar chart. Bar charts represent the mean SGR of all size classes (a), size class 1 (b), size class 2 (c) and size class 3 (d).
Additional plots (e-g) represent the mean SGR (±sd) of Baltic cod larvae originating only from Multinet hauls using temperature of 5m depth intervals. (Note: Scaling of the y-axis of Fig. 10f and g differs from the other plots.)
________________________________________________________________________ Results
32 Table 5: Monthly means (±sd) of specific growth rate in %·d-1 of Baltic cod larvae. Respective values are given for all sizes, size class1, 2 and 3.
Year month Size class Mean ± sd Year month Size class Mean ± sd
2006 all all sizes 0.35 ± 2.37 2011 all all sizes 1.69 ± 2.98
April - 0.26 ± 2.38 March - 4.33 ± 1.30
June 0.66 ± 2.09 May 2.62 ± 2.56
July - 0.45 ± 1.74 June - 0.91 ± 1.94
November 3.49 ± 2.85 August 2.02 ± 2.86
November 3.51 ± 2.47
April <4.5 mm 0.22 ± 2.47 March < 4.5 mm - 2.84± 1.77
June 0.95 ± 3.41 May 1.87 ± 1.88
July - 1.33 ± 2.04 June - 1.84 ± 1.45
November 1.38 ± 4.08 August - 0.76 ± 1.87
June 4.5 to 6 mm - 0.20 ± 1.19 March 4.5 to 6 mm - 4.90 ± 0.44
July - 0.89 ± 1.35 May 2.67 ± 2.79
November 1.58 ± 2.35 June - 1.45 ± 1.59
August 1.89 ± 3.21
November 1.68 ± 2.06
June > 6 mm 1.30 ± 1.20 May > 6 mm 3.76 ± 1.64
July 0.54 ± 1.44 June 1.57 ± 1.06
November 4.73 ± 1.91 August 2.58 ± 2.34
November 4.83 ± 1.83
________________________________________________________________________ Results
33 4.5 Growth performance of Baltic cod larvae
In order to ecologically evaluate the specific growth rates (SGRs) of Baltic cod larvae, individual data of observed growth rates were compared to reference growth rates (Gref) of Atlantic cod (Gadus morhua), predicted by the size-temperature-dependent growth model (STDG model) developed by Folkvord (2005), and resulting in the so-called growth performance (Gpf).
Mean growth performance and the standard deviation for the different years and months are given in Table 6. Fig. 11-14 present the comparison between SGR and Gref and the consequent Gpf for I) the years 2006, 2007 (only August) and 2011 and II) for months with highest nutritional condition (sRD) in 2006 and 2011 and highest sample size in August 2011. Results of a multi-factorial analysis of variance displayed significant influence of the factors year and month on the growth performance of Baltic cod larvae (Table 7). The observed growth of Eastern Baltic cod larvae in 2006, 2007 and 2011 showed deviations from the predicted maximum growth rates, with Gref presenting overall higher growth rates than actually achieved by cod larvae from the Bornholm Basin (Fig. 11, Fig. 13),. In 2006 and 2007 differences were more pronounced than in 2011 (Fig. 11) resulting in growth performances of Baltic cod larvae mainly ranging from -1.03 to 0.58 in 2006, -0.45 to 0.50 in 2007 (only August) and -0.68 to 1.86 over the year 2011 (Fig. 12). The year 2011 displayed highest mean Gpf of Baltic cod larvae over the season.
Considering the presented months, June 2006 showed strongest differences between the predicted and observed growth rates (Fig. 13a and d). The months May and August 2011 showed higher approximation between SGR and Gref (Fig. 12b and e; c and f). In June 2006 the percentage of larvae with Gpf <0, from 0 to 0.5 and >0.5 was 29%, 71% and 0% respectively (Fig. 14). May 2011 showed highest proportion of larvae with a Gpf >0.5 (6%, 28% and 66% for Gpf <0, 0 to 0.5 and >0.5, respectively). Larvae with a growth performance from 0 to 0.5 were most dominant in August 2011 (12%, 72% and 16% for Gpf <0, 0 to 0.5 and >0.5, respectively).
The illustration of growth performance of Baltic cod larvae showed highest variances for larvae with a dry weight up to about 125 µg (Fig. 12, Fig. 14). The mean Gpf between the size classes 2 and 3 displayed higher mean values for larvae > 6mm.
________________________________________________________________________ Results
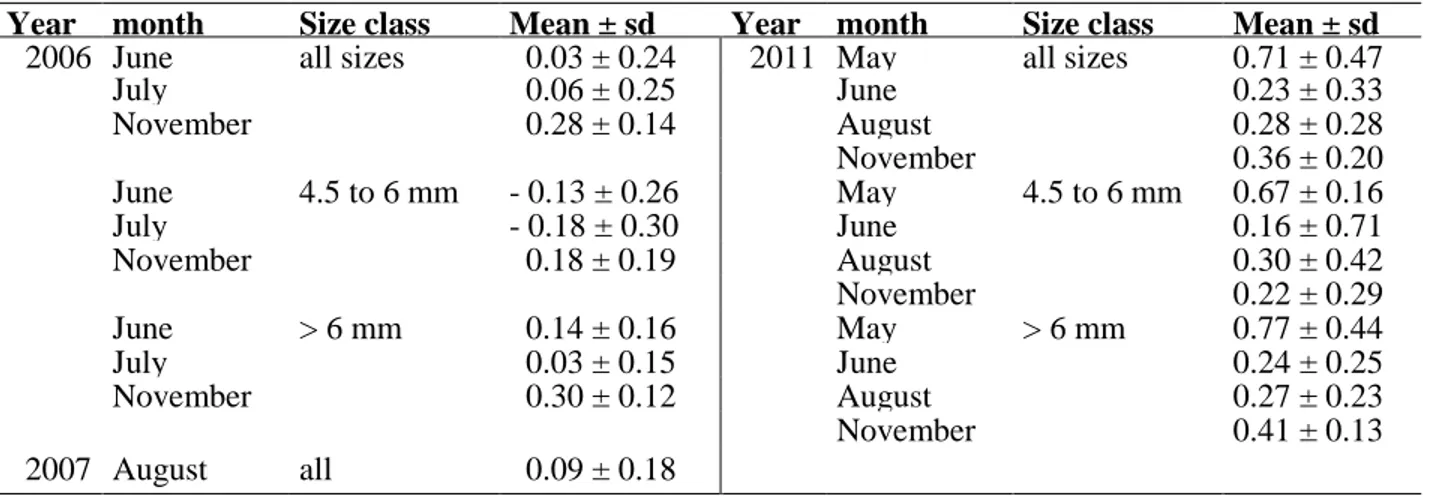
34 Table 6: Monthly means (±sd) of growth performance (Gpf, dimensionless) of Baltic cod larvae (Gadus morhua) in 2006, August 2007 and 2011. By multiplying the Gpf with 100 one would obtain the percentage of actual growth realized by larvae in relation to the reference growth rate (Gref) predicted by the literature for larvae growing at maximum rates at given size and temperature.
Table 7: Summary of outcome of the multifactorial analyses of variance for the standardized R/D (sRD), specific growth rate (SGR), and growth performance (Gpf) of cod larvae.
factor Df F value P
sRD year 1 14.60 < 0.001***
month 6 76.65 < 0.001***
size class 2 172.45 < 0.001***
year*month 1 29.43 < 0.001***
year*size class 2 0.18 0.8 (n.s.)
month*size class 11 4.90 < 0.001***
year*month*size class 1 2.78 0.1 (n.s)
SGR year 1 43.91 < 0.001***
month 6 98.99 < 0.001***
size class 2 84.78 < 0.001***
year*month 1 6.98 0.008**
year*size class 2 4.69 0.009**
month*size class 11 7.97 < 0.001***
year*month*size class 1 1.70 0.2 (n.s.)
Gpf year 2 41.34 <0.001***
month 5 16.51 <0.001***
size class 2 1.94 0.1 (n.s.)
year*month 1 0.82 0.4 (n.s.)
year*size class 1 0.25 0.6 (n.s.)
month*size class 4 1.87 0.1(n.s.)
year*month*size class 1 0.53 0.5 (n.s.)
Year month Size class Mean ± sd Year month Size class Mean ± sd 2006 June all sizes 0.03 ± 0.24 2011 May all sizes 0.71 ± 0.47
July 0.06 ± 0.25 June 0.23 ± 0.33
November 0.28 ± 0.14 August 0.28 ± 0.28
November 0.36 ± 0.20
June 4.5 to 6 mm - 0.13 ± 0.26 May 4.5 to 6 mm 0.67 ± 0.16
July - 0.18 ± 0.30 June 0.16 ± 0.71
November 0.18 ± 0.19 August 0.30 ± 0.42
November 0.22 ± 0.29
June > 6 mm 0.14 ± 0.16 May > 6 mm 0.77 ± 0.44
July 0.03 ± 0.15 June 0.24 ± 0.25
November 0.30 ± 0.12 August 0.27 ± 0.23
November 0.41 ± 0.13
2007 August all 0.09 ± 0.18
________________________________________________________________________ Results
35 Fig. 11: Observed specific growth rates (SGR) of individual Baltic cod larvae (black circles) and predicted growth rates for larvae growing at maximum potential (grey triangles) plotted over dry weight (µg) for the years 2006, 2007 and 2011. Predicted growth rates were estimated using the STDG model by Folkvord (2005) with given larval dry weights and temperatures of the Baltic cod larvae analysed in this thesis. Larvae with a DW <30 µg were excluded from the analyses, as coverage by the STDG model is not given. Also modeled reference growth rates with negative values and the respective SGRs were ignored.


![Fig. 8: Individual data on specific growth rates [% d -1 ] of Baltic cod larvae in the years 2006 (orange) and 2011 (grey)](https://thumb-eu.123doks.com/thumbv2/1library_info/5348066.1682512/31.918.253.669.525.817/individual-specific-growth-rates-baltic-larvae-years-orange.webp)