To appear in: Tectonophysics Received date: 1 February 2016 Revised date: 2 March 2017 Accepted date: 3 March 2017
Please cite this article as: Fromm, Tanja, Jokat, Wilfried, Behrmann, Jan H., Interaction between a hotspot and a fracture zone: The crustal structure of Walvis Ridge at 6 E, Tectonophysics(2017), doi: 10.1016/j.tecto.2017.03.001
This is a PDF file of an unedited manuscript that has been accepted for publication.
As a service to our customers we are providing this early version of the manuscript.
The manuscript will undergo copyediting, typesetting, and review of the resulting proof before it is published in its final form. Please note that during the production process errors may be discovered which could affect the content, and all legal disclaimers that apply to the journal pertain.
ACCEPTED MANUSCRIPT
Interaction between a hotspot and a fracture zone: The crustal structure of Walvis Ridge at 6 ° E
Tanja Fromm1∗, Wilfried Jokat1and Jan H. Behrmann2
1 Alfred-Wegener-Institut f¨ur Polar- und Meeresforschung, Am Alten Hafen 26, D-27568 Bremerhaven, Germany
2GEOMAR, Helmholtz Centre for Ocean Research Kiel, Wischhofstr. 1-3, D-24148 Kiel, Germany
∗ corresponding author, E-mail: Tanja.Fromm@awi.de
Abstract
The Walvis Ridge is one of the major hotspot trails in the South Atlantic and a classical example for volcanic island chains. Two models compete about the origin of the ridge:
It is either the result of a deep mantle plume or active fracture zones above mantle inhomogeneities. Among other things crustal information is needed to constrain the models. Here, we provide such constraint with a 480 km long P-wave velocity model of the deep crustal structure of the eastern Walvis Ridge at 6°E. According to our data the Walvis Ridge stretches across the Florianopolis Fracture Zone into the Angola Basin.
Here, we observe a basement high and thick basaltic layers covering the oceanic crust and the fracture zone. We found two crustal roots along the profile: one is located beneath the ridge crest, the other one beneath the northern basement high in the Angola Basin. The crustal thickness reaches 18 km and 12 km and the lower crustal velocities are 7.2 km/s and 7.4 km/s, respectively. The bathymetric expression of the ridge along the profile is less pronounced than closer to shore, which is mainly attributable to the absence of a thick layer of volcanic debris, rather than to reduced crustal thickness below the basement surface. Therefore, this part of the ridge was never or only briefly subaerially exposed. The crustal structure suggests that the ridge and the fracture zone formed independently of each other. The oceanic crust north of the fracture zone, which is buried underneath the basalt layer, is younger than the reconstructed age of hotspot volcanism of the Walvis Ridge. We interpret these structures north of the fracture zone to be at least partly a product of late stage volcanism.
1. Introduction
Worldwide, volcanic activity appears at hotspots along ocean island chains far from plate boundaries. The underlying processes within the Earth’ mantle are still discussed and two models compete to explain the source for the volcanism: either a deep mantle plume (Morgan, 1971) or tectonic stress release at fertile areas in the inhomogeneous upper mantle (e.g. Anderson, 2005).
ACCEPTED MANUSCRIPT
The Walvis Ridge is one of the most striking bathymetric features of the South Atlantic and a classical example for a volcanic hotspot trail (Fig. 1). This volcanic ridge rises more than 2000 m above the surrounding seafloor and stretches SW away from the African continent for over 3000 km to the islands of Tristan da Cunha and Gough near the Mid-Atlantic Ridge. The eastern part of the ridge (east of 3°E) is a continuous, massive structure, whereas the western part is a widely distributed guyot province with loosely connected ridges and scattered seamounts forming a frayed lineament. The entire ridge shows a linear age-progression (O’Connor and Duncan, 1990; Rohde et al., 2012) starting with Cretaceous volcanism at its junction with the African continental margin. The onset of this volcanism is interpreted to be closely connected with the opening of the South Atlantic and the emplacement of continental flood basalts at ∼132 Ma (Renne et al., 1996; Fromm et al., 2015).
The conjugate South American plate shows corresponding volcanic features, although a massive, elongated ridge like the Walvis Ridge is missing and the volcanic structures have a different shape. The Torres Arch (Fig. 1) is the conjugate structure to the eastern Walvis Ridge and connected to the large Rio Grande Rise via an indistinct bathymetric high.
Both structures (Walvis Ridge and Rio Grande Rise) form conjugate trails of the present day Tristan hotspot (Morgan, 1971). The variable sizes and shapes of the volcanic provinces are explained with reference to the changing relative positions of the hotspot and the Mid-Atlantic Ridge (O’Connor and Duncan, 1990). According to these models the Torres Arch, Rio Grande Rise and the eastern Walvis Ridge formed when the hotspot was close to or at the Mid-Atlantic Ridge. Between 80 and 60 Ma, the Rio Grande Rise and its conjugate, the N-S oriented part of Walvis Ridge at 5°E, might have been large a igneous province similar to Iceland today. This section of Walvis Ridge lacks an age progression, implying that it developed as a product of large scale eruptions covering a broad region (O’Connor and Duncan, 1990). In contrast, the western seamount province of Walvis Ridge formed when the Tristan hotspot was well separated from the Mid-Atlantic Ridge. Therefore, no corresponding volcanism occurred on the South American plate.
However, some observations are not consistent with predictions of the plume model and alternative tectonic models for the origin of Walvis Ridge exist. Hotspots should form age progressive volcanic chains with active volcanism occurring only at or near the hotspot location. In contrast to this prediction, earthquake swarms in the western seamount province of Walvis Ridge have recently been interpreted as volcanogenic explosions (Haxel and Dziak, 2005). If so, the large distance to the hotspot location (∼780 km) requires either a much larger reach of the hotspot then expected or a different origin for this volcanism.
As an alternative, Fairhead and Wilson (2005) proposed that changes in intra-plate stress triggered the excess magmatism of the Walvis Ridge. In this model, fracture zones play an important role as they separate regions of contrasting stress fields and are locations of intra-plate stress release. The eastern Walvis Ridge is located directly south of the Florianopolis fracture zone (Fig. 1, FFZ; also referred to elsewhere as Rio Grande fracture zone, e.g. Cappelletti et al., 2013; Heine et al., 2013). The FFZ merges towards the west with the continental Paran´a-Chacos shear zone, a line of major deformation prior to and during the breakup (Moulin et al., 2010, and references therein). The FFZ might have had an extensional component during the initial opening, forming a short-lived spreading
ACCEPTED MANUSCRIPT
ridge with increased magmatism building the Walvis Ridge (Elliott et al., 2009).
The FFZ and the Walvis Ridge mark a major boundary between the volcanic and non-volcanic passive margins along the African continent. By contrast, numerous seismic studies have focused on the nature of the volcanic margins of South America and Africa (e.g. Becker et al., 2012, 2014; Hirsch et al., 2009; Bauer et al., 2000; Fromm et al., 2015), but despite their importance, seismic data revealing the crustal structure in this region are rare. Here, we present details of a seismic refraction profile (Fromm et al., 2015) acquired 600 km west of the Namibian coast that provides new information on the crustal fabric underlying a topographically subdued part of Walvis Ridge. One hypothesis to be checked was that the part of the ridge with a subdued topography might be underlain by thinner crust, thus indicating several phases of the ridge evolution. The seismic line also offers the opportunity to gain new insights into the origin of Walvis Ridge (with regard to the competing hypotheses), the evolution of the Tristan hotspot and the interplay of hotspots with fracture zones. These results will be compared with a more easterly N-S line acquired across a topographically more pronounced part of the Walvis Ridge (Fig.
2, P3).
2. Seismic data
The acquired seismic refraction data are part of a larger geophysical experiment conducted by the Alfred Wegener Institute, (AWI) in January 2011 with the research vessel Maria S.
Merian (MSM 17/2) in cooperation with Geomar, Kiel and the GeoforschungsZentrum, Potsdam (GFZ). Multidisciplinary studies in this experiment, including seismological and magnetotelluric experiments, investigated the junction of Walvis Ridge and the African continent both with ocean bottom seismometers and recording stations onshore Namibia (e.g. Heit et al., 2015; Jegen et al., 2016).
In this study, we present the results of the seismic profile P150 that crosses Walvis Ridge in a NW-SE direction at 6°E,∼600 km off the Namibian coast (Fig. 2). Here, the ridge forms a bathymetric saddle 1000 m deeper than at the western end of P100, 200 km closer to the coast (Fig. 2). Along the profile P150 the ridge is wider and the flanks are gentler than at P3 (Fig. 2). Furthermore, the FFZ marking the northern escarpment of the ridge east of 7°E is not visible along the line. The profile extends 480 km across the ridge and into the interiors of the adjacent ocean basins. In total, 29 ocean bottom stations equipped with hydrophones (OBH) were deployed at a nominal spacing of ∼13 km. Two OBH did not record any data. The data were sampled at either 200 or 250 Hz. The seismic source consisted of 8×8l (64l or 3905 cu in in total) G-gun clusters operated at 200 bar (2900 psi) in 8 m depth. A shooting interval of 90 s resulted in 230 m mean shot spacing. Simultaneously, we acquired reflection data with a short (300 m), four channel streamer at 1000 Hz sample rate to map the sediment thickness and basement topography.
We filtered the refraction data with a bandpass of 3.5-13 Hz and applied an automatic gain control (AGC, 1 s window). Occasionally, we used higher frequencies, especially for sediment reflections, which were clearer at frequencies of up to 100 Hz. Arrival times were picked with the software ZP (Zelt, 2004). In general the data quality is excellent. Almost all stations show continuous crustal refractions, crust-mantle reflections (PmP-phases) and a few mantle refractions (Pn-phases) at offsets up to 100 km. A strong basement reflector is clearly visible in both the OBHs and the streamer data. For stations located
ACCEPTED MANUSCRIPT
on the ridge crest, however, the basement is diffuse and its rough topography scatters the seismic energy. The seismic reflection data are displayed in Figure 3 and selected OBH data examples are shown in Figures 4–5.
3. Modelling
3.1. Seismic modelling
Before the initial model set up, the OBH stations needed to be relocated because ocean currents may displace the station while it sinks to the bottom with the result that its real position on the seafloor is slightly different from the deployment position. The shift along the profile line can be calculated from the direct arrivals. For a correctly located instrument they resemble a reflection hyperbola with its apex at zero. However if the station is misplaced along the profile line, the apex is shifted to the left or right. We picked the direct arrivals, computed a hyperbolic curve fit, and determined the in-line shift. The mean shift for all instruments was 160 m (maximum 600 m). Once relocation was complete, we projected the relocated stations onto a straight profile line without modifying the original shot-receiver offsets (Zelt and Smith, 1992).
The starting model was constrained by the bathymetry, sedimentary layers and the basement topography derived from the seismic reflection data. Because of the short streamer, we calculated velocities for the sediments using OBH data. Clear sediment reflections at the northern flank of the ridge were observed on both the streamer and OBH recordings and a standard velocity analysis using normal move outs (NMO) was carried out with the OBH data. The crustal structure was modelled with the ray-tracing software rayinvr (Zelt and Smith, 1992) mainly by forward modelling following a top to bottom approach. Velocities and boundaries were adjusted to match the observed slopes and onsets. Finally, we inverted the whole model to obtain error statistics and uncertainty estimates. The final model consists of 9 layers (Figs. 6, 7): layer 1 is the water, layer 2-4 represent the sediment layers based on the seismic reflection data (Figs.
3, 7), layers 5 and 6 are the upper crust, 7 middle crust, 8 lower crust and the mantle is layer 9. The top of layer 5 corresponds to the basement derived from the reflection data.
The model reveals thick crust beneath the ridge crest and a basement high north of the ridge. At the northern flank of the Walvis Ridge between those regions with thickened crust, we modelled a local low velocity zone between layer 5 and 6. More details on the velocities and crustal structure is given in section 4.
3.2. Error Analysis
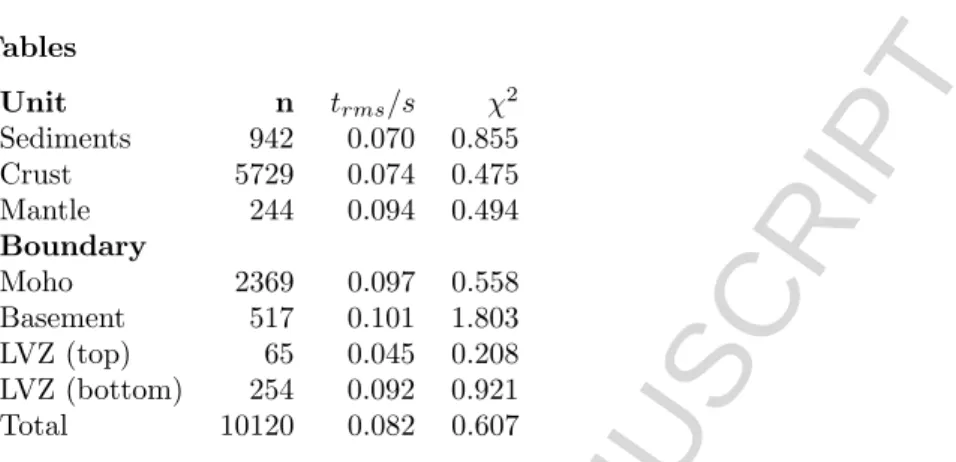
The model quality and uncertainty can be estimated from the normalized χ2-value and the travel time residuals. The normalizedχ2value depends on the assumed uncertainties for travel time picks, the residuals of calculated arrivals and the node distribution. Our final model has aχ2of 0.6 and is therefore well constrained within the given uncertainties ( the ideal value is 1). The travel time residuals of 82 ms are within the estimated pick uncertainties of 60 and 150 ms (depending on the signal to noise ratio). Table 1 summarizes the mathematical error analysis for the modelled phases and stations.
Additionally, we estimate the spatial uncertainty of the model with the ray coverage and the resolution plot (Figs. 8, 9). The resolution plot displays the diagonal values of the resolution matrix (values greater than 0.5 are considered well resolved) and reflects the
ACCEPTED MANUSCRIPT
number of data constraining a parameter. Therefore, the number and spacing of nodes strongly influence the results of this analysis. As shown in Figure 9, our model is well resolved, except for the low velocity zone (LVZ) at the northern flank of the ridge, where refracted phases needed to constrain velocities are missing.
Although the Moho topography is well constrained with a good coverage of PmP and deep refracted phases, the area below the LVZ at a depth of 14 km is more uncertain. In particular, the transition around the intersection with the FFZ (Fig. 6, around km 190) seems to be complex, displaying several intracrustal reflections, which we could not fit at all stations.
Finally, we tested the reliability of our model by perturbing velocity and depth nodes and found, that changes of±0.2 km/s and±2 km in the lower crust result in model variability within error bounds and so have to be considered as unresolved.
3.3. Gravity modelling
After the seismic modelling we derived a gravity model to confirm that the modelled crustal structure is consistent with observed gravity data. We used free air satellite data (Sandwell et al., 2014) and modelled the density structure with the software IGMAS (G¨otze and Lahmeyer, 1988).
First, we converted the P-wave velocity model to a density model using the empirical Nafe-Drake velocity-density correlation of Barton (1986) and Ludwig et al. (1970). We kept the model as simple as possible and merged sediment layers and layers with similar densities, which were not constrained by reflections. Seismically-constrained boundaries were not changed. Since the gravity modelling software accepts no density gradients, we devided the seismic layers into polygons accounting for lateral variations and assigned a density value reflecting the converted velocities. The difference in water depths of the Cape and Angola basins (1000 m) initially caused a large difference of the gravity anomaly level between the two ends of the profile. We added an additional upper crustal layer with a density of 2.17 cm3 in the Cape Basin, which resembles the upper oceanic crust with velocities of 2.8-2.9 km/s. Finally, we inverted the densities while keeping the polygon geometry to minimize the misfit. The maximum change of +0.15 g/cm3 was in the lower crust beneath the Walvis Ridge. All density changes fall within the range of the velocity-density correlation given by Barton (1986). Figure 10 shows the gravity anomaly data and the density model along the seismic line, which is discussed in detail in section 4.4.
4. Results and Interpretation
In this section we describe the final velocity model (Fig. 6) and interpret the observed velocities and structures (Fig. 11). Selected data examples with picked arrivals and ray-tracing results are displayed in Figures 4 and 5.
The seismic reflection data and the velocity model reveal the asymmetric morphology of the Walvis Ridge along the line: the northern flank of the edifice differs significantly from the southern flank. The wide, northern flank is characterized by a gentle dip towards a basement high at km 40-100 marking the transition to the Angolan Basin (Fig. 6). The bathymetry is mirrored by the crust-mantle topography (Moho) with thickened crust underneath the ridge crest (∼18 km) and the northern basement high
ACCEPTED MANUSCRIPT
(∼12 km). Therefore, we divide the profile into the main ridge section around the peak from km 250 to 360, which resembles the continuation of the Walvis Ridge, and the northern edifice (km 20-250) that has an atypical crustal structure and is in an area not classically recognized as a part of Walvis Ridge based on bathymetry (Fig. 1). Both ends of the profile, in the Angola and Cape Basins (km 0–20 and 400–480), show typical velocity-depth functions of oceanic crust as described by White et al. (1992).
4.1. Sedimentary layers
Based on the seismic reflection data, we modelled three sedimentary layers with a maximum thickness of 1.2 km in the Cape Basin and velocities varying between 1.6 and 3.1 km/s. The two upper layers have been modelled with constant velocities of 1.6 and 1.9 km/s and represent unconsolidated deep-sea sediments. The third sediment layer is laterally variable and represents different types of sedimentary infills. It disappears completely at basement highs and velocities ranging between 2.4 and 3.1 km/s. Within this layer, sediments with the highest velocities of 3.1 km/s fill a basement depression at the northern edifice of the ridge (km 100-150, Fig. 3), while sediments with the lower velocities of 2.4 km/s overlay the oceanic crust in the Cape Basin.
4.2. The crustal architecture
Crustal velocities in the Cape Basin resemble those typical of oceanic crust: The upper 0.5 km thick layer 5 with velocities of 2.8 km/s is therefore likely to consist of pillow basalts, followed by a layer of sheeted dikes with velocities of 5.0–6.2 km/s and gabbro in the lower crust (velocities of 6.6 to 7.2 km/s). The total thickness of the igneous crust is 7.4 km, which is normal for 59–127Ma old oceanic crust (White et al., 1992).
The upper crustal velocity of 2.8 km/s is remarkable. Such a velocity is in the range of oceanic Layer 2A, but unusually slow for a 59–127 Ma old oceanic crust (White et al., 1992). It is possible that we miss-interpreted the S-wave of layer 6 (vp=5.0km/s ⇒ vs=2.88 km/s) as the refracted P-wave of layer 5. But the model is inconsistent with a velocity of 5.0 km/s in layer 5 and requires slower velocities beneath the basement. Such layers are known as hidden layers and a common problem in seismic refraction data.
However, gravity modelling supports the existence of a low density/low velocity layer in the upper crust of the Cape Basin. Sediments could be mixed with pillow basalts and reduce the seismic velocity to 2.8 km/s.
The thickness of the oceanic crust north of the ridge in the Angola Basin is not as well constrained. Since the experiment design did not anticipate the anomalous crust extending that far, no station was placed on normal oceanic crust. Only the far offsets of the northernmost station cover this region. However, Moho reflections constrain the crustal thickness of 7.2 km. Here, crustal velocities range from 5.2 km/s in the upper crust to 7.4 km/s at the Moho. The lower crustal velocity is higher than for normal oceanic crust but this should not be over interpreted due to the sparse data coverage and missing reversed shots.
4.2.1. The ridge crest
The rough basement at the ridge crest (km 250 to 300) is only defined by a weak, discontinuous reflector indicating a small velocity contrast between the basement rocks and the overlying material (Fig. 3). Additionally, a few seamounts disrupt the basement
ACCEPTED MANUSCRIPT
topography at km 250, 270 and 300. Upper crustal velocities at the ridge range between 4.4 and 5.6 km/s and display moderate lateral heterogeneities. Seismic velocities can be an indicator for the water depth of volcanic eruptions. Deep water is suggested by the absence of large amounts of volcaniclastic material (velocities less than 4.0 km/s, Hill and Zucca, 1987), which result fromn explosive eruptions near the water surface as observed around many seamounts and volcanic islands e.g. Louisville, the Marquesas or Canary Islands (Contreras-Reyes et al., 2010; Wolfe et al., 1994; Watts et al., 2006). Thus, we speculate that this part of Walvis Ridge was never or only briefly near or at the surface during its active volcanic phase. The mid- and lower crustal velocities range between 6.2 and 7.2 km/s. Such velocities are typical of the gabbroic layer of igneous crust. The main ridge is not characterized by the exceptionally high velocities (>7.2 km/s) occasionally observed at other hot spot trails (e.g. the Ninetyeast Ridge, Grevemeyer et al., 2001) or under the Walvis Ridge more close to the Namibian margin (Fromm et al., 2015).
4.2.2. The northern edifice
The northern flank of the ridge (km 100–250) between the crest and the basement high is characterized by a strong and smooth basement reflector and elevated seismic velocities (5.1–5.6 km/s) in the upper crust (layer 5). Such basement velocities are typical of basalts, although too high for the pillow basalts seen in normal oceanic crust. The underlying layer 6 is characterized by slightly lower velocities of 5.4 km/s. Low velocity zones (LVZ) generate no refracted waves and cause a time gap in the travel time curve, which is observed at all 11 OBHs along the northern flank. The thickness of this LVZ increases towards the ridge crest, where we observe a maximum time gap of 600 ms corresponding to 3.5 km thickness (Fig. 7, km 240). Within this layer 5, we observe a sequence of strong reflections with the same or slightly stronger move out (Fig. 5).
This reflection pattern might be caused by an alternating layering of basaltic rocks and sediments, volcaniclastic material or pillow lavas (Inoue et al., 2008), which can amplify amplitudes for certain frequencies due to constructive wave interference (Braile and Smith, 1975). We therefore interpret the upper crust as an inter-layered basalt-sediment sequence. Velocities of 6.2-7.2 km/s characterize the ∼5.6 km thick middle and lower crust beneath the northern ridge flank (layer 7 and 8, Fig. 6). The thickness and shallow velocity gradient indicate gabbroic material of oceanic crust. We therefore interpret the crust beneath the LVZ (km 100 - 230) as oceanic crust that pre-dates the activity of the hotspot in this region. Within this pre-hotspot crust we observe slightly lower velocities (6.1-7.0 km/s) at km 200 and a modest decrease in Moho depth (∼2 km). This is the position where the Florianopolis Fracture Zone (FFZ) intersects the profile and we interpret this structural change as indicating the effects of the fracture zone. To sum up, we interpret the northern flank to consist of a thick lava-sediment layer (possibly lava flows) covering older oceanic crust and the FFZ.
4.3. Mantle
The mantle seems to be homogeneous with a constant velocity of 8.0 km/s, which is common for oceanic lithosphere (White et al., 1992). Although the Walvis Ridge is derived from melting within the mantle, we do not observe any velocity variations or anisotropy beneath the ridge. This result might be biased by the few Pn arrivals, which are visible in the data.
ACCEPTED MANUSCRIPT
4.4. Density model
The free air anomaly values vary from -18 mGal to +25 mGal along the profile (Fig. 10).
The minimum is located south east of the crustal root of the Walvis Ridge. The northern basement high, the northern flank and the ridge crest (km 40-340) are characterized by positive anomalies of 10, 23, and 25 mGal with a local minimum at km 190, where the free air anomaly drops from 23 to 6 mGal. Here, the FFZ intersects the profile and the model reveals a LVZ (Fig. 12) with decreased seismic velocities and reduced densities in the upper and lower crust (Fig. 10).
Overall, we obtain a good long wavelength fit, with deviations of 5 mGal. Misfits reach
±5 mGal at the northern flank of the ridge (km 50 to 190), where we observed the low velocity zone. The shorter wavelength misfits in this region reach up to 10 mGal, especially at the ridge crest (km 220 to 290). The basement topography has a large influence on the modelled gravity anomalies and we suggest that the poorly constrained geometry from the reflection seismic data is responsible for the large misfit.
Seismic velocities in the lower crust beneath the ridge (km 270-370, 7.2 km/s) are slightly decreased compared to the basement high (km 50 to 100, 7.5 km/s). This is consistent with the modelled densities of 3.005 cm3 beneath the ridge and 3.033 cm3 beneath the basement high (Fig. 10).
Overall, the gravity modelling confirms the crustal structure of the seismic model, with high misfits only in areas of poor seismic resolution. Because we do not have more constraints we chose not to fit those areas by changing the model geometry.
5. Discussion
In this section we compare the crustal structure modelled in profile P150 with seismic data at other profiles along the Walvis Ridge and other hotspot trails. The first two parts of the discussion are limited to the crustal structure beneath the main ridge. The structures north of the FFZ are discussed in the geodynamic framework and, last, the FFZ and its interplay with the hotspot is analysed.
5.1. The Walvis Ridge and hotspot tracks worldwide
The morphology of Walvis Ridge at the profile location is less prominent than closer to shore. The water depth at the ridge crest is 3200 m, about 1000 m deeper than at the western end of P100 (Fig. 2). However, a comparison of the basement depth at the ridge crest (km 300) with the western end of P100, 200 km away, does not reveal a significant change in depth (Fromm et al., 2015). The basement at P100 is in 4.4 km depth, while the basement at P150 lies at 4.0 km. The difference in water depth is therefore caused by variations in the sedimentary cover. Drilling at the eastern Walvis Ridge (DSDP Leg 40, Site 363, Fig. 2) revealed shallow water components in the lowermost layer indicating that this part of the ridge was emplaced subaerially or in shallow water (Bolli et al., 1978).
Phreatic eruptions under such conditions produce volcaniclastic material, which likely accumulated in moats between the buried seamounts along line P100. As such materials appear from the seismic data to be absent along profile P150, the different bathymetric appearance of the ridge might be explained by a contrasting eruption style that is related to water depth: deeper submarine eruptions along P150 might have generated a less pronounced bathymetric feature. Beneath the sedimentary cover, the crustal thickness
ACCEPTED MANUSCRIPT
only differs slightly outside the model uncertainty: 21 km ±2 km at 9°E (P100, Fromm et al., 2015) and 18 km±2 km at 6°E (this study). Jokat and Reents (2016) observed a more pronounced decrease in crustal thickness, to 13 km in the western guyot province at 3°W,∼1800 km further SW. This crustal thinning is consistent with a proposed general decline in the hotspot activity (Gallagher and Hawkesworth, 1994).
A comparison of the crustal velocity-depth function at Walvis Ridge with other hotspot trails reveals strong differences in crustal thickness and seismic velocities, but a common shape, with a steep velocity gradient in the upper crust and a shallow gradient in the lower crust (Fig. 13). This is similar to the crustal structure of normal oceanic crust.
The steep upper crustal gradient relates to the pillow basalt layer, where compaction with depth causes increasing velocities, whereas the shallow lower crustal gradient reflects the presence of more compact gabbros (White et al., 1992). The increased crustal thickness of the Walvis Ridge is achieved by thickening in both the upper and lower crust. In contrast, other hotspot trails (namely the Ninetyeast Ridge and the Cocos Ridge Grevemeyer et al., 2001; Sallar`es et al., 2003) only reveal a thickened lower crust beneath an upper crust of normal thickness.
5.2. Lower crustal structure
Another significant difference between the individual hotspot trails is the presence or absence of high seismic velocities in the lower crust. The seismic velocity and thickness of lower crustal zones in igneous settings allows conclusions to be drawn about mantle potential temperature and melt composition (Holbrook et al., 2001). Unusually thick crust requires unusually high melt production in the mantle. If this is caused by abnormally hot mantle, the melts produced will be rich in MgO and will crystallize abundant olivine and pyroxene to form crust with higher average velocities than at normal upper mantle temperatures (Farnetani et al., 1996). However, thick igneous crust can be produced by other means (hydrous mantle, enhanced convection) and high seismic velocities are not ubiquitous at hotspot trails. For example, HVLC is absent at the Galapagos trail (Cocos and Carnegie Ridge) and the Iceland-Faroe Ridge, whereas the Ninetyeast Ridge and Hawaii are both underlain by high velocity lower crustal bodies (Sallar`es et al., 2003, 2005; Grevemeyer et al., 2001; Watts and ten Brink, 1989). Importantly, the production of HVLC can also be related to the depth of initial melting and thus to the lithospheric thickness and age at the time of its interaction with the hotspot. (Richards et al., 2013) showed that high-pressure melting under thick and old lithosphere promotes the formation of dense ultramafic melts that pond and crystallize at the Moho with Vp =7.4 to 8.0 km/s), whereas melts produced under thin and young lithosphere produce gabbroic rocks with velocities of 6.8 to 7.5 km/s.
The Walvis Ridge in general seems not to be characterized by exceptionally high seismic velocities in the lower crust (this study, P100 west, Kessling, 2008). HVLC at the Walvis Ridge has only been found close to the continental margin in association with the Etendeka flood basalt province and probably formed during the continental breakup (P100, P3, Fromm et al., 2015; Planert et al., 2016). The ages of the Walvis Ridge and oceanic lithosphere east of 6°E are not well constrained, but plate kinematic reconstructions and dating of dredge samples suggests that the ridge has been emplaced on ∼6-12 Ma old lithosphere (P´erez-D´ıaz and Eagles, 2014; Bolli et al., 1978; Hay and Sibuet, 1984).
The absence of lower crust with velocities higher than 7.5 km/s at this part of the ridge is consistent with relatively young lithosphere age. The slightly higher velocities north
ACCEPTED MANUSCRIPT
of the FFZ might also be explained by the age difference of oceanic crust. As discussed in the next section, the volcanic edifice north of the FFZ is most likely a product of late stage volcanism emplaced fully or partly∼30 Ma years after the formation of the Walvis Ridge and the, at that later time, more mature oceanic crust might have promoted higher velocities in the lower crust.
5.3. Geodynamic framework
Unfortunately, the timing and geometry of the South Atlantic opening from M0 to C34 (83.0 to 120.6 Ma, Gee and Kent, 2007) is not as tightly constrained as for later times because of the lack of magnetic reversal isochrones during the Cretaceous quiet period.
Reconstructions for this period vary considerably, reflecting the differing weights given to the remaining plate kinematic constraints (e.g. Seton et al., 2012; Heine et al., 2013;
P´erez-D´ıaz and Eagles, 2014).
During initial opening, the Sao Paolo Plateau (SPP) was still attached to South Africa and seafloor spreading north of Walvis Ridge was focussed at a mid-ocean ridge lying west of it (Mohriak et al., 2010). Remnants of abandoned ridges in this location have been interpreted from gravity anomalies at the ‘Abimael Ridge’ (Fig.1, Mohriak et al., 2010; Sandwell et al., 2014) and from bathymetric and gravity features at the Rio Grande Rise (P´erez-D´ıaz and Eagles, 2014). Successive jumps transferred the spreading centre to locations nearer to the African coast, eventually detaching the SPP from the African plate (Fig. 14). The following sea floor spreading shifted the SPP along the transform fault of the FFZ, leaving the steep northern escarpment at Walvis Ridge and normal oceanic crust devoid of abnormal volcanism to the north of the fracture zone (P3, Fromm et al., 2015; Planert et al., 2016). The exact timing for the ridge jump varies according to the different authors from 95 Ma (Seton et al., 2012) to 85 Ma (Fig. 14, P´erez-D´ıaz and Eagles, 2014).
In this study we do not find evidence for normal oceanic crust north of the FFZ in the Angola Basin as observed closer to the coast (Fig. 2, P3, Fromm et al., 2015; Planert et al., 2016). Along line P3, the thick crust of the Walvis Ridge abruptly thins to normal oceanic crust (nearly 30 km within 30 km distance). Instead, we observe a basement high (km 70) underlain by thickened oceanic crust as well as a thick layer of basaltic material overlying pre-existing oceanic crust at km 80-140 (Fig. 11).
The influence of the fracture zone is completely different between the two profiles. At P3, the fracture zone coincides with dramatic crustal thinning, whereas the fracture zone has only minor influence on the velocity structure and Moho topography at P150. A possible explanation for this contrast is the distance between the fracture zone and the axis of the Walvis Ridge, defined as the position with maximum crustal thickness. This distance is only 30 km at P3, but more than 100 km along P150. We suspect that part of the erupted material of Walvis Ridge at P3 might have been sheared off and is today preserved on the South American plate at the Sao Paolo Plateau.
At P150 the fracture zone is not visible in bathymetry or seismic reflection data. There are only aslight velocity decrease in the lower crust and a local minimum in free air gravity data where the FFZ crosses P150. Moreover, the seismic data suggest a thick layer of basaltic material at this position (Fig. 10, 12). From this, it seems that the
”northern edifice” must have formed after the transform fault became inactive and the SPP was sheared off. Thus, we suggest a difference in timing of volcanism and transform faulting between P150 and the eastern Walvis Ridge at P3. At P3, transform faulting
ACCEPTED MANUSCRIPT
occurred after the emplacement of Walvis Ridge, possibly removing parts of the volcanic material, creating a steep escarpment and leaving undisturbed oceanic crust north of it.
In contrast, at least some volcanic activity occurred after the transform faulting at P150 and volcanic rocks of the ”northern edifice” covered the fracture zone. Now, the question arises whether this occurred during emplacement of the main Walvis Ridge or in a later phase of volcanism.
Reconstructions show that the hotspot was located near P150 at around 100 Ma (O’Connor and Duncan, 1990). At that time the Angola Basin north of the ridge did not exist and the SPP lay adjacent to the north of Walvis Ridge (Fig. 14 a). Contemporaneous emplacement of the northern edifice with the Walvis Ridge would require opening of the Angola Basin at that time (100 Ma) but the most recent reconstruction of the South Atlantic opening predicts the creation of normal oceanic crust along P150 in the Angola Basin at around 85 Ma (Fig. 14 c, P´erez-D´ıaz and Eagles, 2014). Therefore, the northern edifice would post-date the main eruption by at least 15 million years. Late stage volcanism is observed at another hotspot trail, the Ninetyeast Ridge (Grevemeyer et al., 2001). Both the Ninetyeast Ridge and the Walvis Ridge are aligned with major transform faults. Reactivation of these fracture zones might have caused late magmatism in each case. Two seamounts located north of the FFZ (Fig. 6, km 70) were dredged during the RV Sonne cruise SO 233 (DR77, DR80; Hoernle et al., 2014). Preliminary results (Homrighausen, pers.com) indicate that the dredged samples might have erupted
∼30 Ma after the main eruption phase of Walvis Ridge.
5.4. The influence of the Florianopolis fracture zone
Intraplate stress release at fracture zones above local mantle inhomogeneities has been suggested as an alternative origin for linear volcanic chains (Anderson, 2001, 2005). In accordance with this model, previous studies have proposed the Walvis Ridge as the site of a failed rift arm or ‘leaky’ fracture zone (Fairhead and Wilson, 2005; Haxel and Dziak, 2005).
Our study revealed parts of the FFZ covered beneath basalts and an undisturbed crustal root of the Walvis Ridge. Again the exact timing of events is crucial for its interpretation.
The uppermost basaltic layer is not offset by transform motion and was emplaced after the active phase of the FFZ in this part of the Walvis Ridge. Fracture zones are commonly interpreted as weak zones within the crust, which preferentially become reactivated or focus magmatism. It has been stated that plumes might utilize existing weak zones as migration paths to the surface, even if this requires lateral flow over a longer distance towards the weak zone (Sleep, 2006; O’Connor et al., 2012).
If the FFZ predates emplacement of Walvis Ridge (eliminating the necessity to invoke late stage volcanism), then it did not focus magmatism to form the ridge. The decreased seismic velocities and densities at the FFZ oppose the interpretation of the fracture zone as a migration path for volcanic material. Furthermore, the crustal root of the Walvis Ridge lies 100 km distant from the fracture zone and therefore both, the eruptions at Walvis Ridge and the activation of the fracture zone, seem to have been localized independently of each other.
Assuming a different timing of events, the Walvis Ridge might have been emplaced before the active transform fault, to be followed by secondary volcanism that obscured the FFZ.
In this scenario, the re-activation of the transform fault might have triggered the late stage volcanism north of Walvis Ridge.
ACCEPTED MANUSCRIPT
6. Conclusion
We present a model of the deep crustal structure of Walvis Ridge at 6°E based on a seismic refraction experiment and gravity modelling. The model shows that the Walvis Ridge consists of thickened oceanic crust composed of basaltic layers, pillow basalts and sheeted dikes in the upper crust and gabbroic rocks in the lower crust. The maximum crustal thickness at Walvis Ridge is 18±2 km compared with 7±1 km thick oceanic crust of the Angola and Cape Basins at the opposite ends of the seismic line. Our results show additional volcanic structures north of Walvis Ridge: a basement high underlain by 12 km thick igneous crust and basaltic layers covering old oceanic crust and the Florianopolis Fracture Zone. The extent of the Walvis Ridge and the area affected by related magmatism is therefore larger than previously estimated. The upper crustal velocities at the ridge crest indicate basaltic rocks with a low degree of fractionation and suggest that this part of the ridge was emplaced in a deep marine environment. In the lower crust we observe no massive high velocity material similar to findings close to the Namibian coast. The lack of high velocity lower crust is 6°E is attributed to the younger and thinner lithosphere and lower pressure of melting compared to the continental margin. The finding of magmatic material north of the ridge indicates that extensive volcanism occurred after the Sao Paolo Plateau sheared off the Walvis Ridge along the FFZ. The basaltic layers cover and obscure the FFZ. Therefore they might have been emplaced after the active phase of the transform fault. Recent dredge samples (Hoernle et al., 2014, Homrighausen, pers.com) indicate that a reactivation of the transform fault might have triggered a massive late stage volcanism, opening new pathways for hotspot melt trapped beneath the lithosphere. This magmatism might have overprinted the older crustal fabric. Oceanic crust (6-7 km thickness) typical for the Angola Basin might only be present at the very beginning of the line (km 0-20). In general, our data support a hotspot origin of the ridge and reject a major role of the fracture zone model in the emplacement of the Walvis Ridge.
Acknowledgements
We thank DFG for funding this project (JO-191/15-1, BE-1041/29-1), SPP Sample, the crew of RV Maria S. Merian and everyone involved in data acquisition, project planning and logistics. Seismic instruments were provided by GEOMAR. We also thank Michael Schnabel, an anonymous reviewer and Robert Trumbull for constructive suggestions for improvements.
References
Anderson, D. L., 2001. Top-down tectonics? Science 293 (5537), 2016–2018.
Anderson, D. L., 2005. Scoring hotspots: The plume and plate paradigms. Geological Society of America Special Papers 388, 31–54.
Barton, P., 1986. The relationship between seismic velocity and density in the continental crust – a useful constraint? Geophysical Journal International 87 (1), 195–208.
Bauer, K., Neben, S., Schreckenberger, B., Emmermann, R., Hinz, K., Fechner, N., Gohl, K., Schulze, A., Trumbull, R., Weber, K., 2000. Deep structure of the namibia continental margin as derived from integrated geophysical studies. Journal of Geophysical Research 105 (B11), 25829–25.
ACCEPTED MANUSCRIPT
Becker, K., Becker, K., Franke, D., Schnabel, M., Schreckenberger, B., Heyde, I., Krawczyk”, C. M., 2012.
The crustal structure of the southern argentine margin. Geophysical Journal International 189 (3), 1483–1504.
Becker, K., Franke, D., Trumbull, R. B., Schnabel, M., Heyde, I., Schreckenberger, B., Koopmann, H., Bauer, K., Jokat, W., Krawczyk, C. M., 2014. Asymmetry of high-velocity lower crust on the south atlantic rifted margins and implications for the interplay of magmatism and tectonics in continental break-up. Solid Earth Discussions 6 (1), 1335–1370.
URLhttp://www.solid-earth-discuss.net/6/1335/2014/
Bolli, H., Ryan, W., Foresman, J., Hottman, W., Kagami, H., Longoria, J., McKnight, B., Melguen, M., Natland, J., Proto Decima, F., et al., 1978. Walvis ridge – sites 362 and 363. Initial Rep. Deep Sea Drill. Proj 40, 183–356.
Braile, L. W., Smith, R. B., 1975. Guide to the interpretation of crustal refraction profiles. Geophysical Journal International 40 (2), 145–176.
URLhttp://gji.oxfordjournals.org/content/40/2/145.abstract
Cappelletti, A., Tsikalas, F., Nestola, Y., Cavozzi, C., Argnani, A., Meda, M., Salvi, F., nov 2013. Impact of lithospheric heterogeneities on continental rifting evolution: Constraints from analogue modelling on south atlantic margins. Tectonophysics 608, 30–50.
Coffin, M. F., Duncan, R. A., Eldholm, O., Fitton, J. G., Frey, F. A., Larsen, H. C., Mahoney, J. J., Saunders, A. D., Schlich, R., Wallace, P. J., 2006. Large igneous provinces and scientific ocean drilling:
Status quo and a look ahead. Oceanography 19 (4), 150–160.
Contreras-Reyes, E., Grevemeyer, I., Watts, A., Planert, L., Flueh, E. R., Peirce, C., 2010. Crustal intrusion beneath the louisville hotspot track. Earth and Planetary Science Letters 289 (3), 323–333.
Elliott, G., Berndt, C., Parson, L., 2009. The sw african volcanic rifted margin and the initiation of the walvis ridge, south atlantic. Marine Geophysical Research 30 (3), 207–214.
Fairhead, J. D., Wilson, M., 2005. Plate tectonic processes in the south atlantic ocean: Do we need deep mantle plumes? Geological Society of America Special Papers 388, 537–553.
Farnetani, C. G., Richards, M. A., Ghiorso, M. S., 1996. Petrological models of magma evolution and deep crustal structure beneath hotspots and flood basalt provinces. Earth and Planetary Science Letters 143 (1), 81–94.
Fromm, T., Planert, L., Jokat, W., Ryberg, T., Behrmann, J., Weber, M., Haberland, C., 2015. South atlantic opening: A plume-induced breakup? Geology 43 (10), 931–934.
URLhttp://geology.gsapubs.org/content/early/2015/08/28/G36936.1.abstract
Gallagher, K., Hawkesworth, C., 1994. Mantle plumes, continental magmatism and asymmetry in the south atlantic. Earth and Planetary Science Letters 123 (1), 105–117.
Gee, J. S., Kent, D. V., 2007. Source of oceanic magnetic anomalies and the geomagnetic polarity time scale. Treatise on Geophysics, vol. 5: Geomagnetism, 455–507.
G¨otze, H.-J., Lahmeyer, B., 1988. Application of three-dimensional interactive modeling in gravity and magnetics. Geophysics 53 (8), 1096–1108.
Grevemeyer, I., Flueh, E., Reichert, C., Bialas, J., Kl¨aschen, D., Kopp, C., 2001. Crustal architecture and deep structure of the ninetyeast ridge hotspot trail from active-source ocean bottom seismology.
Geophysical Journal International 144 (2), 414–431.
Haxel, J., Dziak, R., 2005. Evidence of explosive seafloor volcanic activity from the walvis ridge, south atlantic ocean. Geophysical research letters 32 (13).
URLhttp://dx.doi.org/10.1029/2005gl023205
Hay, W., Sibuet, J., 1984. Initial Reports of the Deep Sea Drilling Project. Vol. 75. Washington D.C., U.S. Government Printing Office.
Heine, C., Zoethout, J., M¨uller, R. D., 2013. Kinematics of the south atlantic rift. Solid Earth 4 (2), 215–253.
URLhttp://www.solid-earth.net/4/215/2013/
Heit, B., Yuan, X., Weber, M., Geissler, W., Jokat, W., Lushetile, B., Hoffmann, K.-H., 2015. Crustal thickness and vp/vs ratio in nw namibia from receiver functions: evidence for magmatic underplating due to mantle-plume – crust interaction. Geophysical Research Letters 42 (9), 3330–3337.
URL10.1002/2015GL063704
Hill, D. P., Zucca, J. J., 1987. Geophysical constraints on the structure of kilauea and mauna loa volcanoes and some implications for seismomagmatic processes. US Geol. Surv. Prof. Pap 1350 (2), 903–917.
Hirsch, K., Bauer, K., Scheck-Wenderoth, M., 2009. Deep structure of the western south african passive margin—results of a combined approach of seismic, gravity and isostatic investigations. Tectonophysics 470 (1), 57–70.
ACCEPTED MANUSCRIPT
Hoernle, K., Werner, R., L¨uter, C., 2014. Rv sonne fahrtbericht/cruise report so233 walvis ii, 14.05-21.06.
2014, cape town, south africa-walvis bay, namibia. Tech. rep., GEOMAR Helmholtz-Zentrum f¨ur Ozeanforschung Kiel.
Holbrook, W., Larsen, H., Korenaga, J., Dahl-Jensen, T., Reid, I., Kelemen, P., Hopper, J., Kent, G., Lizarralde, D., Bernstein, S., et al., 2001. Mantle thermal structure and active upwelling during continental breakup in the north atlantic. Earth and Planetary Science Letters 190 (3), 251–266.
Inoue, H., Coffin, M. F., Nakamura, Y., Mochizuki, K., Kroenke, L. W., 2008. Intrabasement reflections of the ontong java plateau: Implications for plateau construction. Geochemistry, Geophysics, Geosystems 9 (4).
Jegen, M., Jegen, M., Avdeeva, A., Berndt, C., Franz, G., Heincke, B., H¨olz, S., Neska, A., Marti, A., Planert, L., Chen, J., Kopp, H., Baba, K., Ritter, O., Weckmann, U., Meqbel, N., Behrmann”, J., 2016. 3-d magnetotelluric image of offshore magmatism at the walvis ridge and rift basin.
Tectonophysics 683, 98–108.
Jokat, W., Reents, S., 2016. Hotspot volcanism in the southern south atlantic: Geophysical constraints on the evolution of the southern walvis ridge and the discovery seamounts. Tectonophysics, –.
URLhttp://www.sciencedirect.com/science/article/pii/S0040195116306102
Kessling, S., 2008. Die tiefenstruktur der kruste des discovery seamounts und des s¨udlichen walfischr¨uckens im s¨udatlantik. Master’s thesis, Universitaet Jena.
Ludwig, W. J., Nafe, J. E., Drake, C. L., 1970. Seismic refraction. In: A.E.Maxwell (Ed.), The sea.
Vol. 4. Wiley-Intersci., Hoboken,N. J., pp. 53–84.
Lutter, W., Nowack, R., Braile, L., 1990. Seismic imaging of upper crustal structure using travel times from the passcal ouachita experiment. Journal of Geophysical Research: Solid Earth (1978–2012) 95 (B4), 4621–4631.
Mohriak, W., N´obrega, M., Odegard, M., Gomes, B., Dickson, W., 2010. Geological and geophysical interpretation of the rio grande rise, south-eastern brazilian margin: extensional tectonics and rifting of continental and oceanic crusts. Petroleum Geoscience 16 (3), 231–245.
Morgan, W. J., 1971. Convection plumes in the lower mantle. Nature 230 (5288), 42–43.
Moulin, M., Aslanian, D., Unternehr, P., 2010. A new starting point for the south and equatorial atlantic ocean. Earth-Science Reviews 98 (1–2), 1 – 37.
URLhttp://www.sciencedirect.com/science/article/pii/S0012825209001172
O’Connor, J., Duncan, R., 1990. Evolution of the walvis ridge-rio grande rise hot spot systen:
implications for african and south american plate motions over plumes. Journal of Geophysical Research 95 (B11), 17475–17502.
O’Connor, J., Jokat, W., le Roex, A., Class, C., Wijbrans, J., Keßling, S., Kuiper, K., Nebel, O., 2012. Hotspot trails in the south atlantic controlled by plume and plate tectonic processes. Nature Geoscience 5 (10), 735–738.
P´erez-D´ıaz, L., Eagles, G., 2014. Constraining south atlantic growth with seafloor spreading data.
Tectonics 33 (9), 1848–1873.
Planert, L., Behrmann, J., Jokat, W., Fromm, T., Ryberg, T., Weber, M., Haberland, C., 2016. The wide-angle seismic image of a complex rifted margin, offshore north namibia: Implications for the tectonics of continental breakup. Tectonophysics.
Renne, P. R., Glen, J. M., Milner, S. C., Duncan, A. R., 1996. Age of etendeka flood volcanism and associated intrusions in southwestern africa. Geology 24 (7), 659–662.
Richards, M., Contreras-Reyes, E., Lithgow-Bertelloni, C., Ghiorso, M., Stixrude, L., 2013. Petrological interpretation of deep crustal intrusive bodies beneath oceanic hotspot provinces. Geochemistry, Geophysics, Geosystems 14 (3), 604–619.
Rohde, J. K., van den Bogaard, P., Hoernle, K., Hauff, F., Werner, R., sep 2012. Evidence for an age progression along the tristan-gough volcanic track from new 40ar/39ar ages on phenocryst phases.
Tectonophysics 604, 60–71.
URLhttp://dx.doi.org/10.1016/j.tecto.2012.08.026
Sallar`es, V., Charvis, P., Flueh, E. R., Bialas, J., 2003. Seismic structure of cocos and malpelo volcanic ridges and implications for hot spot-ridge interaction. Journal of geophysical research 108 (B12), 2564.
Sallar`es, V., Charvis, P., Flueh, E. R., Bialas, J., 2005. Seismic structure of the carnegie ridge and the nature of the galapagos hotspot. Geophysical Journal International 161 (3), 763–788.
Sandwell, D. T., M¨uller, R. D., Smith, W. H. F., Garcia, E., Francis, R., 2014. New global marine gravity model from cryosat-2 and jason-1 reveals buried tectonic structure. Science 346 (6205), 65–67.
URLhttp://www.sciencemag.org/content/346/6205/65.abstract
Sandwell, D. T., Smith, W. H., 2009. Global marine gravity from retracked geosat and ers-1 altimetry:
Ridge segmentation versus spreading rate. Journal of Geophysical Research 114 (B1).
ACCEPTED MANUSCRIPT
Seton, M., M¨uller, R., Zahirovic, S., Gaina, C., Torsvik, T., Shephard, G., Talsma, A., Gurnis, M., Turner, M., Chandler, M., jul 2012. Global continental and ocean basin reconstructions since 200 ma.
Earth-Science Reviews 113 (3-4), 212–270.
URLhttp://dx.doi.org/10.1016/j.earscirev.2012.03.002
Sleep, N. H., 2006. Mantle plumes from top to bottom. Earth-Science Reviews 77 (4), 231–271.
Watts, A., Sandwell, D., Smith, W., Wessel, P., 2006. Global gravity, bathymetry, and the distribution of submarine volcanism through space and time. Journal of geophysical research 111 (B8), B08408.
Watts, A. B., ten Brink, U. S., 1989. Crustal structure, flexure, and subsidence history of the hawaiian islands. Journal of Geophysical Research: Solid Earth 94 (B8), 10473–10500.
URLhttp://dx.doi.org/10.1029/JB094iB08p10473
White, R., McKenzie, D., O’Nions, R., 1992. Oceanic crustal thickness from seismic measurements and rare earth element inversions. Journal of Geophysical Research 97 (B13), 19683–19715.
Wolfe, C. J., McNutt, M. K., Detrick, R. S., 1994. The marquesas archipelagic apron: Seismic stratigraphy and implications for volcano growth, mass wasting, and crustal underplating. Journal of Geophysical Research: Solid Earth (1978–2012) 99 (B7), 13591–13608.
Zelt, B., 2004. Zp - software for plotting and picking seismic refraction data in segy format.
http://www.soest.hawaii.edu/users/bzelt/zp/zp.html.
Zelt, C. A., Smith, R. B., 1992. Seismic traveltime inversion for 2-d crustal velocity structure. Geophysical Journal International 108 (1), 16–34.
URLhttp://dx.doi.org/10.1111/j.1365-246X.1992.tb00836.x
ACCEPTED MANUSCRIPT
Tables
Unit n trms/s χ2
Sediments 942 0.070 0.855
Crust 5729 0.074 0.475
Mantle 244 0.094 0.494
Boundary
Moho 2369 0.097 0.558
Basement 517 0.101 1.803
LVZ (top) 65 0.045 0.208
LVZ (bottom) 254 0.092 0.921
Total 10120 0.082 0.607
Table 1: Summarized error statistics for the P-wave modelling. Columns show the number of picks (n), their mean deviationtrmsand the normalizedχ2value for different geological units and boundaries. The boundaries summarize reflected phases and the units main refracted phases (except for the sedimentary layers, which also include some reflections). The low velocity zone (LVZ) north of the ridge is constrained solely by reflections from the top and bottom and is therefore relatively poor resolved (see Fig. 9)
ACCEPTED MANUSCRIPT
Figure Captions
Figure 1. General map of the South Atlantic of our study area showing the main geological structures and magmatic features (orange, after Coffin et al., 2006).
Transformation zones after Moulin et al. (2010) are indicated by dashed lines.
Figure 2. Location of the presented profile 150 crossing the Walvis Ridge ∼600 km east of the African coastline and other deep seismic profiles from the same campaign (Fromm et al., 2015). Note that the bathymetric expression at the intersection of the profile with the ridge less prominent compared to the East and the Florianopolis Fracture zone is not visible in the bathymetry.
Figure 3. Raw seismic reflection data (top) with interpretation (bottom) and station locations. Three sediment layers can be identified (layers 2-4). The basement (top of layer 5) varies in amplitude and roughness along the profile. Amplitudes are strong at the northwestern flank of the ridge. The rough basement under the top of the ridge scatters seismic energy, therefore the basement depth is more uncertain in this area.
Figure 4. Data example for OBH 175 showing recorded wide-angle seismic data (top), traced arrivals (centre) and ray coverage (bottom). The data are bandpass filtered with 3.5-13 Hz corner frequencies and amplified with an automated gain control (AGC) within a 1 s time window. The travel time picks are indicated by vertical bars with variable length representing the pick uncertainty. The travel time is reduced with 7 km/s. The number of drawn rays is reduced for clarity.
Figure 5. OBH data for station 159, filtered with 3.5-65 Hz bandpass, true amplitude scaling. This station is located at the northwestern flank of Walvis Ridge and shows features typical of all station along the flank (stations 153-164). The first refracted phase within the basement has asymmetric offsets and displays a time gap between the refracted phases. Reflections from the top and bottom of the low velocity zone can be seen, together with a sequence of closely spaced phases, which indicate reverberating reflections.
Figure 6. Final P-wave velocity model. Black lines indicate the model layers, bold italic numbers denote the layer number. The basement and the crust mantle boundary (Mohoroviˇci´c discontinuity or abbreviated Moho) are plotted with thick black lines.
There is no data coverage for the white areas of the model. The red triangles indicate the locations of the OBH recording stations.
Figure 7. Enlarged part of the final P-wave velocity model (Fig. 6) for the sediment layers and upper crust. Labelling similar to Fig. 6.
ACCEPTED MANUSCRIPT
Figure 8. Ray tracing results (top) and ray coverage (bottom) for all stations of profile 150.
Figure 9. Resolution plot for profile 150. The model is well resolved in the lower crust (values above 0.5, light grey, Zelt and Smith, 1992; Lutter et al., 1990). The lower resolution north of the ridge (LVZ) is due to a velocity inversion, which does not produce refracted waves and is therefore only constrained by reflections.
Figure 10. Density model for profile 150. a) The observed free air satellite data (Sandwell et al., 2014), the modelled gravity data and their deviation. b) The final density model.
c) Overlay if the density distribution directly converted from the P-wave velocity model and the polygon geometry of the final density model. d) The seismic P-wave velocity model.
Figure 11. Geological interpretation of the velocity and density model
Figure 12. Free air gravity anomaly map of the research area (Sandwell and Smith, 2009).
The expression of the Florianopolis Fracture Zone is suppressed at the intersection with profile 150.
Figure 13. Comparison between the crustal structure of profile 150 with other profiles from the Walvis Ridge and other hotspot trails. The annotated contours at 6.5-6.7 km/s mark the transition between oceanic layer 2 and 3 (dikes and gabbro). The contour at 7.2 km/s indicates anomalous high seismic velocities in the lower crust. Abbreviations:
P3 Fromm et al. (2015), WWR western Walvis Ridge Kessling (2008), 90E Ninetyeast Ridge Grevemeyer et al. (2001), CR Cocos Ridge Sallar`es et al. (2003).
Figure 14. Reconstruction of the South Atlantic opening (P´erez-D´ıaz and Eagles, 2014).
Flood basalt provinces are marked in orange, red circle denotes the predicted hotspot location (O’Connor and Duncan, 1990). The location of line P150 is indicated in b) and c).