1. Introduction
Beyond a general scientific curiosity about the nature of the continental crust and its formation, detailed information on its lower and middle parts is a pre-requisite for mineral and geothermal exploration and the assessment of earthquake hazards. For example, some of the most damaging earthquakes such as in Nepal (2015; Mw 7.8) and Sichuan (2008; Mw 7.9) occur in continental collision zones (Hubbard et al., 2016; Lin et al., 2009). Continental crust is up to 70 km thick. Thus, the lower crustal processes in active continental collision zones (e.g., formation of mafic or ultramafic cumulate rocks and emplacement of magma from the mantle) occur at too great depth to be studied directly (Arndt & Goldstein, 1989; Hacker et al., 2015), far beyond the reach of boreholes, for example, the deepest borehole on Kola peninsula was 12 km deep
Abstract
Continental collision causes deformation in the crust along shear zones. However, the physical and chemical conditions at which these zones operate and the deformation processes that enable up to hundreds of km of tectonic transport are still unclear because of the depth at which they occur and the challenges in imaging them. Ancient exhumed collision zones allow us to investigate these processes much better, for example at the COSC-1 borehole in the central Scandinavian Caledonides. This study combines data from the COSC-1 borehole with different seismic measurements to provide constraints on the spatial lithological and textural configuration of the Seve Nappe Complex. This is one of the few studies that shows that core-log-seismic integration in metamorphic rocks allows to identify the spatial distribution of major lithological units. Especially gamma ray logs in combination with density data are powerful tools to distinguish between mafic and felsic lithologies in log-core correlation. Our results indicate that reflections along the borehole are primarily caused by compositional rather than textural changes. Reflections in the Seve Nappe Complex are not as distinct as in greater depths but continuous and several of them can be linked to magmatic intrusions, which have been metamorphically overprinted.Their setting indicates that the Seve Nappe Complex consists of the remnants of a volcanic continental margin. Our results suggest that ductile-deformed middle crustal reflectivity is primarily a function of pre-orogenic lithological variations which has to be considered when deciphering mountain building processes.
Plain Language Summary
Areas where continents collide experience different kind of deformation. However, these processes and the conditions at which they take place are difficult to study because of the great depth at which they occur. Former collision zones that are closer to the surface these days allow the investigation of these processes much better, for example at the COSC-1 borehole in the central Scandinavian Caledonides. The challenge remains to image the remnant of these processes in high detail but at the same time over a large area. This study combines data from the COSC-1 borehole with different geophysical measurements to better understand the lithology and structure of the Seve Nappe Complex. We show that the combination of these data allows us to distinguish between rocks from mafic and sedimentary origin. Our results indicate that the geophysical data along the borehole image the change of the composition of the rocks which probably originates from magmatic intrusions and have been overprinted by geological processes, rather than from fracture zones.© 2021. The Authors.
This is an open access article under the terms of the Creative Commons Attribution License, which permits use, distribution and reproduction in any medium, provided the original work is properly cited.
the ICDP Drilling Project COSC-1, Sweden
Judith Elger1 , Christian Berndt1 , Felix Kästner1,2 , Simona Pierdominici2 , Jochem Kück2 , Bjarne S. G. Almqvist3 , Christopher Juhlin3 , and Henning Lorenz3
1GEOMAR Helmholtz Centre for Ocean Research Kiel, Kiel, Germany, 2Helmholtz Centre Potsdam GFZ German Research Centre for Geosciences, Potsdam, Germany, 3Department of Earth Sciences, Uppsala University, Uppsala, Sweden
Key Points:
• Core-log-seismic integration works well with metamorphic rocks in the middle crust
• Log analysis can distinguish between former mafic and sedimentary lithologies
• Reflections at COSC-1 are caused primarily by compositional variation
Supporting Information:
• Supporting Information S1
• Figure S1
• Figure S2
Correspondence to:
J. Elger, jelger@geomar.de
Citation:
Elger, J., Berndt, C., Kästner, F., Pierdominici, S., Kück, J., Almqvist, B. S. G., et al. (2021). Core-log-seismic integration in metamorphic rocks and its implication for the regional geology: a case study for the ICDP drilling project COSC-1, Sweden.
Geochemistry, Geophysics, Geosystems, 22, e2020GC009376. https://doi.
org/10.1029/2020GC009376 Received 13 AUG 2020 Accepted 26 NOV 2020
(Kozlovsky & Adrianov, 1987). Therefore, most knowledge on the deep sections of nappe emplacement stems from ancient collision zones that have been exhumed (Fowler & Osman, 2009; Matenco et al., 2010;
Viola et al., 2008; Vollbrecht et al., 1989) and requires a combination of geological outcrop studies, bore- hole investigations, and deep geophysical imaging. All these methods have their limitations. While outcrop studies and boreholes reveal only very limited three-dimensional information, they provide high-resolution information on the petrology of the rocks, while geophysical experiments provide the spatial context but no direct observation of the rocks and generally have a low resolution (10–100 s of meters). Several major scientific campaigns have therefore attempted to combine these methods to constrain the geological pro- cesses that are active in the lower and middle continental crust. The Kola Super Deep Borehole (Kozlovsky
& Adrianov, 1987) was the deepest borehole so far. It was drilled from 1970 to 1994 and reached 12,262 m into the Baltic Shield to learn about physical properties and chemical composition of the deep crust and to calibrate deep seismic imaging (Smithson et al., 2000). The German Deep Continental Drilling Program (KTB) managed to drill 9,101 m into the Erbendorf-Vohenstrauß Zone between 1987 and 1994 (Emmer- mann & Lauterjung, 1997) with the main aim to understand the complex geological structure of the middle and lower continental crust. A secondary objective was to derive better constraints on the influence of fracture zones on geothermal energy (Szalaiová et al., 2015) and to monitor in situ physical, chemical, and rock mechanical properties over prolonged time periods (Harms & Kück, 2020). Between 2001 and 2005 the Chinese Continental Scientific Drilling Program drilled 5,158 m into the Sulu ultrahigh-pressure metamor- phic terrain. Here, the main aim was to better understand the very deep crust that experienced deformation at 120 km depth in a continent-continent collision setting (Xu et al., 2009, 2017).
A comprehensive understanding of the plate tectonic regime must consider the continental lower crust and the upper mantle, including the emplacement of nappes, that is, large continuous slabs of the overriding plate that accommodate shortening along low angle thrust faults and associated lower crustal deforma- tion zones. The Scandinavian Caledonides are one of the best sites to study continent-continent collision because they have not been severely overprinted since the Caledonian orogeny and the tectonostratigra- phy is fairly similar along strike (Gee et al., 2010). This means that geological processes at depth are eas- ier to investigate than in other tectonic settings or in locations with a more complex geological history.
For this reason, the COSC-1 borehole was drilled in 2014 in the central Caledonides close to the town of Åre in Jämtland, Sweden (Lorenz et al., 2015a; Figure 1). In order to establish a coherent model of mid- Paleozoic mountain building and to apply it to modern analogs, for example the Himalaya-Tibet mountain belt, the drilling campaign aimed to sample a thick and continuous section of the lower part of the Seve Nappe Complex and to penetrate its basal thrust zone into the underlying lower-grade metamorphosed allochthon. The project succeeded to drill down to 2,495.8 m driller’s depth and achieved nearly 100% core recovery. The core showed that the Lower Seve Nappe is comprised of homogeneous gneisses, with only subordinate metamorphosed mafic bodies. The basal thrust zone was unexpectedly thick (>800 m) (Lorenz et al., 2015b). The borehole did not penetrate the bottom of the thrust zone but lower-grade metasedi- mentary rocks were encountered in the lowermost part of the drill hole together with tens of meters thick garnetiferous mica schists and mylonites (Lorenz et al., 2015b). Thus, COSC-1 is different from previous drillings and geophysical experiments as it studies mid-crustal rocks similar to KTB and unlike the Chinese Continental Drilling Program, but unlike KTB, the geophysical imaging at COSC-1 is far less affected by fracture zones and the particularly steep dip of lithological boundaries in KTB, making COSC-1 an ex- cellent site for studying the seismic response of lithological changes at mid-crustal levels. Several studies analyzed and interpreted the 2D and 3D data sets at COSC-1 focusing primarily on reflections below the borehole (e.g., Hedin et al., 2012; 2016; Juhlin et al., 2016; Simon et al., 2019). Other studies integrated vertical seismic profile experiments to derive an anisotropy model (Simon et al., 2017) or used samples for laboratory anisotropy analyses (Kästner et al., 2020; Wenning et al., 2016). Core analyses allowed to constrain the pressure and temperature conditions, and the timing of the emplacement of the Seve Nappe Complex (Giuntoli et al., 2020).
The main objective of this study is to improve the understanding of lithological variations and deformation of the Seve Nappe Complex at different scales. To this end we adapt core-log-seismic integration methods that have been developed for sedimentary basins to the metamorphic environment of the central Scan- dinavian Caledonides at the COSC-1 drill site. Specific questions that we address in the log-core correla- tion are which logs enable a distinct lithological differentiation for metamorphic rocks and which logs are
equivalent. In the subsequent core-log-seismic integration, we aim to determine the origin of the observed reflections in the Seve Nappe Complex along the COSC-1 borehole, which could be compositional layering, shear zones, anisotropy and fluid-filled faults and fractures, or a combination of these factors. Within the scope of the scientific questions of the COSC-1 project, we apply the one-dimensional information from the drill hole to improve the 3D model of the reflectors in the middle Seve Nappe Complex. Our aim is to provide more geological background to the study of metamorphic processes and deformation during the arc-continent and continent-continent collision that led to the formation of the Scandinavian Caledonides and caused a higher metamorphic overprint in the Seve Nappe Complex than in the underlying Särv Nappe.
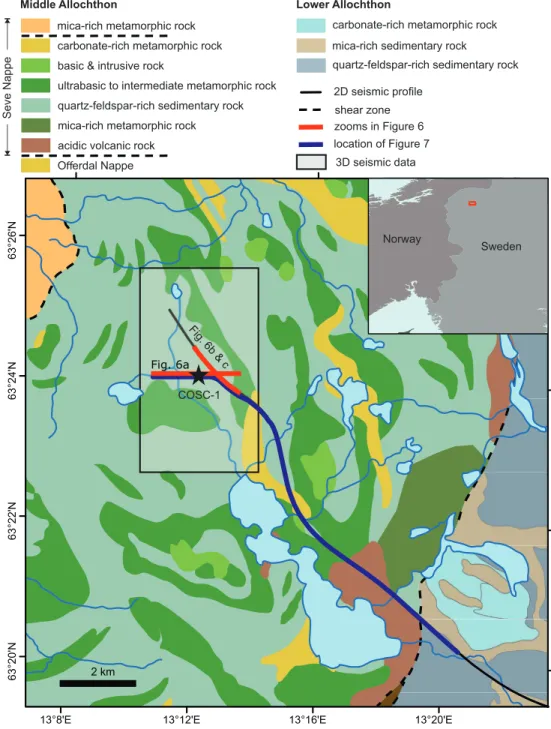
Figure 1. Tectonostratigraphic map of the study area (based on the 1:250 000 scale geological map by the Geological Survey of Sweden) showing the COSC-1 drill site (black star) and relevant geophysical surveys (red and blue lines) in relationship to the tectonic units of the Scandinavian Caledonides.
13°20'E 13°16'E
13°12'E 13°8'E
63°26'N63°24'N63°22'N63°20'N 2 km
COSC-1
3D seismic data shear zone 2D seismic profile
location of Figure 7
Seve Nappe
Middle Allochthon
carbonate-rich metamorphic rock basic & intrusive rock
ultrabasic to intermediate metamorphic rock quartz-feldspar-rich sedimentary rock mica-rich metamorphic rock
Fig. 6b &
c
Sweden Norway
Lower Allochthon
O erdal Nappe acidic volcanic rock
zooms in Figure 6
carbonate-rich metamorphic rock mica-rich sedimentary rock
quartz-feldspar-rich sedimentary rock mica-rich metamorphic rock
Fig. 6a
2. Methods
2.1. Log Classification
In order to define classes of log facies from log information we used 10 logs that were measured in the COSC-1 campaign and are available through the International Continental Scientific Drilling Program (ICDP) online repository (https://www.icdp-online.org/projects/world/europe/are-jarpen-sweden/) (over- view of these logs for the entire borehole in the supporting information S2). Details on the measurement of X-ray fluorescence (XRF) geochemical data can be found in Sjöqvist et al. (2015), information on the set up of the downhole logging and the multi-sensor core logger (MSCL) measurements are documented in the COSC-1 reports (Lorenz et al., 2015a, 2019). For reasons of data quality, we used the logs on total gamma ray from downhole logging and bulk density from MSCL measurements, the content of K, Rb, Zr, Si, Fe, Ti, Al, and Zn from XRF measurements for the classification. The XRF core scanner provides high-quality nondestructive data of geochemical composition in the bulk-rock. Some chemical elements such as Mg, Na, F, C, O, and H could not be detected falling outside the range of the XRF core scanner (Rothwell &
Croudace, 2015). Therefore, we chose a method which is driven by the availability and quality of data, and which is not typical for petrological or geochemical classifications as for example in ACF diagrams (e.g., Wei & Duan, 2019). We applied some data cleaning, smoothed the data over a moving window of 2 m and removed unrealistic outliers. In order to identify substantial changes with depth, we used the standardize tool in TechLog (version 2017.2 by Schlumberger Ltd.) to show the deviation of the parameters from their mean value with xnew=(x-u)/o, where x is the original log data, u is the mean value, and o is the standard deviation. Logs with similar patterns at same depths, meaning similar deviation from their mean values, were summed into trend curves (TCs) showing an enhanced deviation curve of the logs included in the group. Although the content of Ca was measured by XRF, it was not used for the classification because the deviation curve fit to different TCs but it is available in the supporting information S2.
2.2. Vertical Seismic Profiling (VSP) Processing
A zero-offset vertical seismic profile (ZOVSP) experiment (Krauß et al., 2020) was conducted as part of a post-drilling geophysical survey at the COSC-1 borehole in 2014 (Simon et al., 2017). A geophone chain with 15 three-component 15 Hz geophones was deployed inside the COSC-1 borehole with a 2 m effective receiver spacing. The impulsive rock-breaking impact source (type Vibrometrics VIBSIST-3000) was located about 29 m away from the well head. Seismic processing involved picking of first-arrival times, rotation of geophone components, deconvolution, and the separation of the up- and down-going wavefields. The up- going wavefield shifted to two-way travel time shows horizontally aligned reflections at respective receiver depths. In order to emphasize primary reflections along the borehole, an outer corridor stack of the upgoing wavefield was calculated. For this purpose, trace equalization and surgical mute were applied (data outside a corridor close to the first arrival times of the direct P-wave were muted) and the remaining data were stacked over depth. The resulting trace is comparable to a zero-offset surface seismic geometry close to the borehole (Figure 4). Further information and a detailed description of the processing and interpretation of the VSP survey and related experiments can be found in Krauß (2018).
2.3. Core-Log-Seismic Integration
We used the software package HRS-geoview by Hampson-Russell (version 10.0, CGG-GeoSoftware) to cor- relate the borehole information with the seismic data. A synthetic seismogram was calculated through convolution of core density data obtained from MSCL measurements (Lorenz et al., 2015a) and P-wave velocity data measured as part of the downhole logging campaign in 2014, described and available in Lorenz et al. (2019). Both logs were cleaned and smoothed to 5 m. For an initial time-depth relationship, we gener- ated a check shot from first arrivals of borehole geophones from the ZOVSP (Krauß, 2018; Figure S1). As a source signal we extracted a statistical wavelet from the corridor stack (0–900 ms, length 100 ms; Figure 2).
The correlation tool in HRS-geoview compares the synthetic with the measured seismogram and adjusts the time-depth relation based on manually picked similar reflections and on the maximal correlation coef- ficient (Figure S1). As there were different seismic measurement campaigns in the area of the COSC-1 site, we aimed to correlate the synthetic seismogram with the ZOVSP measurement (Krauß, 2018), with trace
185 from the 2D seismic profile (Hedin et al., 2012), and with the 3D data at the intersection of inline 1,043 and crossline 1,079 (Hedin et al., 2016), which are most proximal to the borehole location (see Figure 1).
3. Results
3.1. Log Classification
The information from 10 different logs from the core and from downhole measurements can be summa- rized by four different trend curves (TCs), which show the deviation of the containing properties from their mean value. As these TCs show changes at same depths, but with different impacts on the parameters, we use them to distinguish between compositional variations in rocks. TC 1 contains information from gamma ray measurements (downhole), K and Rb content; TC 2 summarizes the content of Zr and Si; TC 3 combines the MSCL density readings and the Fe and Ti content; and TC 4 arises from the Al and Zn content. TC 1 and 2 show a related response along the borehole as well as TC 3 and 4, while these two groups are in general negatively correlated. P-wave velocity correlates at most depths with TC 3 but the trend is not as significant and clear as the other logs.
There are two main parameter clusters of log characteristics. One cluster describes rocks of high total gam- ma ray and high Rb, K, Zr, and Si contents, as well as low Al, Zn, Fe, Ti, and a low density (class I, pink in Figure 3 and Table 1). The other main cluster describes rocks with opposite characteristics (class V, dark gray in Figure 3 and Table 1). Down to 1,160 m core depth the logs show an alternation of predominantly classes I and V (Figure 3a). At greater depths down to 2,495 m, the negative correlation of the TCs is not as pronounced. Here, classes II and IV (yellow and light gray in Figure 3 and Table 1) show a similar pattern as rocks from class I and IV, respectively, but different values mostly in the TC 1 parameter (total gamma ray, Rb, and K content) (Figures 3c and 3e). Between 1,280 and 1800 m depth, the TCs do not correlate, which causes multiple layers of class III (Figure 3b). An overview of the logs for the entire borehole and the classes are available in the supporting information S2.
3.2. Log-Seismic Correlation
Reflections of seismic waves are caused by acoustic impedance contrasts where the seismic velocity or density, or both, of the material changes. Along the COSC-1 borehole, seismic reflections mainly occur at depths where there are peaks in velocity and density (Figure 4). The main sections with reflections in the synthetic seismogram are: (I) a group of high amplitude reflections at about 220 m, (II) a succession of three reflections at 470–550 m, (III) two reflections at 630–680 m, (IV) a number of low amplitude reflections be- tween 830 and 1,430 m, (V) three prominent reflections in 1,470–1,610 m depth, (VI) low amplitude reflec- tions between 1,830 and 2,160 m, and (VII) three very prominent reflections in 2,170–2,280 m. The correla- tion coefficient of about 0.7 between the synthetic seismogram, based on the density MSCL readings and the downhole P-wave velocity measurements, and the ZOVSP data (Krauß, 2018) shows that core-log-seismic correlation with ZOVSP data in metamorphic rocks works well (Figure 4). The correlation of the synthetic seismogram to the 3D seismic data (Hedin et al., 2016) is rather difficult (Figure 4), although the lower parts of the seismograms fit well (580–900 ms in the synthetic seismogram with a correlation coefficient of 0.449) Figure 2. The extracted source signal that was used to calculate the synthetic seismogram with the wavelet in the time (left) and frequency domain (right).
0.0 0.5 1.0
0.0 0.5 1.0
time [ms]0 -20
-40 20 40 0 80 160 240
frequency [Hz]
amplitude amplitude
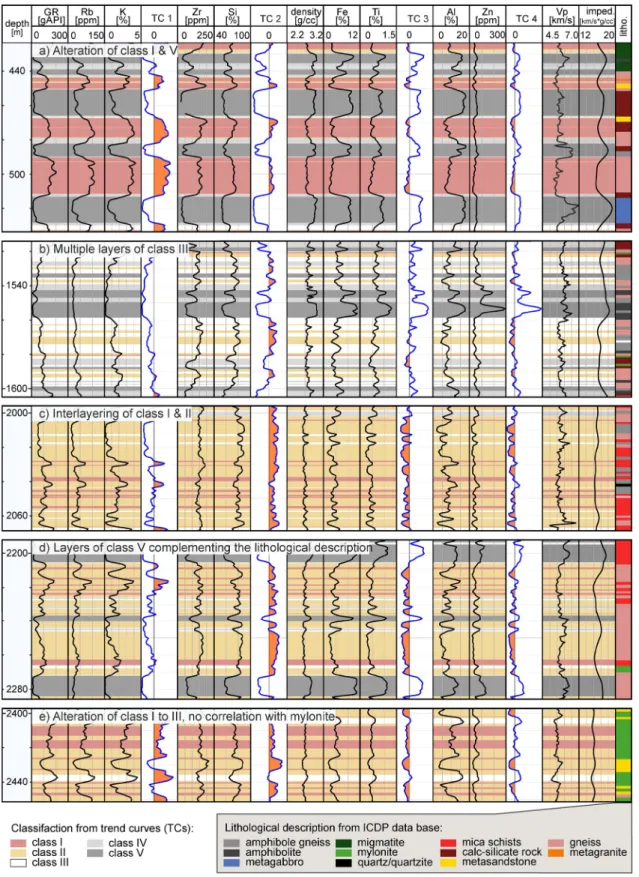
Figure 3. Sections of parameters and trend curves (TCs) that were used for the classification (left to right: total gamma ray, Rb, K, TC 1, Zr, Si, TC 2, Al, Zn, TC 3, bulk density, Fe, Ti, TC 4, P-wave velocity from sonic log, calculated impedance, scale 1:2,000): (a) from 420 to 530 m, (b) 1,520 to 1,600 m, (c) 2,000 to 2,070 m, (d) 2,200 to 2,280 m, and (e) 2,400 to 2,450 m. The classes are highlighted in the measured logs (classs I to V material with pink, yellow, white, light gray, dark gray (Table 1)) with the lithological unit description from the ICDP data base (https://www.icdp-online.org/projects/world/europe/are-jarpen-sweden/) in the right column. Due to display resolution the thickness of some lithological units may not appear at correct scale (for full resolution see overview of the logs for the entire borehole in the Figure S2).
when we shift the trace from the 3D data (inline 1,043, crossline 1,079) 65 ms up. Core-log-seismic integra- tion with the 2D seismic data (Hedin et al., 2012) is difficult (Figure 4) because the common depth point line does not directly cross the borehole (Figure 1). We evaluate the approach to bridge the gap between the borehole and the 2D data with the 3D data in the discussion.
In order to include the information from the core-log-seismic integration into the regional tectonic and geological setting, we re-evaluated the 3D seismic data (Hedin et al., 2016) that were acquired shortly after drilling. There are continuous reflections throughout the 3D seismic data in depths along the borehole and below that divide the subsurface into three units. The reflections in the upper 2.5 km are rather semi-con- tinuous as they are less continuous than at deeper levels. This could be due to imaging problems or due to structures such as boudinage. The time maps of these horizons show that the strata dip west down to 0.6 s two-way traveltime (TWT) at the location of the borehole, for example reflection H400 in Figure 5b. At about 0.6 s TWT there is a reflection (H600, Figure 5c) that we interpret to result from an unconformity as it truncates the overlying reflectors and dips east. Below 0.6 s TWT there are numerous reflections that dip east, parallel to H600. At about 1.1 s TWT below the location of the borehole there is another discordant reflection (U3) at the top of a section of parallel reflections (for example U4) that dips westward (Figure 5d).
4. Discussion
4.1. Log-Core Correlation and Its Relevance for Lithological Classification of Metamorphic Rocks Driven by significant economic benefits, the hydrocarbon industry developed sophisticated methods for the integration of geophysical and geochemical measurements with direct core observations. However, all these techniques were developed for sedimentary settings (e.g., Maureau et al., 1979). Classification of igneous and metamorphic rocks based on log responses is much more difficult than the classification of sedimen- tary rocks. They are not only characterized by their chemical and mineral composition, but also their met- amorphic grade, their texture and rheological characteristics play a much greater role for their petrological description. The complexity of igneous and metamorphic rocks and their geological genesis demand both, suitable logs and very detailed core description for each category, that is composition, texture, and metamor- phic grade. Thus, a complete classification of igneous and metamorphic rocks requires a specifically wider range of observations. One of the first landmark projects that documented the combination of core and log information in metamorphic settings was the KTB that drilled through more than 13 km of metamorphic rocks between 1987 and 1994 (Emmermann & Lauterjung, 1997). Here, Pechnig et al. (1997) distinguished log facies based on their potassium content, bulk density, and iron content to define boundaries between paragneisses, metabasites, and a heterogeneous series of partly calc-silicate bearing paragneisses-metaba- sites and alternations with former volcanoclastic sequences. The results of core-log correlation at the pilot hole allowed to define a detailed lithological column for the nearly un-cored main hole and to estimate the physical properties. A similar approach was used in the Continental Scientific Drilling Program in the Su- lu-Dabie ultra-high pressure terrane, where Konaté et al. (2017) applied cross plot and principal component analysis to various dry weight percent oxide concentration logs to characterize the lithology and derive the mineralogy. Their method allowed them to determine the different characteristics of eclogite, orthogneiss, amphibolite, and paragneiss. Other studies used physical properties for rock classification, for example in
Table 1
Parameter Characteristics of the Different Trend Curves (TCs) of Rocks From Class I to V.
The Classification is Based on the Positive (+) or Negative (-) Deviation of the TCs
Class I II III IV V
TC 1 gamma ray, Rb, K + –
chaoc paern
+ –
TC 2 Zr, Si + + – –
TC 3 density, Fe, Ti – – + +
TC 4 Al, Zn – – + +
Parameter deviation
the Sudbury basin, Canada. Here, Mahmoodi and Smith (2015) identified homogenous physical units by density, gamma radioactivity, and magnetic susceptibility measurements. They were able to correlate most classes to lithological units. Physical properties were also used at the KTB site for classification. Here, Maiti and Tiwari (2010) employed a neural network approach on density and gamma ray logs to improve the lith- ological classification. In order to gain information not only on the lithology but also on the geological his- tory of metamorphic rocks from the Outokumpu deep drill hole in Finland, Dietze and Kontny (2011) found the scattering of rock magnetic properties to be a suitable tool. When only investigating mafic rocks, Bar- tetzko et al. (2005) came to the conclusion that the physical log response is dominantly related to structural variations while variations in composition have only minor effects. All these approaches show that the right combination of logs and core description is key for a successful log-core correlation in metamorphic rocks.
At the COSC-1 borehole we used several chemical, density and P-wave logs. The on-site core description which is available in the ICDP database is a typical lithological classification that spans different categories.
It includes the lithology (ultra-mafic to felsic or calcite-rich rocks), the metamorphic grades (mainly green- schist facies) and the different textures such as mylonite or cataclasite. As some essential chemical elements such as Mg, Na, F, C, O, and H could not be detected at COSC-1 (see Section 2) an analysis similar to those Figure 4. Overview of the core-log-seismic interpretation results at COSC-1. From left to right: P-wave velocity from zero-offset vertical seismic profile (ZOVSP) measurements (Krauß, 2018) and sonic tool together with the density log from multi-sensor core logger (MSCL) (smoothed over 5 m), computed impedance and reflectivity, calculated synthetic seismogram, classification derived from the log-core correlation with the computed impedance, lithological description from the ICDP data base, the outer corridor stack of the ZOVSP (red) with the upgoing wavefield and the corridor (right of the dashed black line) (Krauß, 2018), trace 185 (red) from the 2D seismic line close to the COSC-1 site with adjacent traces (Hedin et al., 2012), traces of inline 1,043 from the 3D seismic with the closest trace to the borehole at the intersection with crossline 1,079 (red) (Hedin et al., 2016) (left to right) with the horizon H400 and H600.
The dark blue areas in the first columns indicate groups of high amplitude reflections, the light blue ones highlight groups of minor amplitude reflections.
0 250
500 750 1000 1250
1500 1750 2000 2250 2500
0 100 200 300 400 500 600 700 800 time [ms]
TVD [m]
from surface
density [g/cc]
Vp [km/s]
[(km/s)*(g/cc)]
Vp-VSP
reflectivity impedance
impedance [(km/s)*(g/cc)]
1 3
4.5 7.0 1 21
12 20
-0.1 0.2
synthetic ZOVSP NW 2D seismic SE W 3D seismic E
I
II
IV
V VI
VII III
500 m
H400 H600
mafic metamorph. rock ultramafic metamorph. rock
migmatite mylonite gneiss
calcite (vein)
metagranite cataclasite
mica schists marble
granitic rock (undiff.) metasandstone
pegmatite calc-silicate rock quartz/quartzite amphibole gneiss
amphibolite metagabbro
Lithological description from ICDP data base:
class I class III
class II class IV class V Classifaction from trend curves:
done by Pechnig et al. (1997) or Konaté et al. (2017) was not possible. Consequently, we chose a rather simple approach and formed trend curves (TCs) from logs with similar deviation for rock classification. We found, that one log from TC1 or TC2 and one from TC3 or TC4 would have been sufficient to obtain the same result, for example the combination of the gamma ray (TC1) and density log (TC3) would have been sufficient (compare Table 1).
The results from our log classification agree well for parts of the borehole with the initial lithological de- scription (Figure 3a) from the COSC-1 report (Lorenz et al., 2015a), for example the metagabbro unit at 520 m depth. At other depths, especially in the lower part of the borehole, the initial lithological descrip- tion does not pick up some very distinct changes in the log response, for example at 2,200 and 2,280 m (Figure 3d). Generally, rocks that were identified as amphibolite and metagabbro in the initial report (Lorenz et al., 2015a) correlate at many depths with class V rocks (Figure 3a), similar to the characteristics of metabasites at the KTB site, a unit of igneous origin with enriched mid-ocean ridge basalt (Pechnig et al., 1997). In both classes IV and V, the high contribution (concentration in wt%) in Fe associated with Ti and medium-high content in Si are mainly related to the mafic minerals such as pyroxene and amphibole.
Class I rocks with low Fe and high Si and K concentrations suggest felsic rocks independent of the meta- morphic grade and correlate at many depths with gneiss (Figure 3a). This is similar to the characteristics of gneisses observed by Pechnig et al. (1997). However, it is not possible to distinguish the individual rock types belonging to the felsic group and to associate each of the five classes with specific rocks from the core descriptions. Class II rocks that occur in depths greater than 1,160 m, have a high silica content whereas all other indexes are low (Figures 3c–3e). This composition points to quartz-rich rocks such as metasandstones.
The presence of Zr and Zn is associated only with secondary mineralization.
The similar responses of the different logs to lithological and compositional variations in the KTB and COSC-1 boreholes show that log data from metamorphic rocks are a powerful tool to distinguish between mafic and silica-rich rocks. The gamma ray log shows a very distinct pattern for the mafic rocks which should allow their classification from downhole measurements even when core recovery is poor, especially if downhole density data are available. The sonic log shows high velocities in the same sequences, which is typical for mafic rock (Kästner et al., 2020; Pechnig et al., 1997), but the noisy pattern does not facilitate classification without additional information. MSCL density, especially in combination with gamma ray information could support a good onsite classification before XRF data is available. In combination with a detailed compositional core description (which is unfortunately not available for the entire COSC-1 hole) Figure 5. Seismic profile through the 3D seismic survey and three maps of different horizons that show the different dips of three main intervals: (a) inline 1,044 with reflector H400, H600, U3, and U4 (from top to bottom) and the location of the COSC-1 borehole (star and orange line); (b) map of horizon H400 in the uppermost sequence that dips west, (c) map of horizon H600 that dips east and confines the second unit; (d) map of horizon U4 that dips west, represents the lowermost unit. The red line in the maps shows the location of (a), the gray line the location of the 2D seismic profile.
0.1 0.3
0.7 0.9 1.1 1.3 1.5
1020 1060 1100
COSC-1
TWT [s]
crossline inline 1044
13°11'E 13°11'E 13°11'E
13°12'E 13°12'E 13°12'E 13°13'E 13°13'E 13°13'E
63°25'N
63°24'N
63°25'N
63°24'N 63°24'N
63°25'N
0.6 0.55 0.5 0.45 0.69 0.59 0.49 1.6 1.5 1.4
TWT [s] TWT [s] TWT [s]
H400 H600 U4
0.5 H600 H400
U3 U4
(a)
(b) (c) (d)
the logs should also facilitate a distinction of classes I–IV material. In combination with previous studies, for example at KTB, such an approach could support the lithological classification of metamorphic rock also in other drilling campaigns as they provide an objective classification.
Interestingly, the mylonite sequences in the lowermost part of the borehole (Lorenz et al., 2015a) do not show a discernible response in the logs (Figure 3e). One reason is that XRF data are not diagnostic for the identification of specific textures and metamorphic grades, for example for differentiating metagabbro from amphibolite or gneiss from mica schist units. Both pairs of metamorphic rock show a similar composition with slight differences not distinguishable by XRF data alone. The physical logs, for example density and vp, do not show anomalies at depths where mylonite sequences were described along the COSC-1 borehole (Lorenz et al., 2015a), either, which is consistent with some general findings on their physical properties from the literature (e.g., Jones & Nur, 1982). As density and vp link to the seismic imaging, these mylonite properties are further discussed in Chapter 4.2. It appears that identification of mylonite as well as the distinction between metagabbro and amphibolite, and gneiss and mica schist units, as proposed in Lorenz et al. (2015a), can only be made by visual inspection based on rock texture. Therefore, it is important to have different kind of core descriptions for metamorphic cores. Chemical and physical logs are diagnostic for compositional changes and can be used for core-log correlation that refer to changes of composition, whereas changes in texture or other characteristics, such as mylonitization, might not be detectable in the physical logs.
4.2. Origin of Reflections in the Synthetic Seismogram
Seismic reflections originate from changes in seismic impedance, that is the product of density and seis- mic velocity. Several studies of seismic reflections in the continental crust suggest that seismic impedance contrasts in metamorphic settings can be caused by compositional layering, shear zones, anisotropy, and fluid-filled faults and fractures (Christensen & Mooney, 1995; Cook et al., 1988; Hurich & Smithson, 1987).
One of these factors or a combination of them may contribute to the generation of reflections.
Core-log-seismic integration in the KTB project showed that the strongest reflections originate from steeply dipping fluid-filled fractures and cataclastic fracture zones (Harjes et al., 1997) while lithological variations are also visible but play a secondary role (Rabbel et al., 2004; Szalaiová et al., 2015). Partly, this assessment may be biased as some of the seismic experiments in the KTB project were geared toward imaging this fracture networks (Harjes et al., 1997). Also, Smithson et al. (2000) showed that reflections at the Kola Superdeep Borehole in Russia (Kozlovsky & Adrianov, 1987) are caused by compositional layering, shear zones, anisotropy, and fluid-filled fractures. At the Chinese Continental Scientific Drilling borehole in the Sulu-Dabie region, reflections were correlated to ductile shear zones composed of eclogite layers in a matrix of mylonitized gneiss, and to interlayering of paragneiss, eclogite and granitic gneiss (Xu et al., 2009). In the Siljan Ring area in central Sweden, reflections were associated with dolerite sills of up to 60 m thickness which had intruded into the granitic host rock (Juhlin, 1990). In Sudbury, Milkereit et al. (1994) found indications that lithological variations are the primary cause of reflections whereas Lüschen et al. (2015) imaged different kind of fault zones within the granite pluton in the western Erzgebirge in Saxony within the Gera-Jáchymov fault zone.
At the COSC-1 drill site, first correlations of the core description to limited downhole vp and density meas- ures suggested that reflections in the upper 1,600 m might correspond to the interlayering of felsic and mafic lithologies (Hedin et al., 2016). The synthetic seismogram that we calculated for the entire borehole shows seven sequences of reflections, five of them with high amplitudes (Figure 4). The shallowest reflec- tion at about 200 m correlates with a sharp negative spike in both P-wave velocity (vp) and bulk density, followed by a strong increase in vp. High gamma ray readings and moderately high vp and density indicate that this reflection is not caused by the contrast between high-silica and mafic rocks but more likely by a greater abundance of fractures. Possibly this boundary represents the transition from weathered calc-sili- cate gneisses, containing fluid-filled fractures and micro-karst, to unaltered gneisses with mylonitic bands that cause a high amplitude reflection as proposed by Hedin et al (2016). Three rather low amplitude re- flections immediately below, down to 320 m, correlate with three maxima of P-wave velocity, minima in gamma ray and high-density values (Figure 4), which are typical for rocks with a mafic protolith, for exam- ple, amphibolite and metagabbro (Pechnig et al., 1997). A group of reflections with two main reflections
between 470 and 520 m clearly correlate with distinct layers of high density, high velocity and low gamma ray readings, similar to two reflections between 620 and 680 m (Figure 4). These strong reflections in the synthetic seismic data correspond to depths in the core where high-density mafic lenses were described (Lorenz et al., 2015a). They occur within the paragneisses and calc-silicate rocks and they become more frequent and thicker down to about 950 m. Below, down to about 1,430 m, numerous low amplitude re- flections correlate to low density and high velocity layers (Figure 4) which we interpret as mafic rocks in a metasedimentary (gneissic) background. Three prominent reflections between 1,470 and 1,610 m depth occur where the core description indicates a complicated succession of amphibolite, mylonite, gneiss, mar- ble, and mica schist (Lorenz et al., 2015a). At depths between 1,830 and 2,160 m there are a number of low amplitude reflections correlating with mafic rocks from the log classification. The three prominent reflec- tions in 2,170–2,280 m depth correlate with a strong increase in P-wave velocity and density and low gamma ray values which clearly indicates mafic rocks, although the physical properties of the middle layer of group show a less pronounced signal than the other two (Figure 4).
The impedance log calculated from the MSCL density and sonic log data shows high values in depth in- tervals where the core-log correlation defined class V sequences (Figure 4) which correlate to metagabbros and amphibolites. Therefore, the correlation coefficient of 0.7 for the match between the reflections in the synthetic seismogram and the reflections in the ZOVSP seismogram (Figure 4) suggests that most of the reflections in the synthetic seismogram and in the ZOVSP are caused by compositional layering. The cor- relation of the reflections with the compositional classes implies that rheological characteristics can only play a secondary role for seismic reflectivity unless deformation correlates with the compositional changes for which there are no indications in the initial core description. The depths of reflections do not show any correlation with the characteristics of foliation and natural fractures that have been described by Wenning et al. (2017). Nor do the similar P-wave velocity from the VSP measurements and the sonic log (Figure 4 and Kästner et al., 2020) suggest that small-scale fractures influence the seismic imaging. Only the reflection at about 200 m depth where acoustic impedance drops (Figure 4) might relate to a texture change. This is supported by low resistivity values shown by Yan et al. (2017) which are 100 times lower at this depth than at all other depths (overview of logs for the entire borehole in the Figure S2). This could be caused by fluid-filled fractures as evidenced by inflow of water at this depth (Doughty et al., 2017). There are no indi- cations that the mylonite sequences (at about 2,250–2,500 m), described by Lorenz et al. (2015a), generate any reflections (Figure 4). Giuntoli et al. (2020) showed that the shear bands originated from fracturing, followed by ductile deformation under epidote amphibolite facies conditions at around 460 to 417 Ma. Al- though Almqvist et al. (2013) predicted that textural variations along shear zones are in part responsible for seismic reflection observed in the upper and middle crust of orogens, it appears that the mylonitization at the COSC-1 borehole does not change the seismic properties in any significant way, as it does not correlate with changes in the seismic ZOVSP data or the log-derived synthetic seismic data. This is conclusive with previous studies which showed that only some mylonitic rocks with well-developed macroscopic foliation are strongly anisotropic (Jones & Nur, 1982) and with the analysis of the P-wave velocity at the COSC-1 borehole by Wenning et al. (2016) and Kästner et al. (2020). They showed that the mica schists between 1,600 and 1,900 m have an anisotropy of up to 25% whereas the anisotropy decreases at depths where the mylonite sequences were described (Figure 3e). Another factor which could explain the absence of the my- lonites in the seismic imaging is the gradual mylonitization, the thickness of this transition zone, and the ratio of the transition zone thickness to the seismic wavelength (Rey et al., 1994).
We conclude that neither the near offset ZOVSP data nor the far-offset measurements, as in 2D and 3D measurements, can image the gradual mylonitization at depths of the COSC-1 borehole. As the borehole does not penetrate the basal shear zone, we cannot exclude that strain is more localized at greater depth and causes increased mylonitization of single units or even a transition to brittle deformation causing cataclastic fracture zones comparable to KTB. Both processes could cause some of the deeper reflections that are visible in the far-offset 2D and 3D seismic measurements.
4.3. Core-Log Correlation With 2D and 3D Reflection Seismic Data and Its Implication
Detailed correlation of the 2D seismic data with the synthetic seismogram is not feasible as the common depth point binning along the 2D seismic line does not intersect with the borehole (Figure 1). To use the 3D
seismic data to bridge the gap is also complicated. Both data sets show a similar but not identical image of the subsurface along the 2D seismic profile (Figure 6), for example the different dip of reflections (e.g., at about 0.4 s) and a mismatch in two-way travel time of some strong reflectors that clearly must be the same events. Likely reasons are different horizontal resolution of the dense 2D and sparse 3D survey, scattering and side reflections in the 2D seismic data. In addition, correlation is hampered by the fact that the two data sets were processed using different velocities for the migration and challenges in obtaining optimal static corrections (Hedin et al., 2012; Juhlin et al., 2016).
The COSC-1 site is located within the 3D seismic data set, but the correlation of the seismic data with the borehole and core data is potentially more difficult than in a marine setting where core-log-seismic integra- tion is usually applied. The 3D seismic reflection data in the area were acquired using a mix of VIBSIST, a rock breaking hydraulic hammer, and explosives as seismic source (Hedin et al., 2016). Hence, the source signal is not identical for each shot, hampering extraction of quantitative information from the amplitudes of the seismograms. In addition, there were some challenges in the data processing (Hedin et al., 2016).
Rugged topography, varying surface conditions, complex near surface geometries, and limited acquisition over the structurally and lithologically complex unit made the static corrections the biggest challenge dur- ing the processing stage of the COSC-1 3D data set. As an accurate static correction is essential for the processing, for example stacking, possible discrepancies could decrease the quality of the seismic image and shift the depth of the reflectors. Krauß (2018) showed that the implementation of velocities from the borehole seismic measurements into the depth conversion of the 3D seismic data adjusts the position of Figure 6. Comparison of 2D and 3D seismic data in relation to the COSC-1 borehole: (a) Inline 1,043 through the COSC-1 borehole (orange) crossing the 2D profile (red) with an overview map (legend in Figure 1) that shows the location of a–c; (b) part of the 2D profile that crosses inline 1,043 (red) and resembles the 3D seismic data from (c), a digitized section of the 3D data set along the 2D profile, crossing inline 1,043 (red).
0.1
0.3
0.5
0.7
0.9
1.1
1.3
1020 1060 COSC-12D profile1100 1055 1041
TWT [s]
crossline inline
inline 1043 0.1
0.3
0.5
0.7
0.9
1.1
1.3
TWT [s]
140shot point 220 260 180
inline 1043
400 m 400 m
crossline 1107 1070
400 m
(a)
2D profile 3D data along
2D profile b)
COSC-1 b & c a
example for different dip crossline
inline 1043
(b) (c)
reflections to the ones in the ZOVSP data. P-wave velocity anisotropy, in particular the mica schist and am- phibolites (Kästner et al., 2020; Simon et al., 2017; Wenning et al., 2016), could affect the quality of the seis- mic data, too. Furthermore, Wrona et al. (2020) showed that the dip of reflectors and the noise level hamper the recognizability of multiple, sub-parallel, inclined reflections, converging reflections and cross-cutting reflections in seismic imaging. These challenges of data acquisition and processing can explain the mis- match of the synthetic seismogram with the 3D seismic data at the location of the borehole (inline 1,043, crossline 1,079; Figure 4), especially in the upper part of the borehole. This mismatch and the improvement of the depth conversion by Krauß (2018) demonstrate the importance of borehole seismic measurements and their implementation in the 3D seismic processing. Nevertheless, we can assign different seismic reflec- tions to changes in lithological units in the borehole and interpret them qualitatively.
Provided that we shift the 3D seismic data up, we can link three reflection groups of the synthetic seismo- gram to the 3D seismic. The two reflection sequences at about 0.6 and 0.7 s in the 3D seismic data probably correspond to reflection group V and VI in the synthetic seismogram, respectively (Figure 4). Whereas the reflection at about 0.7 s is difficult to track through the entire 3D data, the reflection at about 0.6 s follows a discordance that divides the east dipping upper strata from the west north-west dipping strata below (Figure 5). The high amplitude reflections in the 3D seismic at about 0.85 s correspond to the three very prominent reflections of group VII in the synthetic seismogram (Figure 4) that we interpret as mafic rock at 2,170–2,280 m depth (Figure 3). This sequence of reflections was interpreted as a basal shear zone by Hedin et al. (2016). As the reflections that corresponds to this mafic sequence dip similar as the reflections below down to about 1.1 s (Figure 5), for example reflector U3 in Hedin et al. (2016), we propose that they belong to one tectonic unit. We interpret the discordant reflector U3 below the borehole as the transition to the Lower Allochthon as its cuts the reflectors above (Figure 5) and projects to the surface in the vicinity of the boundary between the Lower Seve Nappe and the Lower Allochthon (Figure 7).
We conclude that the Seve Nappe Complex consists of two packages of reflectors that dip in opposite direc- tion meeting or merging with each other at about 1,500 m depth at the borehole (Figure 5a). The Middle Allochthon rocks extend down to reflector U3, interpreted as a shear zone where the unit was over-thrusted onto the Lower Allochthon. Under this assumption, the actual shear zone extends below the bottom of the COSC-1 borehole and the metasandstone that was reported at the bottom of the cored section (Lorenz et al., 2015a) indicates folding within the Seve Nappe Complex. The proximity of the lower part of the core to the basal shear zone and folding above the shear zone have likely caused the mylonite bands that increase downward in frequency and thickness (Lorenz et al., 2015a), implying increasing strain at this depth.
The correlation of ZOVSP data with the core log derived synthetic seismogram shows that seismic reflec- tions in the Seve Nappe Complex are mostly caused by mafic rocks as amphibolite and metagabbro. The continuous reflections in the 2D and 3D seismic data indicate that these amphibolites and metagabbros are not just meter-scale lenses but must be caused by geological structures that are at least several hundred meters wide. Although the reflections in the 2D and 3D seismic data can be observed laterally for several hundreds of meters there are gaps in these reflections. Given the moderate seismic data quality, compared to seismic data from sedimentary basins, it is not possible to judge if the gaps are the result of imperfect imaging or if they represent real gaps in the geological units. The COSC-1 core shows geological structures such as numerous fractures and folds on a cm-scale indicating compression. On the outcrop-scale there are folds that are several meters high, but we note that the seismic data do not provide evidence for folding on seismic scales, that is tens of meters. Some of the amphibolites in the outcrops are segmented, forming bou- dins, indicating a contrast in competence of amphibolites and the weaker, more ductile, metasedimentary rocks (cf. Figure 3 in Hedin et al., 2016). Both the core and outcrop observations provide evidence for the complex structural history of the Seve Nappe. Nevertheless, the fact that the amphibolite reflections align for hundreds of meters shows the large lateral extent of the mafic lenses in the former sedimentary matrix and suggests that the ultrabasic, basic and intermediate metamorphic rocks in the geological map (Figure 1) are connected and correspond to these geological structures. It is possible that the gaps in the reflections really represent gaps between the boudinage structures, but the seismic data are not conclusive.
Since none of the outcrop studies, the core observations, nor the seismic data show evidence of seismic-scale folding for intervals in which amphibolites are present, we conclude that the frequent inter-layering of metasediments and amphibolite must reflect the original composition of the sedimentary basin before it
underwent metamorphism and later nappe emplacement. This strongly suggests that they represent mag- matic intrusions or extrusive volcanic rocks. The latter is less likely because some of the amphibolite lay- ers are rather thin and separated by thick metasediments which is atypical for extrusive volcanic settings.
Because volcanic passive margins are the most common geological setting in which sediment basins are intruded by mafic intrusions (e.g., Menzies et al., 2002), we interpret the original depositional setting of the Seve Nappe Complex as a remnant of a volcanic passive margin, which supports previous studies (e.g., Andréasson, 1994; Claesson & Roddick, 1983). This fits well with the fact that it was located further west and experienced a higher-grade metamorphic overprint than the Särv Nappe. This would be expected if it was the westernmost continental part of the proto-Atlantic volcanic rifted margin. Our interpretation that the Seve Nappe Complex origins form a volcanic passive margin is also consistent with a minimum age of 417 ±9 Ma for the metamorphic overprint derived by Giuntoli et al. (2020) (and references therein).
5. Conclusion
Our approach to correlate log, core and various seismic data in a metamorphic setting at the COSC-1 drill site in the Scandinavian Caledonides is a good example showing that this method works well with ZOVSP data in metamorphic rocks, even though the methodology was originally developed for sedimentary basins in the hydrocarbon industry. Major difficulties in core-log-seismic integration are caused by challenges in the acquisition and processing of land seismic data over hard rock areas. We show that log data analysis on metamorphic rocks is a powerful tool to distinguish between mafic and felsic rock, even when common petrological and geochemical classifications as ACF diagrams are not applicable. Especially gamma ray data Figure 7. 3D model with the 2D seismic line and inline 1,043 from the 3D seismic data set that crosses the COSC-1 drill site with the geological map (after the 1:250 000 scale geological map by the Geological Survey of Sweden), location of seismic lines in Figure 1.
show a very distinct pattern for the mafic rocks and enable, ideally with density data, their classification from downhole measurements even in cases where core recovery is poor. Further information from XRF data might allow a detailed log classification although texture and metamorphic grade cannot be derived without a more comprehensive core description that provides information on these characteristics. The results from our study, in the context of the regional geology, indicate that reflections in the Lower Seve Nappe are caused by compositional layering. This means layering of mafic and high-silica rocks, rather than representing structural changes such as shear zones, anisotropy or fluid-filled faults and fractures as observed for example in the Kola and KTB boreholes. The reflections in the Seve Nappe Complex are largely continuous in the 2D and 3D seismic data sets and represent amphibolites and metagabbros. This apparent continuation raises the question if the lenses of amphibolite in the geological map might be more connect- ed than they appear in the field. The lenses probably represent magmatic intrusions and we interpret the Seve Nappe Complex as a remnant of a volcanic passive margin. It appears that in spite of the metamorphic overprint around 417 ± 9 Ma, the original configuration of the volcanic passive margin is partly preserved in the Seve Nappe Complex and that it outlasted continent-continent collision, including the nappe emplace- ment. Thus, a careful integration of borehole and three-dimensional geophysical data can image litholog- ical changes that can then be extrapolated in three dimensions using 3D seismic data to arrive at a better understanding of the composition and geometry at mid-crustal levels.
Data Availability Statement
The log data are available through the ICDP online repository (https://www.icdp-online.org/projects/world/
europe/are-jarpen-sweden/), the VSP data are available in the GFZ Data Service (https://doi.org/10.5880/
GFZ.4.2.2020.010). We thank Uppsala University for providing the 2D and 3D seismic data that were first published by Hedin et al. (2012; 2016). We thank IHS for providing the Kingdom software through their University Grant Programs, Schlumberger for providing the TechLog software and CGG-GeoSoftware for providing the Hampson-Russell tools used in this project.
References
Almqvist, B. S. G., Hirt, A. M., Herwegh, M., Ebert, A., Walter, J. M., Leiss, B., & Burlini, L. (2013). Seismic anisotropy in the Morcles nappe shear zone: Implications for seismic imaging of crustal scale shear zones: Tectonophysics, 603, 162–178, https://doi.org/10.1016/j.
tecto.2013.05.025
Andréasson, P. G. (1994). The Baltoscandian margin in neoproterozoic-early palaeozoic times. Some constraints on terrane derivation and accretion in the Arctic Scandinavian Caledonides. Tectonophysics, 231(1–3), 1–32. https://doi.org/10.1016/0040-1951(94)90118-X Arndt, N. T., & Goldstein, S. L. (1989). An open boundary between lower continental crust and mantle: Its role in crust formation and
crustal recycling. Tectonophysics, 161(3–4), 201–212. https://doi.org/10.1016/0040-1951(89)90154-6
Bartetzko, A., Delius, H., & Pechnig, R. (2005). Effect of compositional and structural variations on log responses of igneous and metamorphic rocks. Geological Society, London, Special Publications. https://doi.org/10.1144/GSL.SP.2005.240.01.19
Christensen, N. I., & Mooney, W. D. (1995). Seismic velocity structure and composition of the continental crust: A global view. Journal of Geophysical Research, 100(B6), 9761–9788. https://doi.org/10.1029/95JB00259
Claesson, S., & Roddick, J. C. (1983). 40Ar/39Ar data on the age and metamorphism of the Ottfjället dolerites, Särv Nappe, Swedish Cale- donides. Lithos, 16(1), 61–73. https://doi.org/10.1016/0024-4937(83)90035-X
Cook, F. A., Green, A. G., Simony, P. S., Price, R. A., Parrish, R. R., Mikereit, B., Gordy, P. L., et al. (1988). Lithoprobe seismic reflection structure of the Southeastern Canadian Cordillera: Initial results. Tectonics, 7(2), 157–180. https://doi.org/10.1029/TC007i002p00157 Dietze, F., & Kontny, A. (2011). A study of rock magnetic properties of serpentinites from the Outokumpu Deep Drill Hole. Finland: Geological
Survey of Finland, Special Paper.
Doughty, C., Tsang, C.-F., Rosberg, J. E., Juhlin, C., Dobson, P. F., & Birkholzer, J. T. (2017). Flowing fluid electrical conductivity logging of a deep borehole during and following drilling: Estimation of transmissivity, water salinity and hydraulic head of conductive zones.
Hydrogeology Journal, 25( 2), 501–517. https://doi.org/10.1007/s10040-016-1497-5
Emmermann, R., & Lauterjung, J. (1997). The German Continental Deep Drilling Program KTB: Overview and major results. Journal of Geophysical Research, 102(B8), 18179–18201. https://doi.org/10.1029/96JB03945
Fowler, A., & Osman, A. F. (2009). The Sha’it-Nugrus shear zone separating Central and South Eastern Deserts, Egypt: A post-arc collision low-angle normal ductile shear zone. Journal of African Earth Sciences, 53(1–2), 16–32. https://doi.org/10.1016/j.jafrearsci.2008.07.006 Gee, D. G., Juhlin, C., Pascal, C., & Robinson, P. (2010). Collisional orogeny in the Scandinavian Caledonides (COSC). GFF, 132(1), 29–44.
https://doi.org/10.1080/11035891003759188
Giuntoli, F., Menegon, L., Warren, C. J., Darling, J., & Anderson, M. W. (2020). Protracted shearing at midcrustal conditions during large- scale thrusting in the Scandinavian Caledonides. Tectonics, 39(9), e2020TC006267. https://doi.org/10.1029/2020TC006267
Hacker, B. R., Kelemen, P. B., & Behn, M. D. (2015). Continental Lower Crust. Annual Review of Earth and Planetary Sciences, 43, 167–205.
https://doi.org/10.1146/annurev-earth-050212-124117
Harjes, H. P., Bram, K., Dürbaum, H. J., Gebrande, H., Hirschmann, G., Janik, M., et al. (1997). Origin and nature of crystal reflections:
Results from integrated seismic measurements at the KTB superdeep drilling site. Journal of Geophysical Research: Solid Earth, 102(B8), 18267–18288. KTBHOLE1. https://doi.org/10.1029/96JB03801@10.1002/(ISSN)2169-9356
Acknowledgments
This research has received funding by the German Research Council (DFG SPP-1006). COSC-1 was drilled with the Swedish national research infrastruc- ture for scientific drilling, Riksriggen, and was co-financed by the Interna- tional Continental Scientific Drilling Program (ICDP) and the Swedish Research Council (VR, grant 2013–94).
Lund University, Sweden and the ICDP Operational Support Group conducted the downhole logging measurements at the COSC-1 drill site. The core was scanned onsite by the COSC-1 science team using the standard Geotek multi-sensor core logger (MSCL-S, provided by the ICDP) and after drilling using the Minalyze CS XRF scanner at Minalyze AB in Göteborg, Sweden.
We thank Iwona Klonowska, Wolfgang Rabbel, and Rüdiger Giese for their constructive and fruitful discussion during the manuscript preparation.
The manuscript benefitted greatly by constructive reviews by Haakon Fossen and an anonymous reviewer. Open Access funding enabled and organized by ProjektDEAL.