Graphene as
a sensor material
Dissertation zur Erlangung des Doktorgrades der Naturwissenschaften (Dr. rer. nat.)
der Fakult¨at Chemie und Pharmazie der Universit¨at Regensburg
Deutschland
vorgelegt von
Sven Kochmann
aus K¨othen (ST) im M¨arz 2013
Die Arbeit wurde angeleitet von Prof. Otto S. Wolfbeis.
Promotionsgesuch eingereicht am: 6. M¨arz 2013 Kolloquiumstermin: 8. Mai 2013
Vorsitzender: Prof. Dr. Joachim Wegener Erstgutachter: Prof. Dr. Otto S. Wolfbeis Zweitgutachter: Prof. Dr. Bernhard Dick
Drittpr¨ufer: Prof. Dr. Christian Sch¨uller
Prof. Dr. Reinhard Hoffmann, July 27, 2012 Seminar “Good scientific practice”, Universit¨at Regensburg
Contents
1 Introduction 1
1.1 The history of graphene . . . 1
1.2 Classification . . . 3
1.2.1 Definition of graphene . . . 3
1.2.2 The graphene family . . . 5
1.2.3 Classification of graphene species . . . 7
1.3 Motivation and aim of work . . . 8
1.4 Abbreviations, acronyms and terms . . . 9
1.5 References . . . 11
2 Graphenes in chemical sensors and biosensors 17 2.1 Overview . . . 17
2.2 Plain sensors . . . 18
2.3 Nanocomposite sensors . . . 21
2.3.1 Electro-chemical sensors . . . 21
2.3.2 Field effect transistor-based sensors . . . 36
2.3.3 Fluorescence sensors . . . 39
2.3.4 Chemiluminescence sensors . . . 42
2.3.5 Colorimetric sensors . . . 45
2.4 Benefits of (reduced) graphene oxide . . . 47
2.5 References . . . 48
3 Materials and methods 69 3.1 Chemicals and materials . . . 69
3.1.1 Sources and safety . . . 69
3.1.2 Graphene oxide, GO . . . 69
3.1.3 Reduced graphene oxide, rGO . . . 70
3.1.4 Azido graphene oxide, N3-GO . . . 70
3.1.5 Graphene oxide ethyl ester, GOEE . . . 71
3.1.6 Britton-Robinson buffers . . . 71
3.2 Instrumentation . . . 72
3.3 References . . . 73
4 Characterization of materials 75 4.1 Overview . . . 75
4.2 Dispersion vs. solution . . . 76
4.3 Graphene oxide . . . 77
4.3.1 Properties of graphite oxide (solid) . . . 77
4.3.2 Elementary analysis (CHNX) . . . 78
4.3.3 UV/VIS absorption spectroscopy . . . 80
4.3.4 Infrared spectroscopy . . . 81
4.3.5 Electron microscopy . . . 82
4.3.6 pH titration . . . 83
4.3.7 Piece together the puzzle . . . 86
4.4 Reduced graphene oxide . . . 89
4.4.1 Properties of reduced graphite oxide (solid) . . . 89
4.4.2 Elementary analysis (CHNX) . . . 90
4.4.3 UV/VIS absorption spectroscopy . . . 91
4.4.4 Infrared spectroscopy . . . 91
4.4.5 Electron microscopy . . . 92
4.4.6 pH titration . . . 93
4.4.7 Piece together the puzzle . . . 95
4.5 References . . . 97
5 Raman spectroscopy of (reduced) graphene oxide 99 5.1 Overview . . . 99
5.2 Pristine graphene . . . 99
5.3 Graphene oxide . . . 100
5.4 Size of crystallites . . . 103
5.5 pH-dependent Raman spectra . . . 105
5.6 References . . . 107
6 Fluorescence of graphene oxide 111
6.1 Overview . . . 111
6.2 Fluorescence in the near-UV and visible range . . . 111
6.3 Discussion . . . 114
6.4 References . . . 116
7 Synthesis mechanisms of (reduced) graphene oxide 119 7.1 Overview . . . 119
7.2 Graphene oxide . . . 121
7.2.1 Detailed synthesis . . . 121
7.2.2 Mechanism . . . 123
7.3 Reduced graphene oxide . . . 132
7.3.1 Detailed synthesis . . . 132
7.3.2 Mechanism . . . 133
7.4 Conditioning methods . . . 136
7.4.1 Dialysis . . . 136
7.4.2 Size-exclusion chromatography . . . 138
7.4.3 Centrifugation . . . 139
7.4.4 Capillary electropheresis . . . 140
7.5 References . . . 143
8 Sensor applications 149 8.1 Overview . . . 149
8.2 Gas sensor for NO2 . . . 150
8.3 Surface plasmon resonance affinity sensor for amines . . . 151
8.4 References . . . 154
9 Conclusion and outlook 155
10 Summary 159
11 Curriculum vitae 161
12 Eidesstattliche Erkl¨arung 165
1 Introduction
1.1 The history of graphene
In 2004,Andre K. Geim andKonstantin S. “Kostya” Novos¨elovpublished their results from one of their “Friday night experiments”[1,2]. The very first idea was to prepare graphite films as thin as possible to study potential electric field effects and other properties. Their first attempts with a polishing machine to produce thin graphite films were quite unsuccessful. Oleg Shklyarevskii, an expert in scanning tunneling mi- croscopy, prompted the use of adhesive tape to access much smaller pieces of graphite.
With this technique Geim and Novos¨elov were the first to isolate a single layer flake from graphite by mechanical exfoliation. That was the birth of the famous “Scotch tape method”[3]. In 2010, both received the Nobel prize in physics for their work on graphene.
AlthoughGeim andNovos¨elovare credited with founding this new interesting research area in 2004, some of the pioneering work was done as early as 145 years before. In 1859, Benjamin Brodie examined the reaction of graphite with strong oxidation agents such as chlorates[4]. He described the product in the following way:
The substance has the following properties. It is insoluble in water containing acids or salt, but is very slightly soluble in pure water. The crystals, placed upon litmus paper, have a feeble acid reaction. [...] When a solution of sulphide of ammonium or of potassium is poured upon the dry substance, a crackling sound is heard, and a body is ultimately formed possessing the metallic lustre and general appearance of graphite itself.
Due to these properties he labeled the materialgraphitic acid (not to be confused with mellitic acid which is now referred to graphitic acid) and calculated a sum formula of C11H4O5 (C/O ratio: 2.2). Retrospectively, it is clear that Brodie prepared the first
sample of graphene oxide[2].
However, there is a drawback to this approach. As mentioned before, chlorate was used as oxidation agent and therefore large quantities of ClO2 gas were generated during the reaction. Due to this and in combination with the heating, explosions routinely occurred. An improved method was developed by L. Staudenmaier in 1898[5]. His method rendered the heating step obsolete. Simultaneously, he reduced the reaction time by introducing sulfuric acid into the mixture of nitric acid and potassium chlorate used by Brodie. Finally, in 1958, Hummers and Offeman published their famous method on the preparation of graphitic oxide without chlorate, using permanganate instead[6]. The procedure continued to evolve today[7–9].
It is interesting to note that typical batches were produced in significantly different quantities at that time, compared to today. For instance, Staudenmaier started with 25 g of graphite and added the large quantity of 450 g potassium chlorate. Hummers andOffeman used 100 g of graphite and 300 g of potassium permanganate. Given that today’s batches are of much smaller quantities[7–9]. This indicates that both methods are scalable up to at least this magnitude.
Nearly 90 years afterBrodie’spaper, Ruess and Vogt published the first evidence that graphene consists of individual plates[10]. They used transmission electron microscopy to examine the deflagration process of graphene oxide and found “thin, flat bodies which resemble creased paper sheets”. The work was continued by Boehm et al. who also suggested to label this material as “graphene”[11,12]. The term is a combination of graphite and the suffix that refers to aromatic hydrocarbons such as benzene or anthracene[2,12,13]. During this time, first preparations of epitaxial graphene (“graphitic carbon”) on metal[14–16] and insulating substrates[17] were reported.
The first single layer flake prepared by Geim and Novos¨elov set off an avalanche of interest and publications on the topic of graphene. Graphene gained popularity due to its large thermal conductivity (3 000 W m-1 K-1), exhibiting the quantum Hall effect at room temperature[18], having the highest possible surface-to-volume ratio (2 600 m2 g-1), its high electron transfer rate (up to 200 000 cm2 V-1 s-1)[19], its interesting mechanical properties[20,21], its exceptional thermal stability[22], and the
possibility of high-sensitive detection[23,24]. Given these properties, graphene is an attractive candidate in analytical chemistry, e.g. for biomedical applications[25]. Since 1859, many methods for preparation of graphene have been developed. In ad- dition to mechanical exfoliation[1], graphene materials may be obtained by thermal decomposition on SiC wafers[26], chemical vapor deposition[27], or chemical synthe- sis[4–6,9,28–32]. The resulting nanomaterials have been characterized by a broad range of optical[33–38], electrical[1,18,19,39], mechanical[8,40,41] and other methods[42–44].
Unfortunately, many of the materials synthesized have not been properly classified.
Each preparation method or even a slight modification of one parameter within in the same method results in “graphenes” which differ in terms of chemical structure, shape, size, number of layers and therefore, in their properties. This problem was previously addressed[13], but remains unresolved. It is therefore critical to first classify graphene materials before associating the materials with any application.
1.2 Classification
1.2.1 Definition of graphene
A collective definition of graphenes does not yet exist. Moreover, related terms are often confused, e.g. graphite oxide and graphene oxide. Let us first have a look at the term “graphene”. Most authors describe (rather than define) graphene as a material
“which consists of a single atomic sheet of conjugated sp2 carbon atoms”[45] or the like[39,46–48]. IUPAC defines graphene as “a single carbon layer of the graphite structure, describing its nature by analogy to a polycyclic aromatic hydrocarbon of quasi infinite size”[49]. Recently, Chen et al. made another suggestion, that sheets of polyaromatic hydrocarbons exceeding 100 nm in both directions should be called “graphene”[29]. However, these definitions are missing two important features of graphenes. These are (a) its metallic nature (i.e. the lack of a band gap)[1] and (b) the fact that it should consist of carbon and hydrogen only, in the ideal case. The latter is particularly striking
when looking at literature data for the elemental composition of many graphenes.
Fractions of up to 30% of oxygen have been reported which is in clear contradiction to the definitions previously cited.
The smallest possible aromatic structure that matches the definitions is a symmetrical flake of 864 C-atoms, with an edge length of 2.9 nm, an area of 22 nm2(see Figure 1.1), with effectively no band gap[50,51]. Hence, this structure could be the smallest graphene flake possible but is only a suggestion, of course.
Figure 1.1. Suggested smallest graphene structure: a symmetrical flake of 864 C atoms with an edge length of 2.9 nm and an area of 22 nm2 with effectively no band gap. There are 11 additional rings around the center benzene ring (red). The purple border marks the dimensions of the famous 222 C atoms graphite sheet prepared at the workgroup ofKlaus M¨ullen[52].
1.2.2 The graphene family
Several materials related to graphene are known. They have been obtained in synthesis routes towards graphene. These include graphite oxide, graphene oxide and reduced graphene oxide. This thesis referres to these materials as members of the “graphene- family” that can be best described by the oxidation level of carbon and the number of layers. Other (high-level) properties (e.g. conductivity or photoluminescence) depend on these factors which makes this kind of categorization very useful.
Figure 1.2 illustrates a classification scheme of the graphene-family and the possible routes from one material to another. Even the precursor materials, silicon carbide and methane, fit into this scheme. “Top-down” synthesis routes run from top left to bottom right, i.e. they start with a bulk material such as graphite or graphite oxide. The nanomaterial is obtained by stepwise structural decomposition such as from graphene oxide via reduced graphene oxide to graphene. The mechanical exfoliation route, for example, leads from graphite (left) via layer-by-layer decomposition, resulting in graphene (right). Both materials are placed on the same level on the ordinate, because the oxidation level of carbon does not change during this process. In contrast, the
“bottom-up” methods run from bottom right to top left because the materials are assembled layer-by-layer. For example, large areas of graphene can be constructed by chemical vapor deposition of methane which has a lower oxidation level than graphene.
It does not possess a layer structure and thus it is shifted to the bottom right relative to graphene.
This classification is also a useful starting point for making definitions because the individual materials can be distinguished by oxidation state and the number of layers.
Therefore, this thesis suggests and uses the definitions given in Section 1.2.3. In the following, these definitions are used even if a cited publication itself labels them otherwise.
The exaggerated use of acronyms in the literature, all referring to the same materials, is notable. Examples are CRGO, GO, RGO, GR, G, GNS, EG, GNP, CCG, GE, GP, ERGO, GF, EGO, GS, GN, TRGO, CMG, FG, ERGNO, CRGNO, and the like. This allows for a high risk of confusion (e.g. GO may stand for graphite oxide or graphene
Figure 1.2. Classification of graphene family materials (also see Section 1.2.2). Routes: (1) Oxidation of graphite to graphite oxide according to the Hummers, Staudenmeier or Brodie method[28]. (2) Stepwise exfoliation of graphite oxide to give graphene oxide in aqueous colloidal suspensions by sonication and stirring[28]. (3) Reduction of graphene oxide by chemical reactions[28], thermal annealing[53], flash reduction[54], enzymatic reduction[55] or electrodeposition[32]. (4) Mechanical exfoliation of graphite to give graphene (tape method)[2]. (5) Oxidation of graphene sheets to graphene oxide. (6) Thermal decomposition of a SiC wafer[26]. (7) Growth of graphene films by chemical vapor deposition[27]. (8) Total synthesis routines with precursor molecules[29,52,56,57]. Group A includes graphene materials primarly used for their electronic properties, group B for their optical properties.
oxide). In my opinion the words “graphite” and “graphene” are short enough and do not require an acronym. Hence, in this work confusing acronyms are avoided for graphene materials. All acronyms, abbreviations and terms used in this work are listed in Section 1.4.
1.2.3 Classification of graphene species
Table 1.1 shows definitions of the various graphene family materials as they are used in this thesis. They are based on the suggested defintions and classifications in the previous sections.
Table 1.1. Classification of graphene species as used in this work
Material Definition
Graphene Exactly one layer of a polycyclic aromatic hydrocarbon network, with all carbon atoms hexagonally arranged in a planar condensed ring sys- tem. It has a metallic character and consists solely of carbon and hydrogen.
Graphene oxide Exactly one layer of a polycyclic hydrocarbon network, with all carbon atoms hexagonally arranged in a planar condensed ring system. It has various oxygen functional groups (CO, OH, COOH) and is partially aromatic. It possesses a band gap greater than 1.5 eV. The band gap depends on its oxidation level. The C:O ratio is between 2 and 3.
Reduced graphene oxide (rGO) Exactly one layer of a polycyclic hydrocarbon network, with all carbon atoms hexagonally arranged in a planar condensed ring system. It has an oxygen fraction of around or below 10%. It is mostly aromatic and resembles graphene in terms of electrical, thermal and mechanical properties.
Graphite “An allotropic form of the element carbon consisting of layers of hexa- gonally arranged carbon atoms in a planar condensed ring system. The layers are stacked parallel to each other in a three-dimensional crys- talline long-range order. There are two allotropic forms with different stacking arrangements, hexagonal and rhombohedral. The chemical bonds within the layers are covalent with sp2 hybridization and with a C-C distance of 141.7 pm. The weak bonds between the layers are metallic with a strength comparable to van der Waals bonding only.”[49]
Graphite oxide A heterogenous material prepared by the oxidation of graphite. It can be described as an assembly of many layers of graphene oxide.
1.3 Motivation and aim of work
Several proof of principle and analytical concepts do exist (see Chapter 2) which suggest graphene materials being extremely valuable tools for sensor applications.
The chemically derived variants, i.e. (reduced) graphene oxide, provide additional benefits such as: processing in solutions, higher sensitivies for particular analytes, and attraction and discrimination effects, as compared to pristine graphene (see Section 2.4 for a complete list). As such, this thesis is concerned with (reduced) graphene oxide only.
Thus far, the materials themselves and their synthesis were only superficially examined.
Although very little detail about the mechanism and structure is known[58], many pictured structure models may imply otherwise. However, “knowing your material” is mandatory for optimal utilization, specific modifications and applications.
Hence, the intention of the thesis is to fill this gap by outlining the benefits of (reduced) graphene oxide, characterizing both materials in detail and extensively investigating the procedure and mechanism of the syntheses.
1.4 Abbreviations, acronyms and terms
GO Graphene oxide
rGO Reduced graphene oxide
(r)GO Both graphene oxide and reduced graphene oxide
AFP α-fetoprotein
ATP Adenosine-5’-triphosphate
BRCA1 Breast cancer type 1 susceptibility gene/protein CEA Carcinoembryonic antigen
DFT Density functional theory
DNA Desoxyribonucleic acid, ssDNA single stranded DNA,dsDNA double stranded DNA
EGFR Epidermal growth factor receptor ELISA Enzyme-linked immunosorbent assay FET Field-effect transistor
ECL Electrochemiluminescence or electrogenerated chemiluminescence EDC 1-Ethyl-3-(3-dimethylaminopropyl)carbodiimide
EEM excitation/emission matrix GCE Glassy carbon electrodes GOx Glucose oxidase
H2O↓ “unfree” water; water which is immediately absorbed, e.g. by sulfuric acid
HeLa type of cervical cancer cells; termed afterHenrietta Lacks HER2 Human epidermal growth factor receptor 2
HRP Horseradish peroxidase
ICP-OES Inductively coupled plasma optical emission spectrometry ICP-MS Inductively coupled plasma mass spectrometry
IgG Immunoglobulin G
ITO Indium tin oxide (electrode) LOD Limit of detection
K562 Type of leukemia cells
MCF-7 Type of breast cancer cells; termed afterMichigan Cancer Foundation MDA-231 Type of breast cancer cells; termed afterM.D. Anderson
NADH Nicotinamide adenine dinucleotide NHS N-Hydroxysuccinimide
NIH-3T3 Type of fibroblast cells; termed afterNational Institutes of Health
FRET F¨orster resonance energy transfer PB Prussian blue
PET Poly(ethylene terephthalate) PSA Prostate specific antigen
QDs Quantum dots
SEC Size exclusion chromatography SCE Saturated calomel electrode SPR Surface plasmon resonance SWCNT Single walled carbon nanotubes TEM Transmission electron microscopy TGA Thermogravimetric analysis TMB Tetramethylbenzidine TNT 2,4,6-Trinitrotoluene WHO World Health Organization XPS X-ray photoelectron spectroscopy
1.5 References
[1] K. S. Novos¨elov, A. K. Geim, S. V. Morozov, D. Jiang, Y. Zhang, S. V. Dubonos, I. V. Grigorieva, and A. A. Firsov. Electric Field Effect in Atomically Thin Carbon Films. Science, 306(5696):
666–669, 2004. doi: 10.1126/science.1102896.
[2] A. K. Geim. Nobel Lecture: Random walk to graphene.Rev. Mod. Phys., 83(3):851–862, August 2011. doi: 10.1103/RevModPhys.83.851.
[3] A. K. Geim. Graphene: Status and Prospects. Science, 324(5934):1530–1534, June 2009. doi:
10.1126/science.1158877.
[4] B. C. Brodie. On the Atomic Weight of Graphite. Philos. Trans. R. Soc. London, 149:249–259, January 1859. doi: 10.1098/rstl.1859.0013.
[5] L. Staudenmaier. Verfahren zur Darstellung der Graphits¨aure. Ber. Dtsch. Chem. Ges., 31(2):
1481–1487, 1898. doi: 10.1002/cber.18980310237.
[6] W. S. Hummers and R. E. Offeman. Preparation of Graphitic Oxide. J. Am. Chem. Soc., 80 (6):1339–1339, March 1958. doi: 10.1021/ja01539a017.
[7] G. Eda, G. Fanchini, and M. Chhowalla. Large-area ultrathin films of reduced graphene oxide as a transparent and flexible electronic material. Nat. Nano, 3(5):270–274, May 2008. doi:
10.1038/nnano.2008.83.
[8] D. A. Dikin, S. Stankovich, E. J. Zimney, R. D. Piner, G. H. B. Dommett, G. Evmenenko, S. T.
Nguyen, and R. S. Ruoff. Preparation and characterization of graphene oxide paper. Nature, 448(7152):457–460, July 2007. doi: 10.1038/nature06016.
[9] S. Stankovich, D. A. Dikin, R. D. Piner, K. A. Kohlhaas, A. Kleinhammes, Y. Jia, Y. Wu, S. T.
Nguyen, and R. S. Ruoff. Synthesis of graphene-based nanosheets via chemical reduction of ex- foliated graphite oxide. Carbon, 45(7):1558–1565, June 2007. doi: 10.1016/j.carbon.2007.02.034.
[10] G. Ruess and F. Vogt. H¨ochstlamellarer Kohlenstoff aus Graphitoxyhydroxyd.Monatsh. Chem., 78(3):222–242, 1948. doi: 10.1007/BF01141527.
[11] H. P. Boehm, A. Clauss, G. O. Fischer, and U. Hofmann. Das Adsorptionsverhalten sehr d¨unner Kohlenstoff-Folien. Z. Anorg. Allg. Chem., 316(3-4):119–127, 1962. doi:
10.1002/zaac.19623160303.
[12] H. Boehm, R. Setton, and E. Stumpp. Nomenclature and terminology of graphite intercalation compounds. Carbon, 24(2):241–245, 1986. doi: 10.1016/0008-6223(86)90126-0.
[13] D. R. Dreyer, R. S. Ruoff, and C. W. Bielawski. Ein Konzept und seine Umsetzung:
Graphen gestern, heute und morgen. Angew. Chem., 122(49):9524–9532, 2010. doi:
10.1002/ange.201003024.
[14] J. Grant and T. Haas. A study of Ru(0001) and Rh(111) surfaces using LEED and Auger electron spectroscopy. Surf. Sci., 21(1):76–85, June 1970. doi: 10.1016/0039-6028(70)90064-6.
[15] J. M. Blakely, J. S. Kim, and H. C. Potter. Segregation of Carbon to the (100) Surface of Nickel.
J. Appl. Phys., 41(6):2693–2697, May 1970. doi: 10.1063/1.1659283.
[16] R. Rosei, M. De Crescenzi, F. Sette, C. Quaresima, A. Savoia, and P. Perfetti. Structure of graphitic carbon on Ni(111): A surface extended-energy-loss fine-structure study. Phys. Rev. B, 28(2):1161–1164, July 1983. doi: 10.1103/PhysRevB.28.1161.
[17] A. Van Bommel, J. Crombeen, and A. Van Tooren. LEED and Auger electron observations of the SiC(0001) surface. Surface Science, 48(2):463–472, March 1975. doi: 10.1016/0039- 6028(75)90419-7.
[18] B. ¨Ozyilmaz, P. Jarillo-Herrero, D. Efetov, D. A. Abanin, L. S. Levitov, and P. Kim. Electronic Transport and Quantum Hall Effect in Bipolar Graphene p-n-p Junctions. Phys. Rev. Lett., 99 (16):166804, October 2007. doi: 10.1103/PhysRevLett.99.166804.
[19] K. Bolotin, K. Sikes, Z. Jiang, M. Klima, G. Fudenberg, J. Hone, P. Kim, and H. Stormer.
Ultrahigh electron mobility in suspended graphene. Solid State Commun., 146(9-10):351–355, June 2008. doi: 10.1016/j.ssc.2008.02.024.
[20] A. R. Ranjbartoreh, B. Wang, X. Shen, and G. Wang. Advanced mechanical properties of graphene paper. J. Appl. Phys., 109(1):014306, January 2011. doi: 10.1063/1.3528213.
[21] I. W. Frank, D. M. Tanenbaum, A. M. van der Zande, and P. L. McEuen. Mechanical properties of suspended graphene sheets. J. Vac. Sci. Technol. B, 25(6):2558–2561, November 2007. doi:
10.1116/1.2789446.
[22] M. J. Allen, V. C. Tung, and R. B. Kaner. Honeycomb Carbon: A Review of Graphene. Chem.
Rev., 110(1):132–145, 2010. doi: 10.1021/cr900070d.
[23] F. Schedin, A. K. Geim, S. V. Morozov, E. W. Hill, P. Blake, M. I. Katsnelson, and K. S.
Novos¨elov. Detection of individual gas molecules adsorbed on graphene. Nat. Mater., 6(9):
652–655, 2007. doi: 10.1038/nmat1967.
[24] M. Qazi, T. Vogt, and G. Koley. Trace gas detection using nanostructured graphite layers.Appl.
Phys. Lett., 91(23):233101–3, December 2007. doi: 10.1063/1.2820387.
[25] H. Shen, L. Zhang, M. Liu, and Z. Zhang. Biomedical Applications of Graphene. Theranostics, 2(3):283–294, 2012. doi: 10.7150/thno.3642.
[26] K. V. Emtsev, A. Bostwick, K. Horn, J. Jobst, G. L. Kellogg, L. Ley, J. L. McChesney, T. Ohta, S. A. Reshanov, J. Rohrl, E. Rotenberg, A. K. Schmid, D. Waldmann, H. B. Weber, and T. Seyller. Towards wafer-size graphene layers by atmospheric pressure graphitization of silicon carbide. Nat. Mater., 8(3):203–207, 2009. doi: 10.1038/NMAT2382.
[27] K. S. Kim, Y. Zhao, H. Jang, S. Y. Lee, J. M. Kim, K. S. Kim, J.-H. Ahn, P. Kim, J.-Y.
Choi, and B. H. Hong. Large-scale pattern growth of graphene films for stretchable transparent electrodes. Nature, 457(7230):706–710, February 2009. doi: 10.1038/nature07719.
[28] S. Park and R. S. Ruoff. Chemical methods for the production of graphenes. Nat. Nano., 4(4):
217–224, April 2009. doi: 10.1038/nnano.2009.58.
[29] L. Chen, Y. Hernandez, X. Feng, and K. M¨ullen. From Nanographene and Graphene Nanorib- bons to Graphene Sheets: Chemical Synthesis.Angew. Chem. Int. Ed., 51(31):7640–7654, 2012.
doi: 10.1002/anie.201201084.
[30] D. Rhinow, N.-E. Weber, and A. Turchanin. Atmospheric Pressure, Temperature-Induced Con- version of Organic Monolayers into Nanocrystalline Graphene. J. Phys. Chem. C, 116(22):
12295–12303, May 2012. doi: 10.1021/jp301877p.
[31] H.-L. Guo, X.-F. Wang, Q.-Y. Qian, F.-B. Wang, and X.-H. Xia. A Green Approach to the Synthesis of Graphene Nanosheets. ACS Nano, 3(9):2653–2659, August 2009. doi:
10.1021/nn900227d.
[32] M. Hilder, B. Winther-Jensen, D. Li, M. Forsyth, and D. R. MacFarlane. Direct electro- deposition of graphene from aqueous suspensions. Phys. Chem. Chem. Phys., 13(20):9187–9193, 2011. doi: 10.1039/C1CP20173E.
[33] G. Eda, Y.-Y. Lin, C. Mattevi, H. Yamaguchi, H.-A. Chen, I.-S. Chen, C.-W. Chen, and M. Chhowalla. Blue Photoluminescence from Chemically Derived Graphene Oxide.Adv. Mater., 22(4):505–509, 2010. doi: 10.1002/adma.200901996.
[34] A. C. Ferrari, J. C. Meyer, V. Scardaci, C. Casiraghi, M. Lazzeri, F. Mauri, S. Piscanec, D. Jiang, K. S. Novos¨elov, S. Roth, and A. K. Geim. Raman Spectrum of Graphene and Graphene Layers.
Phys. Rev. Lett., 97(18):187401–, October 2006. doi: 10.1103/PhysRevLett.97.187401.
[35] S. Heydrich, M. Hirmer, C. Preis, T. Korn, J. Eroms, D. Weiss, and C. Sch¨uller. Scanning Raman spectroscopy of graphene antidot lattices: Evidence for systematic p-type doping. Appl.
Phys. Lett., 97(4):043113–3, July 2010. doi: 10.1063/1.3474613.
[36] S. Kochmann, T. Hirsch, and O. Wolfbeis. The pH Dependence of the Total Fluorescence of Graphite Oxide. J. Fluoresc., 22(3):849–855, 2012. doi: 10.1007/s10895-011-1019-8.
[37] Z. Luo, P. M. Vora, E. J. Mele, A. T. C. Johnson, and J. M. Kikkawa. Photoluminescence and band gap modulation in graphene oxide. Appl. Phys. Lett., 94(11):111909–3, March 2009. doi:
10.1063/1.3098358.
[38] E. Treossi, M. Melucci, A. Liscio, M. Gazzano, P. Samor`ı, and V. Palermo. High-Contrast Visualization of Graphene Oxide on Dye-Sensitized Glass, Quartz, and Silicon by Fluorescence Quenching. J. Am. Chem. Soc., 131(43):15576–15577, November 2009. doi: 10.1021/ja9055382.
[39] M. S. Goh and M. Pumera. Single-, Few-, and Multilayer Graphene Not Exhibiting Significant Advantages over Graphite Microparticles in Electroanalysis. Anal. Chem., 82(19):8367–8370, 2010. doi: 10.1021/ac101996m.
[40] H. Chen, M. B. M¨uller, K. J. Gilmore, G. G. Wallace, and D. Li. Mechanically Strong, Electrically Conductive, and Biocompatible Graphene Paper. Adv. Mater., 20(18):3557–3561, 2008. doi:
10.1002/adma.200800757.
[41] C. L. Wong, M. Annamalai, Z. Q. Wang, and M. Palaniapan. Characterization of nanomechanical graphene drum structures. J. Micromech. Microeng., 20(11):115029, 2010. doi: 10.1088/0960- 1317/20/11/115029.
[42] W. Cai, R. D. Piner, F. J. Stadermann, S. Park, M. A. Shaibat, Y. Ishii, D. Yang, A. Vela- makanni, S. J. An, M. Stoller, J. An, D. Chen, and R. S. Ruoff. Synthesis and Solid-State NMR Structural Characterization of 13C-Labeled Graphite Oxide. Science, 321(5897):1815–
1817, 2008. doi: 10.1126/science.1162369.
[43] A. Fasolino, J. H. Los, and M. I. Katsnelson. Intrinsic ripples in graphene. Nat. Mater., 6(11):
858–861, November 2007. doi: 10.1038/nmat2011.
[44] M. B. M¨uller, J. P. Quirino, P. N. Nesterenko, P. R. Haddad, S. Gambhir, D. Li, and G. G.
Wallace. Capillary zone electrophoresis of graphene oxide and chemically converted graphene.
J. Chromatogr., A, 1217(48):7593–7597, November 2010. doi: 10.1016/j.chroma.2010.09.069.
[45] K. P. Loh, Q. Bao, P. K. Ang, and J. Yang. The chemistry of graphene. J. Mater. Chem., 20 (12):2277–2289, 2010. doi: 10.1039/B920539J.
[46] T. O. Wehling, K. S. Novos¨elov, S. V. Morozov, E. E. Vdovin, M. I. Katsnelson, A. K. Geim, and A. I. Lichtenstein. Molecular doping of graphene. Nano Lett., 8(1):173–177, 2008. doi:
10.1021/nL072364w.
[47] Y.-H. Zhang, Y.-B. Chen, K.-G. Zhou, C.-H. Liu, J. Zeng, H.-L. Zhang, and Y. Peng. Improving gas sensing properties of graphene by introducing dopants and defects: a first-principles study.
Nanotechnol., 20(18):185504, 2009. doi: 10.1088/0957-4484/20/18/185504.
[48] C. N. R. Rao, A. K. Sood, K. S. Subrahmanyam, and A. Govindaraj. Graphene: The New Two-Dimensional Nanomaterial. Angew. Chem., Int. Ed., 48(42):7752–7777, 2009. doi:
10.1002/anie.200901678.
[49] E. Fitzer, K.-H. Kochling, H. P. Boehm, and H. Marsh. Recommended terminology for the description of carbon as a solid (IUPAC Recommendations 1995). Pure Appl. Chem., 67(3):
473–506, 1995. doi: 10.1351/pac199567030473.
[50] M. D. Watson, A. Fechtenk¨otter, and K. M¨ullen. Big Is Beautiful - “Aromaticity” Revisited from the Viewpoint of Macromolecular and Supramolecular Benzene Chemistry. Chem. Rev., 101(5):1267–1300, April 2001. doi: 10.1021/cr990322p.
[51] S. E. Stein and R. L. Brown. .pi.-Electron properties of large condensed polyaromatic hydrocar- bons. J. Am. Chem. Soc., 109(12):3721–3729, June 1987. doi: 10.1021/ja00246a033.
[52] C. D. Simpson, J. D. Brand, A. J. Berresheim, L. Przybilla, H. J. R¨ader, and K. M¨ullen.
Synthesis of a Giant 222 Carbon Graphite Sheet. Chem.–Eur. J., 8(6):1424–1429, 2002. doi:
10.1002/1521-3765(20020315)8:6¡1424::AID-CHEM1424¿3.0.CO;2-Z.
[53] M. J. McAllister, J.-L. Li, D. H. Adamson, H. C. Schniepp, A. A. Abdala, J. Liu, M. Herrera- Alonso, D. L. Milius, R. Car, R. K. Prud’homme, and I. A. Aksay. Single Sheet Functionalized Graphene by Oxidation and Thermal Expansion of Graphite. Chem. Mater., 19(18):4396–4404, May 2007. doi: 10.1021/cm0630800.
[54] L. J. Cote, R. Cruz-Silva, and J. Huang. Flash Reduction and Patterning of Graphite Ox- ide and Its Polymer Composite. J. Am. Chem. Soc., 131(31):11027–11032, July 2009. doi:
10.1021/ja902348k.
[55] E. C. Salas, Z. Sun, A. Luettge, and J. M. Tour. Reduction of Graphene Oxide via Bacterial Respiration. ACS Nano, 4(8):4852–4856, July 2010. doi: 10.1021/nn101081t.
[56] A. Turchanin, A. Beyer, C. T. Nottbohm, X. H. Zhang, R. Stosch, A. Sologubenko, J. Mayer, P. Hinze, T. Weimann, and A. Golzhauser. One Nanometer Thin Carbon Nanosheets with Tunable Conductivity and Stiffness. Adv. Mater., 21(12):1233–+, 2009. doi:
10.1002/adma.200803078.
[57] A. Turchanin, D. Weber, M. B¨uenfeld, C. Kisielowski, M. V. Fistul, K. B. Efetov, T. Weimann, R. Stosch, J. Mayer, and A. G¨olzh¨auser. Conversion of Self-Assembled Monolayers into Nanocrys- talline Graphene: Structure and Electric Transport. ACS Nano, 5(5):3896–3904, 2011. doi:
10.1021/nn200297n.
[58] D. R. Dreyer, S. Park, C. W. Bielawski, and R. S. Ruoff. The chemistry of graphene oxide.
Chem. Soc. Rev., 39(1):228–240, 2010. doi: 10.1039/B917103G.
2 Graphenes in chemical sensors and biosensors
Note: All potentials given in this chapter are relative to the standard Ag/AgCl electrode if not stated otherwise.
2.1 Overview
The following chapter gives an insight into the current state of the art of applying graphene materials in chemical sensors and biosensors. A large amount of published work (over 230 references) on this topic is discussed to reveal the individual benefits (and flaws) of the members of the graphene-family.
A statistical evaluation (see Figure 2.1) shows that rGO is the material most commonly used (68% of all publications), probably because of its easy access, scalable synthesis, low cost and simple functionalization. In addition, rGO resembles pristine graphene in terms of electrical, thermal and mechanical properties[1]. However, if one distinguishes between different sensor types, it becomes clear that each material has its own field of application. Pristine graphene is most used in the transistor sector (approximately 60%), but not used at all for luminescence sensors. In the latter application, solubility and quenching (FRET) ability are required, for which the oxide groups are mandatory.
This clearly indicates that “graphene” is not one but, in fact, three materials, and that one must select the material which is most suitable for the task.
Figure 2.1. Statistical evaluation of the discussed work. Left: 68% of the published work use reduced graphene oxide and only 14% use pristine graphene. Right: If divided into sensor types (a: plain sensors, i.e. non- nanocomposite sensors; b: electro-chemical sensors; c: field effect transistor-based sensors; d: fluorescence- based sensors; e: chemiluminescence-based sensors; f: colorimetric sensors) it becomes clear, that every graphene material has is own application field. For instance, pristine graphene dominates the transistor- based sensors whereas it is not represented at all in optical sensors (block d-f).
2.2 Plain sensors
“Plain sensors” are those where graphene materials have been used without any prior modification. They are primarily used in electrochemical sensors, for example in elec- trodes due to their excellent conductivity. Typically, they are adsorbed on a glassy carbon electrode to increase the oxidation peak current and decrease of the oxidation overpotential of an analyte[2].
The graphene family is well known for its high adsorption of gases, vapors, ions and even uncharged organic species. Schedin et al.[3] claims graphene-based sensors “allow the ultimate sensitivity such that the adsorption of individual gas molecules could be detected”. The effect was used to sense gases such as NO2[4–10], NH3[8,11,12], CO[6], hydrogen[13], oxygen[6], water vapor (humidity)[4,11,14] and volatile organic compounds such as nonanal, octanoic acid and trimethylamine[11]. The limits of detection (LODs) are in the lower ppm and ppb range if detected by conductivity or amperometry.
The low LODs are due to the low electrical noise of graphene devices compared to those based on carbon nanotubes or semiconductor nanowires[11,15]. This is again attributed to the two-dimensional nature of the material. The strong sensing re- sponse is attributed to the charge transfer between the material and the adsorbed gases or vapors[8]. A simple and impressive approach was reported by Dua et al.[16]
who used solutions of (reduced) graphene oxide in an inkjet printer to print it directly
on poly(ethylene terephthalate) (PET). The films can be lifted off the PET surface and then be used directly for conductometric sensing of vapors (Figure 2.2A). With these materials, as low as 500 ppb of NO2 and of 6-25 ppm of Cl2 are detectable. The films can be recovered by exposing them to 254 nm UV light. Unfortunately, these sensors are not selective[3] and can only distinguish between electron-withdrawing and electron-donating molecules[16].
Graphene oxide and reduced graphene oxide (rGO) possess functional groups (mainly carboxy and hydroxy groups) on their surfaces which make them both fluoromet- ric[17,18] and voltammetric[19] probes for pH. The pH-dependent fluorescence of graphene oxide in the pH range from 1 to 10 does not depend on the excitation nor the emission wavelength. This makes it a potential probe for sensing pH in extracel- lular samples[17]. Lim et al.[19] discovered that rGO (“anodized graphene”) has a high potentiometric pH sensitivity (51.3 mV/pH) that is close to the theoretical maximum of 59.2 mV/pH. Pristine graphene, in contrast, shows a much weaker sensitivity to pH (12.5 mV/pH). The presence of oxide groups relates to the pH-responsivity. The functional groups of (reduced) graphene oxide can also complex metal cations such as Cu2+, Pb2+, and Cd2+ which enable their (unselective) detection by anodic stripping voltammetry in the 10-100 pM range[20].
Graphene-modified electrodes are also suitable for the voltammetric and amperometric determination of redox active species such as hydrazine[21–23], hydrogen peroxide[2], dopamine, ascorbic acid and uric acid[24–27], hydroquinone and catechol[28] and β- nicotinamide adenine dinucleotide (NADH)[2,29] at nM to µM levels. Zhou et al.[2]
have compared the performance of electrodes modified with rGO to those with other carbon materials (graphite and carbon nanotubes). Their study revealed that the former give a higher sensitivity towards hydrogen peroxide in voltammetry. A limit of detection (LOD) of 0.05 µM was found at a low overpotential of -0.20 V. Dopamine, ascorbic acid, uric acid and acetaminophen do not interfere. This high selectivity is claimed to be due to the formation of strong hydrogen bonds between hydrogen peroxide and rGO.
Similar results were obtained byChang et al.[24]who have demonstrated the simultane- ous detection of uric acid and ascorbic acid by using screen-printed carbon electrodes
Figure 2.2. (A) Procedure for sensor fabrication according toDua et al.[16]. Inset shows two images of inkjet printed sensors. Adapted with permission from ref. 16. Copyright (2010) Wiley-VCH Verlag GmbH & Co.
(B) A schematic diagram illustrating the suggested mechanism causing the improved voltammetric peak separation and sensitivity in a sensor for uric acid and ascorbic acid using reduced graphene oxide.
Reprinted with permission from ref. 24. Copyright (2010) Elsevier.
modified with rGO. The improved performance in terms of peak separation and sensi- tivity was compared to that of plain carbon and graphene oxide modified electrodes.
It illustrates that the presence of a nominal amount of functional groups on the surface of the material is mandatory to form hydrogen bonds with the analytes (Figure 2.2B).
Both the strength of the bond and the distance of interaction site to the reaction center influence the oxidation step and therefore the peak separation of ascorbic acid (19 mV instead of 0.5 V) and uric acid (0.3 V instead of 0.5 V) with simultaneous doubling of the peak current. Hydroquinone and catechol can also be sensed simultaneously[28]
by differential pulse voltammetry. The low LOD (15 and 10 nM, respectively) is at- tributed to a significantly lower oxidation overpotential, fast electron-transfer kinetics, and a good separation of the oxidation peaks (by about 112 mV) compared to bare carbon electrodes. Interference by common metal ions, uric acid and ascorbic acid is negligible. The same advantages apply to the amperometric determination of hy- drazine. A sensing platform based on rGO[21]has an LOD of 1µM of hydrazine, which is 8-times better than a comparable platform based on using multiwalled carbon nan- otubes. The method also was applied to determine acetaminophen (paracetamol)[30,31]
(LOD: 32 nM) and 2,4,6-trinitrotoluene (TNT)[32,33] in seawater (LOD: 4 µM).
The simultaneous detection of nucleic bases in DNA is a particular challenge due to the relatively close matching redox potentials and the slow electron transfer rate with most electrode materials[2]. Glassy carbon and graphite electrodes give only two peaks
(at about 0.65 V and 1.0 V) for a solution of all four bases[2,19,34]. An improvement is achieved with the use of a pristine graphene (on SiC substrate) electrode which clearly promotes a third peak that is assigned to cytosine (1.5 V). An even better result is ob- tained by adding rGO which shows oxidation peaks for all four nucleotides in solution (0.6 V, 0.9 V, 1.25 V, 1.5 V for guanine, adenine, thymine, cytosine, respectively)[19]. Moreover, electrodes with added rGO can detect the bases both in ssDNA and in dsDNA, with an LOD of 0.35 µg mL-1 [19,34]. The determination of dsDNA is difficult with most electrode materials without prior hydrolysis and separation, but was accom- plished recently by using electron cyclotron resonance nanocarbon film electrodes[2,19]. The feature of separated oxidation peaks was exploited[2] to detect single-nucleotide polymorphism in short oligonucleotides.
2.3 Nanocomposite sensors
2.3.1 Electro-chemical sensors
Assemblies of different materials that form an entity in the nanometer range are often referred to as nanocomposites. They are characterized by a very high surface to volume ratio which explains their superior properties relative to bulk composites. The combination of two or more materials also enables the tailoring of properties such as sensitivity and selectivity.
Calculations predict the enhanced adsorption of gases on graphene sheets decorated with metals. This is due to mutual interactions[35,36]. Graphene nanocomposites were often decorated with metals such as palladium and platinum resulting in sensors for hydrogen[37–44], carbon monoxide[39] and ethanol[45,46] in the gas phase. Zhang et al.[13]reported on the use of plain reduced graphene oxide (rGO) for hydrogen sensing with a resistance measurement, but the sensitivity was poor yielding a signal change of only 0.4% R/R0 for 500 ppm hydrogen. If rGO is combined with an conductive polymer such as polyaniline, the sensitivity is enhanced by a factor of 10 compared to rGO only. The signal change is 3.9% (R/R0 units) for 600 ppm of hydrogen, and 12.9% (R/R0) for 0.5% hydrogen. The enhancement effect in the range above 0.5%
hydrogen is attributed to the high porosity of the nanocomposite, while the effect below 0.5% can be assigned to the polyaniline only[37]. A further enhancement in signal response (25 times relative to[13]) is achieved by decorating rGO with palladium nanoparticles (signal change 33% R/R0 for 0.5% hydrogen). In contrast, this composite reduces the response of plain rGO for NO2. In fact, a sensor based on the use of rGO with and without palladium nanoparticles can distinguish between hydrogen, NO2and humidity[43]. It is interesting to note that a similar approach with graphene as the base material exhibits an enhancement factor of only 11.3 (4.5% R/R0 for 500 ppm H2)[44]. This indicates that both the catalytic effect of palladium and the interaction between the two material phases contribute to the sensing ability. Kumar et al.[42]
used a palladium-platinum alloy on rGO for their resistance measurements to improve response and recovery times of the respective hydrogen sensor. Compared to a similar method reported byLange et al.[43], response times are reduced to 2-20 s, but the signal response is decreased (only 4.3% R/R0 for 2% H2). Kaniyoor et al.[40,41]have combined multiwalled carbon nanotubes with rGO (1:1 w/w) and decorated this material with platinum nanoparticles. This increases the response to 1-5% hydrogen by a factor of 2 compared to platinum decorated nanotubes. Such sensors work at temperatures up to 160 ◦C. Yi et al.[46] reported on a sensor based on ZnO nanorods and graphene on metal foils for conductive sensing of vapors. Ethanol was determined at low ppm levels at operational temperatures of up to 300◦C and under mechanical deformation with a bending radius of <0.8 cm. Cuong et al.[47] used rGO and ZnO nanorods to design a sensor for hydrogen sulfide. This sensor possesses a high resistivity in an oxygen environment, because oxygen is adsorbed on the surface of the nanorods.
There oxygen ionic species are formed, capturing electrons from the conduction band.
Hydrogen sulfide reacts with the surface oxygen species which decreases the surface concentration of oxygen ions leading to a decrease in the resistance of the sensor. The detection limit is 2 ppm of H2S in presence of oxygen at room temperature.
rGO was deposited on top of a surface acoustic wave transducer (36◦ YX LiTaO3) to build a sensor device for hydrogen and carbon monoxide[38,39]. The change in the resonance frequency at room temperature was 5.8 kHz for 1% hydrogen and -8.5 kHz for 0.1% CO. The device can detect as little as 125 ppm of hydrogen and 250 ppm of CO, both at 25◦C and 40 ◦C. The response and recovery times for hydrogen are 12 s and
less than 1 min for 125 ppm, 5 min and 20 min, respectively, for 250 ppm of CO. The combination of graphene materials with surface acoustic wave technology is promising because the sensors can be operated passively, i.e. with no need of a separate power supply. This overcomes the need for batteries and enables easier miniaturization[48]. rGO and Nafion can be used for anodic stripping voltammetric analysis of cadmium(II)[49–51]. Other work demonstrated the simultaneous detection of Cd2+ and Pb2+ [50,51]. Willemse et al.[51] reported on the determination of Cd2+, Pb2+, Zn2+
and Cu2+. The latter approach has LODs of 0.07-0.08 µg mL-1 for the individual ions which is comparable to ICP-MS. The high sensitivity is contributed to a combination of enhanced electron conduction of rGO and the cation exchange capacity of Nafion.
Nafion also acts as an effective solubilizing agent and antifouling coating[50,51]. How- ever, tests with real water samples revealed two problems. First, organic compounds in the water may form stable complexes with metal ions such as Cu2+, thus making them unavailable for analysis. Secondly, organic compounds can adsorb onto the surface of the working electrode, thus decreasing its surface area which can lead to a reduction of the analytical signal.
Gong et al.[52] have developed a nanocomposite consisting of rGO protected by poly(vinyl pyrrolidone), chitosan and gold nanoparticles for sensing Hg2+ by anodic stripping voltammetry. This sensor has a sensitivity of 708.3 µA/ppb, and its detec- tion limit (6 ppt) is far below the guideline value of drinking water set by the WHO (1 ppb). Also, 20 ppb of either Cd2+, Co2+, Cu2+, Fe3+, Zn2+ or I– have negligible effect on the detection of 1.0 ppb of Hg2+. A comparison with a sensor based on the use of carbon nanotubes and the individual components reveals that such properties can be ascribed to the ensemble behavior of the nanostructured material. It was con- cluded that the surface and structure of rGO greatly improves the interaction with both the deposited gold nanoparticles and the analyte ions, prompting the interfacial electron-transfer process.
Compared to common glassy carbon electrodes (GCEs), electrodes modified with graphene materials already yield enhanced signals or can discriminate between redox- active species due to interactions with surface, catalytic activity, or changed electron transfer kinetics. The determination of hydrochinone, for example, is difficult with
GCEs at low potentials of about 0.0 V by differential pulse voltammetry. In contrast, an electrode modified with rGO shows a well-defined peak at 2 mV. If decorated with platinum nanoparticles, the current density, and therefore the sensitivity (expressed as µA M-1 cm-2), increased by a factor of 2. Li et al.[53] have explained this by the enhanced electron transfer in this system. The charge hopping through the metal and the effective charge migration through the rGO both attribute to this. The effective transport of the electrons to the electrode in the material led to the efficient elec- trocatalytic oxidation of hydroquinone. By analogy, the detection of catechol can be improved[54,55]. The isomers hydrochinone, catechol and resorcinol can be determined simultaneously with a sensor based on rGO and chitosan[56]. The wide linear ranges (about 1-400 µM each), low detection limits (0.75 µM each) and good sensitivities (about 56-59 µA M-1 for hydrochinone/catechol, and 25 µA M-1 for resorcinol) are a product of high electrocatalytic activities towards the analytes, increased oxidation peak currents, and good peak separations (hydrochinone at 0.0 V, catechol at 0.1 V, resorcinol at 0.5 V).
The electrocatalytic effect of the composites depends on the ratio of the components.
Hong et al.[57] examined the effects of different ratios of gold nanoparticle and rGO on the peak current of a 5 mM solution of ferricyanide (1 M KCl, 50 mV s-1). A ratio of 10:1 of gold nanoparticles/rGO showed the highest peak current and therefore the best catalytic activity. This is due to the low conductivity caused by the presence of too many 4-dimethylaminopyridine moieties used as a stabilizer for gold nanoparticles in water on the rGO surface. At ratios >10:1, this composite did not form stable aqueous solutions and precipated after a maximum of 12 h.
The simultaneous determination of ascorbic acid and uric acid was demonstrated by Chang et al.[24] using rGO only. Zhang et al.[58] used a combination of graphene and multiwall carbon nanotubes in a crosslinked cyclodextrin matrix to sense both dopamine (detection limit: 0.05µM, range: 0.15-21.65 µM) and ascorbic acid (detec- tion limit: 1.65 µM, range: 5 µM-0.48 mM) by voltammetry. The potential for the oxidation of dopamine (at 0.17 V vs. SCE) and ascorbic acid (at -0.06 V vs. SCE) are well separated. The observed sensitivity for dopamine (23-fold compared to ascorbic acid) is claimed be the result of three effects. First, the host-guest chemical reaction ability of cyclodextrin enhances the oxidation of dopamine by its diffusion through
the cavities of cyclodextrin. Secondly, the easy contact with the dispersed graphene- multiwall carbon nanotubes facilitates the electron transfer. Third, theπ-πinteraction between the phenyl ring of dopamine and the graphene/carbon nanotubes makes the electron transfer more feasible than that between non-aromatic ring of ascorbic acid and the graphene/carbon nanotubes. Unfortunately, the sensor was not tested for in- terference by uric acid. A sensor for uric acid in human serum was recently developed which exploits the described discrimination effect[59]. The detection limit and the lin- ear range were suitable (0.3 µM, 0.8-150 µM). 50-fold concentration of dopamine and 500-fold concentration of ascorbic acid did not show any interference.
Comparison with a similar composite consisting of rGO in cyclodextrin by Tan et al.[60] reveals that a material composed of graphene and carbon nanotubes has the same effect on discrimination as rGO only. This can be attributed to the similar defect (= border) sites of both materials. However, the latter one has a 10-fold lower detection limit (Zhang: 0.05 µM, Tan: 5.0 nM) with a wider linear range (Zhang:
0.15-21.65µM, Tan: 9 nM-12.7µM) for the voltammetric determination of dopamine.
(Reduced) graphene oxide materials were also applied in sensors for the detection of dopamine by fabricating composites with TiO2[61], ethylenediamine triacetic acid silane[62], layered double hydroxides (Zn/Al)[63] and cupric oxide[64]. The resulting voltammetric sensors share similiar detection limits (10 nM to 2 µM), linear ranges (from 0.1 to 200 µM) and selectivity. There does not appear to be any obvious correlation between the components of the composites and their effects. The choice of the redox peak (0.2 V/0.3 V vs. SCE; 0.272 V vs. Ag/AgCl) and the optimization of other parameters (pH, electron transfer resistance, ratio of materials, etc.). are much more relevant. Still, the simultaneous detection of ascorbic acid, dopamine and uric acid is critical. Different materials promote different redox peaks[65–68]. rGO with platinum particles in a Nafion matrix, for example, provides relatively high peak currents for ascorbic acid (1 mM, 95µA, 40 mV), dopamine (1 mM, 272 µA, 225 mV) and uric acid (1 mM, 371 µA, 369 mV)[68] in the respective cyclovoltammograms at a scan rate of 50 mV s-1.
The use of an ionic liquid instead of Nafion[67] not only results in a different discrim- ination of the peaks (e.g. ascorbic acid at 85 mV) but also to a 2-4-fold lower peak
current for all analytes (e.g. 1 mM of dopamine: 87.1µA; scan rate: 100 mV s-1). The same applies to differential pulse voltammetry. A composite based on graphene oxide and polyaniline was found to further enlarge the distance between the cathodic oxi- dation peaks (25 mV, 249 mV and 373 mV for ascorbic acid, dopamine and uric acid, respectively)[65]. Here the currents are reduced by another step (scan rate: 50 mV s-1) for ascorbic acid (2 mM: 20 µA), dopamine (1 mM: 40 µA) and uric acid (1 mM:
77µA). The currents of all composites are greatly enhanced compared to a bare GCE due to the increased surface area and the catalytic activity, which seems best for a combination of rGO and Nafion.
Graphene nanocomposite materials have also served as a basis for constructing enzy- matic biosensors[69,70]. Glucose oxidase (GOx) is often chosen as a model enzyme. As previously discussed, plain applied graphene materials are suitable for voltammetric determination of enzymatically generated hydrogen peroxide[2]. Brownson et al.[71]re- port that graphite-based amperometric electrodes (sensitivity: 49.0µA mM-1) exhibit greatly enhanced electro-catalytic activity over graphene (32.8 µA mM-1) at 400 mV.
This is attributed to an increased percentage of edge plane sites. However, after the introduction of Nafion, sensitivities are reversed due to the potential discrimina- tion effect from interferents. Graphene and Nafion (42.2 µA mM-1) are superior over graphite and Nafion (32.0µA mM-1) due to substantial re-orientation and disorder of graphene (Figure 2.3). This is an indication that (a) composite materials are essential for graphene based amperometric biosensors, and (b) the orientation of the graphene sheets in these composite materials is crucial.
Nafion neither is the only nor the best material to improve the amperometric char- acteristics of graphene. ZnO nanospheres[72], for example, lead to similiar results with respect to detection limit and sensitivity[73] but provide a wider linear range for hydrogen peroxide detection (1.8 µM to 2.3 mM) at an almost identical potential (about -0.3 V).Cui et al.[74] have used a composite consisting of rGO, thionine, gold nanoparticles and horseradish peroxidase for analysis of milk samples. The sensitivity doubled (86 µA mM-1, -0.26 V vs SCE) compared to the graphene/Nafion material described above. The sensor showed a very good detection limit (10 nM) and linear range (10 µM-1.8 mM). Ascorbic acid interferes, but glucose, uric acid, acetic acid, oxalic acid, citric acid and sucrose do not. The addition of gold nanoparticles and
Figure 2.3. Left: Schematic representation of inhibition of edge plane like sites caused by the addition of Nafion to a graphite modified electrode. Right: Schematic representation of the re-orientation of graphene layer cause by the addition of Nafion to a graphene modified electrode. Reproduced by permission on the Royal Society of Chemistry from ref. 71.
thionine doubles sensitivity compared to approaches without these[75,76].
Huang et al.[77] prepared a composite based on rGO, gold nanoparticles and catalase for use in an amperometric sensor for H2O2. This approach has similar detection limit (50 nM) and linear range (0.3-600µM), but sensitivity is low (13.4µA mM-1, -0.3 V vs SCE). Two other reports confirm that gold nanoparticles improve detection limits and linear ranges[78,79]. Materials incorporating magnetite provide the same enhancements as gold nanoparticles and provide the additional feature of ferromagnetism. This allows easy manipulation of the material (e.g. separation for cleaning processes, immobilizing on electrodes) by application of an external magnetic field[80,81]. Sensors based on all types of graphene materials with silver nanoparticles[82,83], MnO2[84], DNA[83,85], hemoglobin[86]and microperoxidase-11[87] have been constructed with detection limits in the lower µM range and linear ranges in the upperµM and lower mM range.
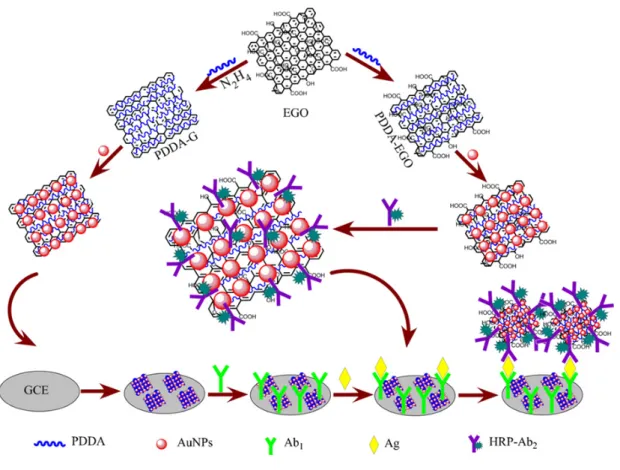
Prussian blue (PB, also termed “artificial peroxidase”) is known for its excellent per- formance in sensing H2O2[88]. Cao et al.[89] synthesized PB nanocubes on top of rGO (Figure 2.4) to construct a sensor for H2O2 with an LOD of 45 nM at 0.2 V and a wide linear range (0.05-120 µM). Others have achieved similar results[90,91]. Guo et
al.[92] have built a biointerface that consist of multilayers of rGO, PB and the extra- cellular matrix protein laminin. They were deposited on an indium tin oxide substrate on which human cells were grown. High electrocatalytic activity towards reduction of H2O2 was observed at a potential of 0.0 V. Such a low potential prevents anodic and cathodic potential interference. The release of H2O2 from the cells in response to different stimuli was explored. It was possible to detect 1011 extracellularly released H2O2 molecules per cell, which is attributed to the high sensitivity (141µA mM-1) of this multilayer composite structure.
Figure 2.4. Left: Procedure for the fabrication of nanocomposites with Prussian blue nanocubes for sensing hydrogen peroxide. Right: TEM image showing the resulting nanocomposite. Adapted with permission from ref.
89. Copyright (2010) American Chemical Society.
Various attempts have been made to immobilize GOx on rGO in the presence[69,93,94]or absence[95] of a polymer matrix. This resulted in amperometric biosensors for glucose with detection limits (3-20 µM) and linear ranges (0.04-12 mM) that enable glucose to be determined in blood serum (lower mM range). They provide fast response times (5 s) and Michaelis-Menten constants of about 4.5 mM. This indicates that the bound GOx has retained a relatively high enzymatic activity compared to similar materials based on multiwall carbon nanotubes[96]. However, a comparison with GOx-based biosensors modified with gold nanoparticles[96–100], ionic liquids[101,102], platinum par- ticles[103,104] or PB[91] revealed no significant improvements. Modifications with palla- dium particles[105] or CdS[70] resulted in a reduction of the Michaelis-Menten constant by a factor of 3-4 (to about 1.2-1.6 mM), suggesting that these latter modifications provide a more favorable environment for GOx. Zhiguo et al.[106] have developed a multilayer nanocomposite for use in a glucose sensor. rGO decorated with gold nanoparticles was covered with a layer of CdTe-CdS quantum dots, a second layer with gold nanoparticles, and finally with GOx in a chitosan matrix. This sensor dis- played remarkable properties in terms of response time (45 ms), detection limit (3 pM),

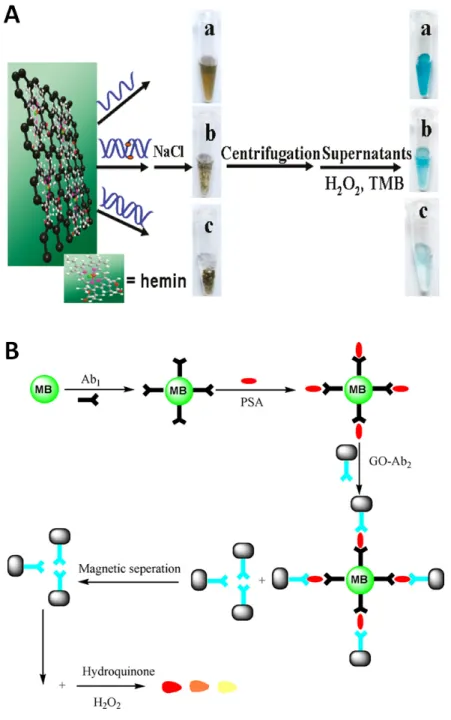
![Figure 2.10. Schematic representation of the amplification strategy of Guo et al. [235] for their DNA sensor based on graphene oxide](https://thumb-eu.123doks.com/thumbv2/1library_info/5637126.1693162/52.892.120.735.201.581/figure-schematic-representation-amplification-strategy-sensor-based-graphene.webp)