Discussion Paper Series Report No. 2
South Asia Human Development Sector
November, 2003
Secondary Education in India
37833
Public Disclosure Authorized Public Disclosure Authorized Public Disclosure Authorized Public Disclosure Authorized
Secondary Education in India
SASHD
November, 2003
Human Development Sector South Asia Region
The World Bank
Table of Contents
Executive Summary 9
I. Introduction 11
II. Policy Context 11
III. The Status of Secondary and Higher Secondary
Education in the Country 13
IV. Issues in Secondary Education 28
V. Conclusion 43
This report was task managed and written by Prema Clarke. Keith Hinchliffe participated in the task during its early stages. The note is based on four commissioned pieces of research: (i) an analysis of national level data on secondary education done by Jyotsna Jha (an independent consultant); (ii) a more detailed analysis of State level secondary data on selected southern States undertaken by Manabi Majumdar (Madras Institute for Development Studies) and on selected Northern States by Jyotsna Jha; (iii) a review of literature in secondary education done by Anupam Ahuja (an independent consultant); and (iv) enrollment projections done by the late Yash Aggarwal (National Institute for Education Planning and Administration).
Renu Gupta assisted by providing valuable secretarial support for this task. Comments received from several individuals served to strengthen this report. The author is grateful to the peer reviewers (Sajitha Bashir, Tobias Linden, and Xiaoyan Liang) for their comments and also to others who provided feedback on the paper including Charles Griffin, Michelle Riboud, Ananya Basu and N.K. Jangira.
ACKNOWLEDGMENTS
ABBREVIATIONS AND ACRONYMS
CBSE Central Board of Secondary Education
CISCE Council for the Indian School Certificate Examinations COBSE Council of Boards of Secondary Education in India
GER Gross Enrollment Ratio
GNP Gross National Product
GOI Government of India
HSE Higher Secondary Education
ICT Information and Communication Technologies
IT Information Technology
KVS Kendriya Vidyalaya Sangathan
MHRD Ministry of Human Resource Development
NCERT National Council of Educational Research and Training NCTE National Council for Teacher Education
NIEPA National Institute of Educational Planning and Administration
NOS National Open School
NSSO National Sample Survey Organization
NVS Navodaya Vidyalaya Samiti
OECD Organization for Economic Cooperation and Development
SC Scheduled Caste
SCERT State Council of Educational Research and Training
SE Secondary Education
SIEMAT State Institute for Educational Management, Administration and Training
SSA Sarva Shiksha Abhiyan
ST Scheduled Tribe
TPR Teacher Pupil Ratio
EXECUTIVE SUMMARY
1. Secondary education is increasingly becoming an area of focus in developing countries, which have thus far concentrated on achieving universal elementary education. This policy note on secondary education in India discusses issues and aspects critical for the development of this sub- sector. Secondary education, in terms of policy, is a concurrent item in that it is within the purview of both State and Central governments. State level implications and strategies for developing this sub-sector are critical. The Central government involvement in secondary education thus far has been through discrete programs, such as computer and vocational education. The 10
thFive-Year Plan (2002-2007) intends a much more strategic role for the Central government in improving secondary education in the country. This policy note supports this national vision and highlights the issues and constraints in implementing this vision.
2. Secondary education includes two years of secondary (referred to as SE) and two years of higher secondary education (referred to as HSE). There are 28 million students enrolled in secondary and higher secondary education in the country, representing a Gross Enrollment Ratio (GER) of 35 percent. Two-thirds of those students enrolled in upper primary and a fourth of those enrolled in primary continue on into secondary. The GER for girls is 14 percent lower than that of boys indicating the need for focusing on girls’ enrollment. There is considerable variation across States in terms of GERs and also in terms of differences in gender equity. Three types of schools provide SE and HSE in the country: government funded, private unaided and private aided [referred to in this Report as government, private and aided respectively]. The aided schools are privately owned, where teachers’ salaries and other recurring expenditures are funded by State governments. Except for States where the aided sector is strong, the government involvement in SE and HSE is significant.
The range in the share of aided schools across States is 54 to 99 percent. The share of private schools in SE is 13 percent and for HSE 18 percent. An average 60 percent of the students across States are successful in obtaining certification in government schools, portraying the critical need for improving educational quality.
3. The policy note concludes with a summary of issues and aspects critical for this sub-sector relating to four areas: planning in secondary and higher secondary education; administrative reform; improving the quality of education and financing of secondary education.
4. Planning in secondary and higher secondary education: Planning in secondary education is weak at both State and national levels. State level planning has so far involved the allocation of central funding and a continuation of activities from the previous year. Clearly, comprehensive State level planning for improving SE and HSE is important. The Central government, on the other hand, could nurture a far more strategic involvement with the States in improving this level of education, clearly envisioned within the Government of India’s 10
thFive-Year Plan. Possible approaches for such strategic involvement could be to position itself within the States’ comprehensive plans for secondary education reform, and focus on specific areas identified in the 10
thPlan such as equity, quality and so on. In this situation the Center would also develop a range of technical resources, which States could draw upon depending on the focus and needs defined in their plans.
5. Management and administrative reform: Four aspects can be identified here. Firstly, the many
institutions involved in SE and HSE at the State level currently appear to be operating independent
of each other. This is likely due to the absence of an overall vision for the sub-sector. Depending on
how States’ decide to position their SE and HSE sectors, it will be critical to focus on a more
effective functioning of the institutions aligned with this vision. Secondly, in order to improve
secondary education, reform in teacher management requires attention. An adequate number of
teachers, transparent and effective transfer and deployment policies and systematic and focused professional development will reduce the constraints to improving secondary education. Thirdly, the States could explore support for the grant-in-aid system with adequate regulatory norms and monitoring mechanisms in place or the possibility of providing vouchers to students to attend private schools. Fourthly, in order to manage the sector more efficiently, it would be critical to put in place a computerized monitoring information system for significant indicators, such as enrollment and retention, in addition to an assessment system to provide data on student performance across districts and States.
6. Quality improvement: The performance of students portrays a critical need to improve the quality of instruction in both SE and HSE schools. Two options are available to State and Central governments. In the first option, quality improvement would take place within the current system, assuming that the students are being sufficiently prepared for the expectations of the labor market.
In this case, the current curriculum and examination model would continue and infrastructure needs relevant to improving student performance within the existing model would be taken up. It will also be necessary to put in place a system for ensuring Teacher training in subject content knowledge and accountability for teachers and for schools. In the second scenario, the improvement of quality would be based on the assumption that the focus of secondary education is the development of lifelong learning skills, which would then involve a revamping of the whole system. Here, school improvement and teachers’ professional development through reform in inservice and preservice training would be of paramount importance in addition to reforms in textbooks, curriculum and examinations.
7. Vocational education: This is an area that requires rethinking. The success of most of the States that have attempted to implement the Centrally sponsored scheme of vocational education has been limited, especially when the size of the investments made for vocational education is considered.
In rethinking vocational education, the question of direct involvement of industry and employers needs to be addressed, and accordingly the proportionate focus on generic skills decided. If industry and employers are not willing to participate in providing vocational training, perhaps, providing all students with a generic set of skills could be a more appropriate option.
8. Financing: Thus far the focus, rightly so, has been on elementary education. Increasingly the
importance of secondary education to the country’s economic progress is becoming critical. If
there is going to be a concerted effort at secondary education reform, the current level of funding
is insufficient and unavailable for critical quality improvement in this sub-sector. While State level
increase in financial allocation is critical, the need for clear incentives and performance indicators
associated with Central allocations to States would be important.
1.1 Secondary education is at the threshold of gaining critical attention in India. This is so even as concerted efforts in elementary education across the country bring about expansion and increased aspirations for further good quality education. Internationally, secondary education has become important in the context of changing global labor markets and changes in the requirements of and emphasis on higher education . A workforce with an appropriately designed secondary education is also increasingly being considered as integral to the economic development of a country. The forces that have highlighted secondary education internationally are becoming more and more pronounced in India with the globalization of the economy and the advent of the age of information technology (IT). In this milieu, it was deemed fit to begin to understand this sub-sector and, therefore this work in secondary education was undertaken. While this note is primarily meant for a Bank audience, it is also intended to begin dialogues with the national and State governments on developing this sub-sector.
1.2 This policy note on secondary education in India, begins with an introduction to its policy context, followed by an examination of the status of this sub-sector. This is followed by a discussion of the issues in secondary education. The conclusion highlights specific areas requiring attention in this sub-sector. The policy note is based on secondary data available at the national level, a few commissioned analyses of secondary data in selected States (Andhra Pradesh, Assam, Kerala, Maharashtra, Orissa, Rajasthan, Tamil Nadu and Uttar Pradesh) and a literature review of studies in secondary education over the last decade.
1II. POLICY CONTEXT
2.1 Historically, Universities controlled secondary education in India until 1917. In 1917, with the formation of an independent Board of Education to control high schools, secondary schooling became “an independent sub-sector” in the country.
2The 1952 Secondary Education Commission introduced the policy of developing a three-year national system of secondary education (after eight years of elementary education). The four-year secondary education system was first recommended by the 1964 Kothari Commission and reiterated in the 1986 National Policy on Education. The National Policy on Education and Program of Action (1992) for its implementation advocated uniformity across States in the expansion of secondary education. This stage of education was also emphasized as an instrument for social change.
2.2 The federal structure in the country has a considerable impact on all aspects of secondary education.
The policy context of secondary education in India is influenced by the inclusion of education on the concurrent list since 1976, making it the responsibility of both the Central and State governments.
Unlike elementary and higher education, the respective responsibilities of State and Center are not as clearly defined for secondary education.
3The role of the Center is usually contained in the Five- Year Plans put forward by the Government of India (GOI). Until the 9
thFive-Year Plan the
1
The following sources were also used: (i) Sixth All-India Educational Survey 1993 (NCERT 1998); (ii) Selected Educational Statistics (Different Years) MHRD, GOI; (iii) Education in India (1994-95), MHRD, GOI, 2001; (iv) National Family Health Survey (II), International Institute of Population Sciences, 2000; (v) A Handbook of School Education and Allied Statistics (1996), MHRD, GOI; (vi) Annual Report (different years), MHRD, GOI; (vii) National Sample Survey Reports (50
th, 52
ndand 55
thRound); (viii) Selected Information on School Education in India, 1996-97, (MHRD, 2000).
2
The Sargeant Report 1944 set in place the five year schemes and recommended that High school covers a period of six years, and two streams, academic and technical, not restricted by university demands; entry to high schools was to be on a selective basis.
3
Except in the case of the Union Territories. According to the MHRD 00-01 report on secondary education the Central government has a special responsibility to oversee education in the Union Territories.
I. INTRODUCTION
involvement of the Center in secondary education was confined to the support given to apex national level institutions and a few Centrally sponsored schemes (CSS). Apex level institutions such as the National Council of Education Research and Training (NCERT) and the National Institute for Educational Planning and Administration (NIEPA) provide support to the States and set guidelines for secondary education, especially in the area of curriculum.
2.3 There is continuity in the areas of focus in the CSS in the Five-Year Plans, though, for the most part the areas chosen for funding appear to be fragmented rather than integrated and targeted to support secondary education. Thus far, the main CSS in secondary education is the national program, on Vocationalisation of Secondary Education introduced in 1988. The objective of this program was to ensure that 25 percent of the secondary school students opt for vocational education courses.
Central funding is also available to the States for improving science education and for the program entitled Computer Literacy and Studies in Schools, which introduces computers in schools.
Other national schemes include Kendriya Vidyalaya (1965) and Navodaya Vidyalaya (1985). The Kendriya Vidyalya schools are for the children of transferable Central government employees and Navodaya Vidyalaya schools are for gifted students from rural areas.
42.4 The current Five-Year Plan suggests a more significant role for the Central government in secondary education in the States. The 10
thFive-Year Plan (2002-2007) assigns a more “strategic and focused”
role for the Center in secondary education.
5According to the Report of the Working Group on Secondary Education for the 10
thFive-Year Plan (2002-07) “[the Center] may also share with the States the responsibility of giving direction to the expansion and qualitative improvement [of secondary education (SE) and higher secondary education (HSE)].” This report suggests that the Center could provide support to the States in the areas of “access and equity; quality improvement;
information and communication technologies (ICT); integrated/inclusive education for the disabled and other disadvantaged groups; and vocational education.” Clearly, the way in which GOI operationalizes this intention will impact improvement in secondary education in the States.
2.5 The national curriculum outlines the objectives for education at this level. The overall 23 objectives of education, which cover a range of skills, values and attitudes are outlined in the National Curriculum for elementary and secondary education. The objectives include the development of basic skills in language, communication, mathematics, science and environmental studies. Contextualized knowledge is important and the values to be inculcated include national pride, an appreciation of the history and cultural diversity of India, an awareness of social and economic issues, and the development of personal and spiritual values. Interestingly, the ability to reason and to analyze situations and information is not clearly highlighted in the objectives for secondary education, though it could be embedded in this objective of developing the “ability not only to accumulate factual information but also to understand, reflect and internalize and develop insight (NCERT, 1999).” In sum, the goals for secondary education are to develop responsible citizens and leaders in the community. Though the National Curriculum refers to national norms, it has not been possible to ascertain the extent to which States have adopted these norms or alternatively have redefined or incorporated these objectives into the State’s goals for education.
4
Kendriya Vidyalaya schools were established with the main purpose of providing uninterrupted schooling facilities with a common syllabus and medium of instruction to children of transferable employees of the central government. In 1985-86, the Government of India launched a scheme called Navodaya Vidyalaya, a residential school program in each district with the aim of providing ‘quality modern education’ to children in rural areas. The 480 schools (with total enrollment of 125,000 students) are fully subsidized by the Central government and managed by an autonomous body (Navodaya Vidyalaya Samiti) set up by the Central government. These schools start from Grade 6 and run up to Grade 12. The school caters to students from disadvantaged backgrounds, though only a few students come from poor families. Since these two schemes are relatively small, they will not be dealt with at length in this paper.
5
The 10th Five Year Plan is based on several assumptions, two of those being a GDP growth of 8-10 percent and doubling of
per capita income by 2010 and quadrupling it by 2020.
2.6 Information is not easily available on the policy contexts in States and it is unclear except for a few whether they are involved in strategic thinking about this sub-sector. Correspondingly, how the inclusion of Centrally sponsored schemes or Central support for specific programs fits into overall State plans for secondary education is not evident. In other words, the issue here is whether States are developing secondary education in a holistic manner with specific objectives or whether attention to secondary education is only undertaken within the context of programs that receive Central assistance. Karnataka is one State that has embarked on a systematic analysis of this level of education and is in the process of putting together a plan for comprehensive reform in this sub- sector (World Bank Report No. 24208-IN) that incorporates a State vision and funding for secondary education as well as Central programs and financial assistance. Improving the quality of secondary education in government schools is a significant goal for the Government of Karnataka and policies to enable this to happen are being put in place.
2.7 To summarize the above discussion, the Center and State are both involved in secondary education in the country. The Center has thus far been involved in education through apex level institutions, setting in place guidelines for secondary education and through a few Centrally sponsored schemes.
The Center intends to play a much more significant role in secondary education and the way this intention is operationalized will be important. It is unclear whether State level strategic policy planning critical to secondary education reform is in place. This paper highlights the importance of strategic planning at the State level and the incorporation of Central funding into these plans. The national curricular guidelines outlining the objectives for this level gives minimum emphasis to the skills of reasoning and analysis crucial for preparing students to be lifelong learners. Considering the opportunities for students certified with SE and HSE, an option for the national level and for the States is to enact policies and programs that will nurture and develop these skills discussed in more detail later in this note. In order to be able to discuss issues in secondary education more effectively, the following section examines the basic status of SE and HSE in India.
III. STATUS OF SECONDARY AND HIGHER SECONDARY EDUCATION IN THE COUNTRY:
3.1 The status of secondary education briefly introduces the structure of this level of education, the patterns of enrollment, retention and transition, the vocational component and finally, the financing of secondary education in the country.
A. Structure
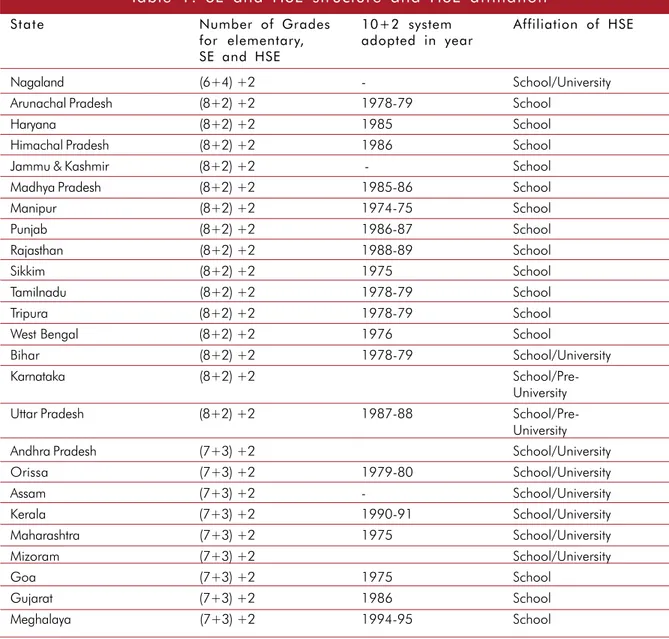
3.2 Secondary (Table 1) is divided into two stages, lower or junior secondary (to be referred to as
secondary in this paper) and senior or higher secondary. Secondary education is varied and depends
on whether States have adopted the national structure for elementary education of eight years
duration. Excluding the Union Territories, about nine States continue to have seven years of
elementary education, making secondary three years rather than two as in the other States. Nagaland,
unlike the rest of the States in India, has six years of elementary and four years of secondary
education. It is unclear whether States with a three-year secondary education program are in
transition and will adopt the national structure in the next few years. In general, there are no
subject choices to be made by students in SE, the curriculum is standardized depending on the
certification process described below. Higher secondary education, consisting of two years, is
uniform across the country. Higher secondary, different from secondary education, offers a choice
of curriculum to students and the main streams are Humanities, Science and Commerce. While in
the majority of States higher secondary education is part of school education, in some of the States,
the situation is far more complex with universities in addition to schools being involved in higher
secondary education. Universities also offer higher secondary education in eight States.
6In Karnataka and Uttar Pradesh, separate institutions (pre-university or junior colleges) affiliated to university education are also responsible for this level of education. The diversity in the affiliations of higher secondary clearly raises issues related to the administration and financing of secondary education.
6
The eight States are Nagaland, Bihar, Andhra Pradesh, Orissa, Assam, Kerala, Maharastra and Mizoram.
Table 1: SE and HSE structure and HSE affiliation
State Number of Grades 10+2 system Affiliation of HSE
for elementary, adopted in year SE and HSE
Nagaland (6+4) +2 - School/University
Arunachal Pradesh (8+2) +2 1978-79 School
Haryana (8+2) +2 1985 School
Himachal Pradesh (8+2) +2 1986 School
Jammu & Kashmir (8+2) +2 - School
Madhya Pradesh (8+2) +2 1985-86 School
Manipur (8+2) +2 1974-75 School
Punjab (8+2) +2 1986-87 School
Rajasthan (8+2) +2 1988-89 School
Sikkim (8+2) +2 1975 School
Tamilnadu (8+2) +2 1978-79 School
Tripura (8+2) +2 1978-79 School
West Bengal (8+2) +2 1976 School
Bihar (8+2) +2 1978-79 School/University
Karnataka (8+2) +2 School/Pre-
University
Uttar Pradesh (8+2) +2 1987-88 School/Pre-
University
Andhra Pradesh (7+3) +2 School/University
Orissa (7+3) +2 1979-80 School/University
Assam (7+3) +2 - School/University
Kerala (7+3) +2 1990-91School/University
Maharashtra (7+3) +2 1975 School/University
Mizoram (7+3) +2 School/University
Goa (7+3) +2 1975 School
Gujarat (7+3) +2 1986 School
Meghalaya (7+3) +2 1994-95 School
Source: Education in India, MHRD, Government of India, 2001
B. Enrollment
3.3 There are 28 million students enrolled in secondary and higher secondary education in the country representing a Gross Enrollment Ratio (GER) of 35 percent. Two thirds of those students enrolled in upper primary and a fourth of those enrolled in primary continue on into secondary (Figure 1). The median growth rate in secondary (6.45) is higher than in upper primary (5.61) and primary (3.95). Though the rate of increase in secondary is higher
than in upper primary and primary, the recent increase in primary enrollment is not reflected yet in the enrollment in upper primary and secondary education. It is likely that this increase will take place over the next few years, which has both policy and financial implications discussed later in the paper. In terms of the proportion of boys to girls over the last few decades, enrollment has improved from 13 percent to 38 percent. However, the GERs reflect a continued gender gap for boys and girls. The GER for boys is 42 percent and that for girls, 28 percent. Net Enrollment Ratios are not available. If the increase in enrollment is considered over the last 50 years, except during the last decade, enrollment appears to have almost doubled each decade. In the last ten years, enrollment has increased by about 30 percent. During this period, girls’ enrollment has increased more than that of boys — 55 times for girls and 13 times for boys. However, the gap between boys and girls’ enrollment continues to be large.
3.4 Certain populations in India have traditionally been disadvantaged and these communities are officially referred to as Scheduled Caste (SC) and Scheduled Tribes (ST). The proportion of SC and ST students is much less than their share of the population. In 1999, SC enrollment represented seven percent of the total enrollment in secondary, whereas their share in the population is 14 percent.
The situation was worse in senior secondary where only two percent were enrolled. Similarly with the ST community, which constitutes about eight percent of the population, 2.6 percent of the students were enrolled in secondary and 0.8 percent in senior secondary. Within these groups, the small percentage share of girls’ enrollment is also a concern. The low representation of SC and ST students in SE and HSE does highlight the issue of equity that needs to be addressed. SE and HSE graduates among the minority population are also low. Taking economic levels into consideration, only 20 percent of students from the lowest income quintile are enrolled in SE and HSE (World Bank 2002b). Thus caste and income inequity in secondary education will need to be addressed.
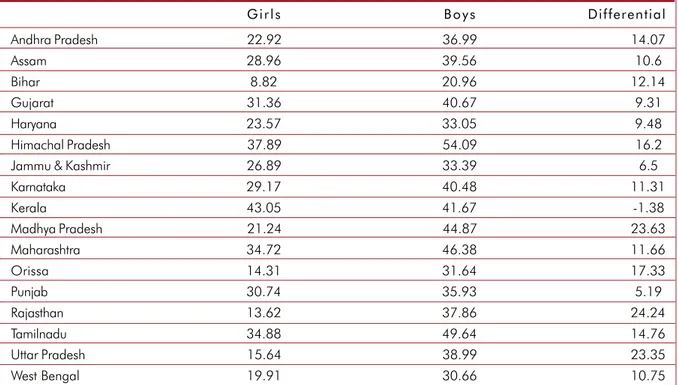
3.5 State variations in enrollments and GERs are evident (Table 2). For both boys and girls, Himachal Pradesh, Gujarat, Kerala, Tamil Nadu, and Maharashtra represent States with higher enrollment (range here is 30 to 54 percent). While the enrollment for boys is fairly high in Madhya Pradesh (44 percent), the State has not done well with girls’ enrollment (21 percent). Girls’ GERs in Uttar Pradesh, Rajasthan and Orissa are low (14 to 16 percent) and in Bihar particularly low (under 10 percent). While the difference between GERs of girls and boys range between 1 to 17 percent in most of the States, in Madhya Pradesh, Uttar Pradesh and Rajasthan the difference is over 20 percentage points. In a national program of secondary education, the regional variations indicate
Selected Educational Statistics (different years)
Figure 1: Comparative enrollment
across levels of education
the necessity for adopting different strategies that address each State’s distinctive issues and contexts in any program of reform in the sub-sector. In addition, it indicates the need for States to define the role and size of secondary education according to its needs and within an overall plan to develop education in the State.
3.6 In those States where universities offer HSE, 25 percent of the enrollment in higher secondary is in colleges or universities and thus not a part of school education. In terms of subject choices in higher secondary education, only 1993 data is available. Humanities or the arts is the most popular with 48 percent of the students (53 percent girls) opting for this stream, followed by Science with 28 percent (23 percent for girls). More students opting for the Humanities rather than the Science stream is intriguing and must be a response to both the limitations of elementary education and students’ perceptions of their inability to master science subjects. It is likely that instruction in the sciences are weak. This difference in enrollment between the Humanities and the Science streams was exacerbated when rural and urban locations were considered – more rural students (59 percent) opted for Humanities than the urban students (41 percent). After Humanities and Science, Commerce, Agriculture and Vocational Education streams were the other choices for higher secondary students.
Enrollment patterns in the different streams and the quality of science instruction especially in rural schools are areas of concern for development of this level of education.
3.7 Three types of institutions — private, aided and government schools — capture overall enrollment in SE and HSE.
7Government schools are fully financed by either Central or State governments
7
Within the government sector itself both State and local governments are responsible for education. Local governments could include those at the district or Panchayat level or the municipalities, which are local governments in urban areas. In addition, there are providers specific to a certain State. For example, in Andhra Pradesh there is a society known as the AP Residential Educational Institutions Society responsible for residential schools. In Maharastra, the Social Welfare
Department runs Ashram schools in the State. It is not known how large these providers are since they are included within the category of “government.”
Table 2: State Gross Enrollment Ratios
Girls Boys Differential
Andhra Pradesh 22.92 36.99 14.07
Assam 28.96 39.56 10.6
Bihar 8.82 20.96 12.14
Gujarat 31.36 40.67 9.31
Haryana 23.57 33.05 9.48
Himachal Pradesh 37.89 54.09 16.2
Jammu & Kashmir 26.89 33.39 6.5
Karnataka 29.17 40.48 11.31
Kerala 43.05 41.67 -1.38
Madhya Pradesh 21.24 44.87 23.63
Maharashtra 34.72 46.38 11.66
Orissa 14.31 31.64 17.33
Punjab 30.74 35.93 5.19
Rajasthan 13.62 37.86 24.24
Tamilnadu 34.88 49.64 14.76
Uttar Pradesh 15.64 38.99 23.35
West Bengal 19.91 30.66 10.75
Source: Calculated on the basis of provisional enrollment figures provided in Selected Educational Statistics 1999-2000,
and estimated population size for 14-17 years.
and in States managed by either government or local bodies. In most government schools, the medium of instruction is the State language with English as a second language. Aided schools are managed privately by individuals, trusts, societies or corporate bodies but funded largely by government. The government is responsible for the entire recurring costs for these schools while the management is responsible, fully or partially, for the physical facilities and administration. The
MA
Figure 3: Higher secondary school distribution by management
Source: Education in India, MHRD, Government of India, 2001
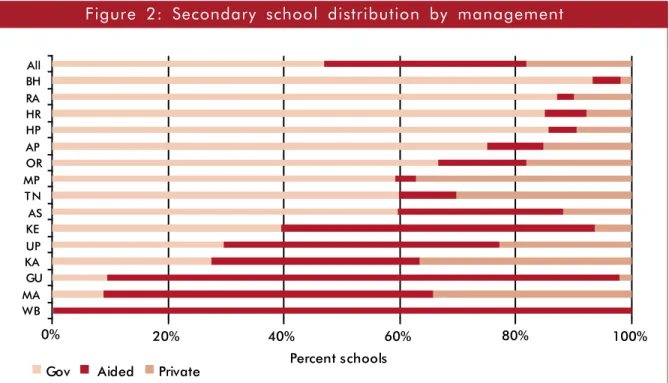
Figure 2: Secondary school distribution by management
Source: Education in India, MHRD, Government of India, 2001
8
There are different ways in which a school can be aided. It can receive government support when it starts functioning or it
can receive support after a few years of being independent. In the latter case, the schools receive incrementally higher levels
of funding over the years.
medium of instruction could be English or the local language. The aided schools are an important way in which the government makes use of the private sector to provide education.
8The private schools are mainly English medium and managed and financed privately. The question of the number of schools that fall into each of these categories within States has considerable implications for the financing and administration of secondary education.
3.8 The share of the three types of schools varies across States (Figure 2 and 3).
9Except for the States in which the aided schools are strong, government involvement in SE and HSE is fairly substantial. The share of private schools for secondary (18 percent) is higher than that for higher secondary (13 percent), and this could possibly be due to the share of higher secondary that is part of university education, which is not accounted for in these figures. In secondary education in Madhya Pradesh, Maharastra and Karnataka, the private share is over 30 percent followed by Tamil Nadu and Uttar Pradesh. In higher secondary, Andhra Pradesh has the highest proportion of private secondary schools (44 percent), followed by Haryana, Madhya Pradesh, Karnataka and Tamil Nadu with over 20 percent.
3.9 For reasons that are perhaps, historical and political, in four States – Uttar Pradesh, Gujarat, Maharastra, and West Bengal for HSE and West Bengal and Gujarat for SE — the share of aided schools is the largest, accounting for over 50 percent (54 to 99 percent) of schools in these States.
Taking SE and HSE together for the country, aided schools account for 35 percent. Compared to primary schools where the aided sector is weak in rural areas, the aided sector in SE and HSE in a few States is quite strong in rural areas. While aided schools account for the highest proportion
Source: Sixth All-India Educational Survey (NCERT, 1993)
9
While there is recent data available on the number of institutions falling into the three categories —private, aided and public
— at the national level, data on student enrollment in the three types of institutions is only available from the NCERT 1993 survey.
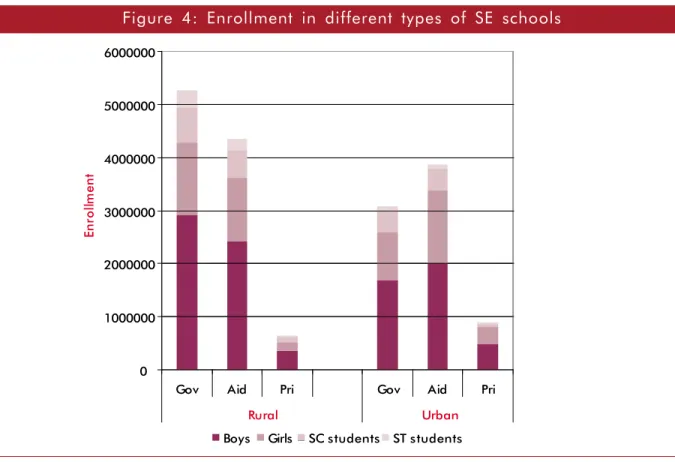
Figure 4: Enrollment in different types of SE schools
of students at this level, there has been an increase of 13 percent in enrollment in government schools between 1993-96 and a corresponding decrease in the aided schools reflecting the decline in support for aided schools across States. Girls’ enrollment is comparable to boys’ enrollment
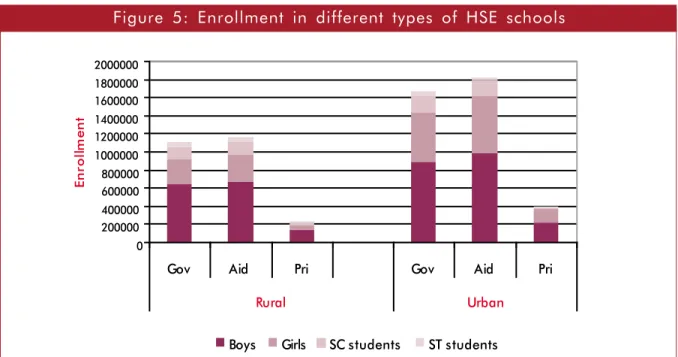
Figure 5: Enrollment in different types of HSE schools
Source: Sixth All-India Educational Survey (NCERT, 1993)
Table 3: Crude transition and dropout across grades
% in SE % in HSE % in 10 % in 11 % in 12 Drop- Repea- from UP from SE from 9 from 10
#from 11 out* ters*
Andhra Pradesh 43 70 87 97 77
Assam 37 56 85 85 76 10.11
Bihar 42 36 86 209 83 .9
Gujarat 47 46 8157 80 72 2.02
Haryana 5160 95 70 77 50 1 5.53
Himachal Pradesh 50 56 105 65 69 42 12.4
Jammu & Kashmir 40 38 73 43 104 65
Karnataka 40 96 88 108 88 68 4.0
Kerala 58 27 80 80 24
Madhya Pradesh 35 60 99 6196 66 3.97
Maharashtra 44 45 77 92 59 3.58
Orissa 45 68 89 100 52 2.21
Punjab 56 48 106 47 96 42 6.08
Rajasthan 23 5166 65 96 79 7.71
Tamilnadu 45 46 97 5181 58 6.5
Uttar Pradesh 48 40 96 39 110 61 12.6
West Bengal 38 50 73 63 86 82
Source: Selected Educational Statistics 1999-2000; Annual Report 1999-2000
#blank spaces are States that have large enrollment in colleges for which information is unavailable
*for Grades I-X
more in urban than in rural areas. Representation of SC and to a lesser extent, ST students (Figure 4 and 5) across different types of institutions is evident though in very small numbers and more in rural areas.
C. Retention and Transition
3.10 The information on retention, repetition and transition in SE and HSE is very limited. Due to the paucity of data, crude retention levels have been calculated (Table 3) based on the number enrolled in a particular year as a percent of those enrolled in the previous year. With the exception of Rajasthan, the range for enrollment in secondary education as a proportion of upper primary ranges from 35 to 58 percent across States. The transition from upper primary to secondary for Rajasthan is particularly weak (23 percent). Excluding Kerala, there appears to be a higher transition from SE into HSE, (the range is 36 to 96 percent) and from Grade 11 to 12 (over 70 percent).
3.11 Interestingly, Kerala’s transition rate from secondary to higher secondary is alarmingly low at 27 percent. Possible causes for this dropout could be the low quality of secondary education in Kerala or the policy of automatic promotion, which allows students to move up the grades without passing an examination. Without examinations to test learning, students transit from grade to grade easily.
However, when they have to face certification examinations, they tend to drop out of the system.
Having said this, the Kerala picture communicated by the data is confusing. For example, Kerala has the lowest dropout here at 24 percent but the transition rate from upper primary to secondary is only 58 percent and from SE to HSE 27 percent.
3.12 Over 100 percent retention in Grades 10 through 12 suggests that students are enrolling after a break of a few years, or immigrating into the State from other States.
10In fact if one considers the number of students who appear for the certification examinations, 21 percent are not regular students. Some of these students enroll in schools just before the examinations. This phenomenon does reflect the inefficiency of the system, though it could also be taken as a symbol of student persistence in procuring SE and HSE certification.
3.13 The National Sample Survey Organization (NSSO) 52
ndRound (Table 4) provides comparative data on dropout across levels. The levels of dropout appears to be fairly close across Grades I to X and reduced in higher secondary. Within secondary, dropout is relatively higher in the urban areas than in the rural areas, possibly indicating greater opportunities for work in urban areas.
Repetition rates on the average (Table 3) are around 5 percent, which is not high especially when compared to the rate of failure in examinations discussed below. This suggests that, as is the case Table 4: Per 1000 distribution of dropouts among ever enrolled but
currently not attending (age 5-24 years) by level at which dropped out
Level Rural Urban
Male Female Male Female
Primary 304 369 224 219
Middle 274 264 238 246
Secondary 287 245 340 338
H Secondary 78 61 111 105
Higher edu. 27 14 65 70
10
The figure in lower grades could indicate movement from unrecognized to recognized schools. However, in secondary and higher secondary, because Board exams are involved and all schools have to be recognized, this is unlikely.
Source; NSSO 52
ndround 1995-96
with Kerala, students are in essence pushed through the system and then at the end are unsuccessful in the final examinations.
D. Student Performance
3.14 The certification process in all States in India is based on “public examinations” that have to be cleared at Grade 10 for secondary education and Grade 12 for higher secondary. Public examinations at the State level are offered by what are called “Boards of Education,” which essentially certify students in their respective State.
11The Board in one State is independent of Boards in other States. In some States, the Boards are common for both SE and HSE; in others, each level has a
separate Board. The way in which these Boards are set up and their respective roles and responsibilities vary across States. In most States, the Boards are statutory autonomous bodies established through an Act of State legislature. In four States— Andhra Pradesh, Karnataka, Kerala and Tamil Nadu—the Boards are dependent organizations located within departments of education. It is not clear whether autonomy allows Boards to function differently or more effectively from those Boards that are not autonomous.
3.15 Grade 10 examinations are in many States the second public examination for students who have had to pass a public exam at the end of elementary school. Students have to obtain 33 percent marks in each subject and 35 percent in the aggregate to be successful in the examination, which indicates that they only have to know a third of the curriculum in order to pass. Except in Rajasthan and Tamil Nadu,
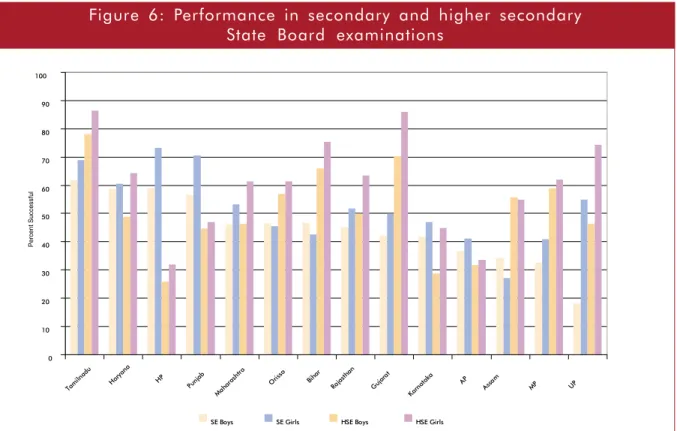
Percent Successful
Figure 6: Performance in secondary and higher secondary State Board examinations
Source: Results of High School and Higher Secondary Examinations 1997 & 1998, MHRD, Government of India, 2000
11
The Council of Boards of Secondary Education (COBSE) was set up in 1979 to enable links between the different State examination
Boards in the country. Though COBSE grants recognition to Boards and is involved in encouraging States to reform the examination
system, the success of this organization is limited mainly because States are not responsive to Central suggestions and there are no
incentives in place to encourage receptiveness to reform.
certification is based solely on the performance of students in the final examination. In Rajasthan and Tamil Nadu, a small percent of the final grade is based on internal evaluation. However, internal evaluation is still based on performance in examinations (half-yearly examinations conducted within the school) and not on assessment of skills such as verbal participation in class or class work.
3.16 The type of questions asked during these examinations varies across States. Questions could be objective or descriptive and the criteria used to evaluate student responses also differ across States. By and large the memory power of students is tested during these examinations. For example in Clarke’s study of classroom practices (2001), teachers’ notion of a good answer script in social studies is one in which all the facts are provided and for mathematics all the “steps”
required to solve a problem are done correctly. Examinations often do not support the development of problem solving skills, application of knowledge and analysis of information.
3.17 Figure 6 portrays the success of students in the State Boards. The performance of students in HSE is only available for the government and aided schools and not for colleges. In the years 1993 to 1998, only 42 to 49 percent of the students for SE, and 47 to 59 percent for HSE were successful.
This indicates the very low quality of education offered in government schools. Of the total number of students who appeared for State Board examinations, only 33 percent were girls. However, taking both SE and HSE together, girls obtain higher scores (2 to 36 percent) than boys across States. In SE, girls’ performance is lower than boys in only three States —Assam, Bihar and Orissa— while in HSE, girls’ perform better than boys across all States.
3.18 Apart from the State Boards, there are two other Boards that certify students in secondary and higher secondary education—the Council for Indian School Certificate Examinations (CISCE) and the Central Board of Secondary Education (CBSE).
12CISCE and CBSE are national Boards based in Delhi and operating in most of the States for both SE and HSE certification. Students who
12
The National Open School started in 1989, which also certifies students in secondary education will not be discussed in detail in this report. This program offers students who have dropped out of the system for various reasons a chance to complete secondary education through a self paced curriculum. Several States have started State Open schools. The enrollment in the NOS system is small compared to the established Boards of education. The Anglo Indian High School examinations for SE and HSE is also offered in a few States in India and is also not included in this study since the participation is very small.
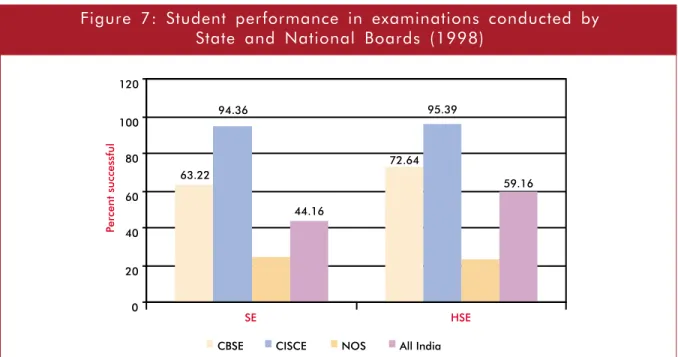
Source: Results of Secondary and Higher Secondary Examinations 1997 & 1998, MHRD, Government of India, 2000
Figure 7: Student performance in examinations conducted by
State and National Boards (1998)
participate in these more competitive Boards are often from higher socio-economic backgrounds.
In addition to laying down standards for schools, these Boards stipulate the curriculum and conduct examinations. The CISCE is a registered society functioning as a non-government organization.
13The medium of instruction is English and there are about 1100 schools in the country privately owned or run by religious trusts that offer these examinations. The CISCE curriculum has its own process of curriculum administration and development. The CBSE was established in 1929 and is a registered society responsible for 6000 schools across the country. This number includes 1400 schools run by the Delhi government, 800 Kendriya Vidyalaya Sangathan (KVS) schools, 480 Navodaya Vidyalaya Samiti (NVS) schools, and 3300 private schools across the country. CBSE has adopted the complete national curricular guidelines.
3.19 Figure 7 portrays the differences in achievement by the State and national Boards. On the average across States, 44 percent students in SE and 59 percent in HSE passed in the State Board examinations.
In contrast, about 95 percent of the students appearing for SE and HSE through CISCE passed. In the CBSE conducted examinations, the pass rates for SE and HSE were 63 and 73 percent respectively.
Pass rate through the National Open School (NOS) was the lowest at 23 percent.
3.20 Inequity is perhaps most evident in this certification process for SE and HSE. The proportions of SC and ST students (12 percent and 4 percent respectively of the total examinees) who appear for the examinations are low and the proportion of girls to boys within SC and ST communities appearing for certification are also low – for SC girls 24 percent and for ST girls 26 percent. Within SC, girls outperform the boys across States and within ST in some States girls perform better than boys. In CBSE, there are large differences between all students and SC students, reflecting the limitations of students from disadvantaged communities in a more competitive system.
E. Vocational Education
3.21 The first Commission which dealt with school education, the “Indian Education Commission” (1882- 83), included a focus on secondary education, suggesting diversification of courses of instruction:
“in the upper classes of schools there should be two divisions – one leading to the entrance examination of Universities, the other of a more practical character, intended for youth interested in commercial or other non-literary pursuits.” This suggestion was unevenly implemented over the years. The 1964 Education Commission advocated that 20 percent of the enrollment in SE and 50 percent of HSE be vocational, and the 1986 policy advocated an overall 25 percent. More recently, the Central government with the intention of expanding this sub-sector, initiated the 1988 Centrally sponsored scheme to vocationalize education “to enhance individual employability, reduce the mismatch between the demand and supply of skilled manpower and to provide an alternative for those pursuing higher education without particular interest or purpose.” Pre-vocational courses were introduced in 1993-94 “to impart training in simple marketable skills to the students of Grades 9 and 10, to develop vocational interests and to facilitate students in making a choice of vocational courses at the higher secondary level (MHRD Annual Report, 1995-96, p.47).”
3.22 Based on the most recent data available (1993), 4.8 percent of the share of enrollment is in vocational courses. The success of vocational education has been limited. The reasons for this include outdated equipment, unqualified instructors, irrelevance of curricula, and lack of textbooks and instructional material. In addition, the limited way in which vocational education is understood within a State’s overall system of education for this level has also contributed to its limited achievement. While this was a Centrally sponsored scheme, according to Shariff and Ghosh (2000), the funding allocated within the overall education budget for vocational education by the Central government was small (3.2 percent) compared to the allocation for Kendriya Vidyalaya Sanghathan (46 percent) and
13
The CISCE board replaced the Cambridge Local Examination Syndicate after Independence. It enjoys a distinctive status
because of its previous connections with the Inter-State Board of Anglo-Indian Education.
Navodaya Vidyalaya Samiti (34 percent).
14The 10
thFive-Year plan intends to expand this sector through cooperation with private enterprise and the CBSE national board.
3.23 Clearly, the conception of vocational education in its current form is narrow and involves training students for a particular occupation, which is often outdated, and less on the development of a set of generic skills that would allow students to adapt and relearn depending on the requirements of the labor market.
F. Financing
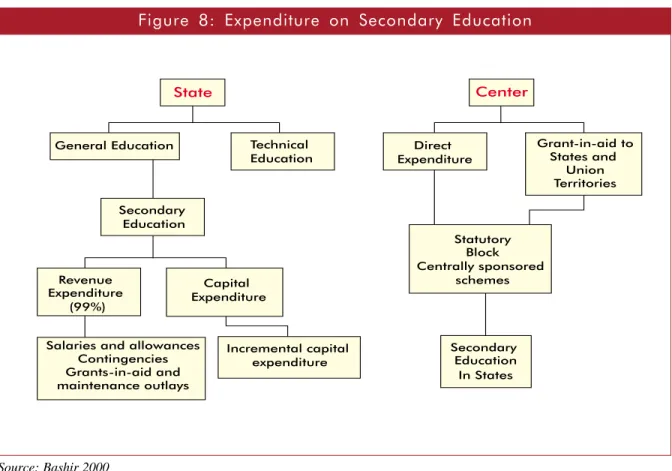
3.24 Financing has two aspects: public expenditure on secondary education and private costs to the individual student. With reference to the former (Figure 8), education is funded by State and Central government budgets through State and Central taxes and through fiscal transfers from Center to State (Bashir 2000). Taxation brings about issues of vertical and horizontal imbalances between the Center and the States and across States, which are to some extent assuaged through a system of Central transfers to the State. Three types of transfers between Center and State are identified. (i) Statutory transfers through adhoc grants from Central taxes; (ii) Block transfers supporting State plans for education;
15and (iii) Specific purpose grants also known as Centrally sponsored schemes (referred to earlier). State resources for education are mainly through tax and non-tax revenues in addition to what is received from the Center through the above methods of transfer. The content of what will be spent using both transfers and State funds are outlined in the State Five-Year-Plans. The Five-Year Plans outline what will be supported by the Center and the Annual plans define each year’s Plans at the State level.
14
For a NVS school the allocation is Rs 105 lakhs; for a KVS school Rs 68 lakhs and for a vocational school Rs 65,000.
15
The amount here is decided on the basis of population, economic status and negotiation between Finance, Planning Commission and State and Union governments.
Source: Bashir 2000
Figure 8: Expenditure on Secondary Education
3.25 Financing of secondary education has two components—Plan and non-Plan expenditure.
Plan expenditure generally does not include regular and recurrent expenditure on education (which is called non-Plan expenditure). Plan expenditure at the Central level is what is transferred to States for special programs at the state level, while non-Plan would be for example for the running of KVS schools.
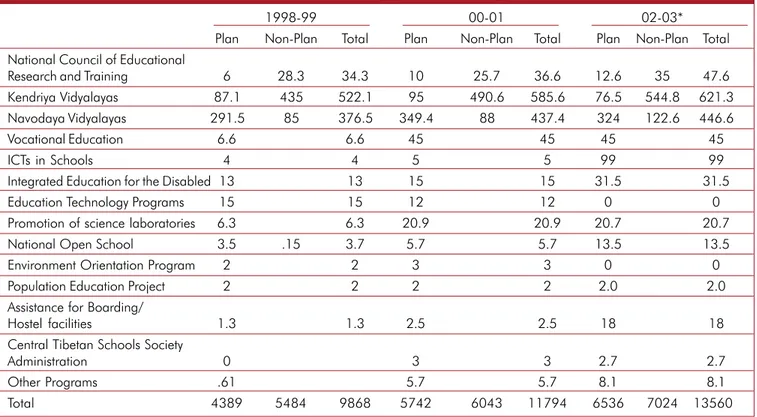
16Similarly, non-Plan expenditure at the State level Table 5: Central Government financing of Secondary Education (Rs. Crore)
1998-99 00-01 02-03*
Plan Non-Plan Total Plan Non-Plan Total Plan Non-Plan Total National Council of Educational
Research and Training 6 28.3 34.3 10 25.7 36.6 12.6 35 47.6
Kendriya Vidyalayas 87.1435 522.195 490.6 585.6 76.5 544.8 621 .3
Navodaya Vidyalayas 291.5 85 376.5 349.4 88 437.4 324 122.6 446.6
Vocational Education 6.6 6.6 45 45 45 45
ICTs in Schools 4 4 5 5 99 99
Integrated Education for the Disabled 13 13 15 15 31.5 31.5
Education Technology Programs 15 15 12 12 0 0
Promotion of science laboratories 6.3 6.3 20.9 20.9 20.7 20.7
National Open School 3.5 .15 3.7 5.7 5.7 13.5 13.5
Environment Orientation Program 2 2 3 3 0 0
Population Education Project 2 2 2 2 2.0 2.0
Assistance for Boarding/
Hostel facilities 1.3 1.3 2.5 2.5 18 18
Central Tibetan Schools Society
Administration 0 3 3 2.7 2.7
Other Programs .615.7 5.7 8.1 8.1
Total 4389 5484 9868 5742 6043 11794 6536 7024 13560
Source: India Budget (different years); *provisional
16
Transfers to States from the Center could induce States to move their own Plan expenditure to other sectors thus reducing State expenditure on education. Plan expenditure for one year for items such as salaries etc could become “non-Plan expenditure” which is regular education expenditure in the following years. Civil work expenditure always remains Plan expenditure.
Source: Bashir 2000
Figure 9: Central government expenditure on different
sub-sectors in education
is for the regular functioning of the system while Plan expenditure is for special programs.
3.26 Table 5 lists the main programs funded by the Center. Kendriya Vidyalayas and Navodaya Vidyalayas, described earlier in paragraph 2.3, receive most of the funding. However, within the Central government expenditure, when secondary education is considered independent of elementary education (Figure 9), there is a sharp decrease in total Central government expenditure over the last decade from 24 percent in 1991 to 16 percent in 1998. Similarly, Plan expenditure declined from 19 percent to 8 percent. On the other hand, percentage expenditure on elementary education has increased to 33 and 40 percent of Total and Plan expenditure respectively. Compared to elementary education (36 percent), the growth rate in secondary education between the years 1991 to 1998 is 13 percent. This level of expenditure indicates the intention of the government to focus, thus far, more on elementary education rather than secondary education in order to meet the
Source: Bashir 2000
Figure 11: Percent expenditure of total education expenditure on secondary and higher secondary education across States (1999-2000)
Figure 10: Total expenditure on secondary education by Center and State
Source: India Budget different years
constitutional obligations of universal elementary education. The 10
thFive-Year Plan as discussed above could change this scenario, allowing SE and HSE to receive much more funding for improvements in this sub-sector.
3.27 While the Central government does provide some funds for secondary education, this amount is small compared to what the States spend on education (Figure 10). While Central funding is quite substantial in terms of Plan expenditure, the share of non-Plan expenditure is very small (about 3 percent).
3.28 There are two budget categories at the State level—General and Technical (Figure 8). The main source of funding for SE and HSE would be from the category of “General Education.” Within the State’s overall budget for education, the share of expenditure on SE and HSE ranges from 17 percent in MP to 38 percent in Maharashtra (Figure 11). If the State expenditure is examined, there are only a few schemes or little Plan expenditure on secondary education. Staff salaries constitute over 90 percent Table 6: Comparison of expenditure on secondary education of selected countries
GNP GNP Average GER GNP Percent Per pupil
growth per annual expenditure on secon- expenditure
capita population on education dary edu- as percent
growth cation of GNP per
rate capital
Argentina 4.2 8950 1.3 77 3.5 34.8 15
Brazil 2.2 970 1.5 56 5.1 20.3 14
China 10.0 860 1.1 70 2.3 32.2 12
India 4.3 370 1.8 49 3.3 26.5 18
US 1.7 29080 1.0 97 5.3 36.5 24
UK 1.9 20870 .2 129 5.4 44 20
Figure 12: Average education expenditure of school going adolescents in India
Source: NSSO 52
ndround 95-96 (calculated)
Source: World Education 2000
of the budget at the State level. Even when States do receive funds from the Central government for the Plan budget, due to financial deficits, the amount is used for expenditure, which would normally come under the non-Plan category. The funding for secondary education within the context of decentralization specified in the 73
rdand 74
thConstitutional Amendments will have implications for funding in secondary education. At the present States release untied funds to panchayats or local governments, which can be used for secondary education.
3.29 The expenditure on secondary education in India can be compared to expenditure on secondary education in other countries (Table 6). Except for China, expenditure on education in India as a percentage of Gross National Product (GNP) is low. In addition, the proportionate expenditure on secondary education is also low, though per pupil expenditure as percent of GNP per capita is higher than Argentina, Brazil and China. This suggests that unless spending on secondary education increases and more importantly, per pupil expenditure becomes more targeted and efficient, it will not be possible to improve this sub-sector.
3.30 When private costs for the secondary school student in India is considered, the highest costs are incurred on books, private tuitions, uniforms and school tuition fees. Data is not available comparing urban public and private schools or rural urban and private schools, though information is available comparing costs for rural and urban, and private and public school students (Figure 12). The data suggests that public school students incur a fair share of household expenses for their education.
The cost of private tuition and school tuition fees clearly distinguishes urban and rural schools as well as private and public schools. An interesting question to ask here is that if no private tuitions were available would private school students’ performance be similar to that of public school students? The extent to which a student can afford private tuition as a determinant of success relative to school quality is an area that needs to be examined.
IV. ISSUES IN SECONDARY EDUCATION
4.1 Both secondary and higher secondary education in India has developed over the years through some amount of planning at the national level but for the most part, until recently, naturally and inevitably in the States. In examining issues in this sub-sector, the need for deliberate planning for this level of education at the State level and its integration into the broader strategy for education in the States is highlighted. This section includes a discussion of the positioning of secondary education, improving quality in SE and HSE, and the financing of SE and HSE nationally and in the States.
A. The Positioning of Secondary Education
4.2 Three areas are discussed that deal with the positioning of secondary education in the country.
First is the issue of whether this sector should expand and how large it ought to be. Only an average of 35 percent of the eligible school age population in the country attends secondary school.
Based on the pattern of increase in enrollment over the last 50 years, the increased demand for primary education and the fact that secondary schools now only cater to a quarter of the primary school students, an increase in the demand and size of the secondary school sub-sector seems inevitable. The recent analysis (World Bank, 2002b) of the rates of returns to education in India suggests the positive effects of expanding this sector. Working secondary school graduates earned salaries 2.9 times higher than that of illiterate workers and 1.7 times that of workers with primary school education. The benefits were higher for female workers with secondary education.
17The private rate of return for females with secondary education was 50 percent and for males 14
17
Bashir in this World Bank report also found that the differential gap between the workers with different educational
backgrounds increased with age..
percent; the public rate of return was 13 and 40 percent respectively. A recent study by Godo (2002) comparing economic growth and its relationship to education in the US, Japan and Korea demonstrates the growth in secondary and vocational education playing a critical role in each country’s rapid development.
18The impact of secondary education on economic development is not the only criteria for developing this sub-sector, and while it has not yet been quantified, the impact of secondary education on empowering individuals to take control of their situation cannot be underestimated.
4.3 The question then, is how should governments respond to this demand and define the size of the sector? Since States are mainly responsible for providing secondary education and for ensuring the quality of education, it will be important for State departments of education to make deliberate decisions on how large this sector should be based on the requirements for an educated labor force, the relative needs and capacity of higher education and on the question of which communities should be given more encouragement based on issues of equity. Estimating the requirements of the labor force suggests the need for close collaboration of this sub-sector with the departments that deal with labor and industry. Figure 13 indicates that 20 and 40 percent of the rural and urban SE and HSE school male graduates respectively are in the workforce. The number is much less for females. More students proceed to higher education in the urban areas than from the rural areas.
Most of the southern States and few of the northern States have expressed their concern regarding an adequately trained labor force and are beginning to address this issue. Karnataka has gone a step further in doing a detailed and comprehensive situational analysis of SE and HSE and is discussing ways to reform SE and HSE to be more in line with the requirements of the labor market. With reference to equity, considering the low enrollment of female, SC and ST students, the growth of student enrollment from these groups is an area that requires specific attention.
Source: Census 1991. 1: Illiterate 2: Without primary 3: Primary 4: Upper Primary 5: Secondary 6: Higher Secondary.
Figure 13: Workers with their respective qualifications
18
The paper by Yoshihasa Godo from Meiji Gajuin University in Japan was presented at the Bank in May 2002. Godo
makes the point that Japan and Korea have had to give considerable attention to education in order to reach levels similar to
the US, allowing these countries to have sufficient human capital to influence economic “catch up” with the US. Korea was
slower than Japan. Elementary and secondary education was critical in this process and not so much higher education.
4.4 Secondly, there is the issue of the institutional location and responsibility for secondary education in the States. Two aspects define this issue. The first is the extent to which private, aided and government institutions will cater to secondary and higher secondary enrollment. Clearly, private institutions may not be able to accommodate students from the poorest quintiles. On the one hand, the decline in aided school enrollment over the last decade indicates the State governments’ declining support for publicly subsidized private education. On the other hand, the increase in government school enrollment demonstrates that students from the poorer quintiles, unable to afford private secondary schools, are joining the government system with its low quality. This situation suggests that governments must decide whether to enlarge the aided or publicly subsidized private education or concentrate its efforts on increasing access and on improving the quality of government secondary schools, which will indeed be expensive. Perhaps, in addition to improving the quality of government secondary schools, support could be given to aided schools, which could reduce the burden on government schools. It will be important while rethinking support to aided schools, to ensure that a regulatory framework and an accountability system are in place to ensure adequate student performance in these schools. The possibility of involving the private sector through vouchers is an intervention that is being explored in several countries. The voucher scheme involves the provision of funding to the individual student to choose a private provider.
19This scheme while supporting school autonomy, could precipitate private schools to work on improving quality and thus draw students into the system.
4.5 The sharing of higher secondary with the university system in some States is another aspect, which has administrative and financial implications. The question of whether this dual administration will continue in these States needs to be addressed. While at the national level, there is support for transferring all HSE education to schools, understandably the politicization of this issue makes it difficult for some States to implement this transfer. However, in order to regulate and monitor this sector as a whole, and if universities are going to continue to be providers of HSE, their role and reach in the student population will have to be incorporated into the total plan for SE and HSE in the State. If the State is able to implement the policy of closing down the university provision of secondary education, then the focus of reform could be confined to HSE in schools. The point made here is that if higher education is going to be involved, it will be important to ensure integrated planning and management with school education with regard to HSE. If this does not take place there will be confusion and duplication of services provided within the State, which would later be difficult to rationalize.
4.6 Thirdly, the content of secondary education must be considered in positioning secondary education in the State and in the country. While this is an issue of national and State sovereignty, there is undoubtedly an impact of the content of education at this level on the economic development of the States and the country as a whole.
20The success achieved in providing personnel for the Information Technology industry is a case in point. The strong emphasis on mathematics in secondary education (mostly in the private and aided school sector) and the expansion of the private provision of post- higher secondary information technology (IT) training at the right time, helped this industry develop nationally and internationally. Similarly, the contribution of secondary and higher secondary in the future will depend upon how States respond to the local, national and international requirements in
19
Gauri and Vawda (2003) discuss the relative benefits of the voucher scheme based on a literature review. In both
industrialized and developing countries they found that vouchers were useful when they are targeted for the poor and operate in an urban setting especially when there is collaboration with existing private schools.
20