on a solar based power system in West Africa
Inaugural-Dissertation zur
Erlangung des Doktorgrades
der Mathematisch-Naturwissenschaftlichen Fakultät der Universität zu Köln
vorgelegt von Ina Neher
aus Friedberg (Hessen)
Köln, 2020
Prof. Dr. Stefanie Meilinger Prof. Dr. Stephanie Fiedler
Tag der mündlichen Prüfung:
26.06.2020
For a sustainable development the electricity sector needs to be decarbonized. In 2017 only 54% of the West African households had access to the electrical grid. Thus, renewable sources should play a major role for the development of the power sector in West Africa. Above all, solar power shows highest potential of renewable energy sources. However, it is highly variable, depending on the atmospheric conditions.
This study addresses the challenges for a solar based power system in West Africa by analyzing the atmospheric variability of solar power. For this purpose, two aspects are investigated. In the first part, the daily power reduction due to atmospheric aerosols is quantified for different solar power technologies. Meteoro- logical data at six ground-based stations is used to model photovoltaic and parabolic trough power during all mostly clear-sky days in 2006. A radiative transfer model is combined with solar power model. The results show, that the reduction due to aerosols can be up to 79% for photovoltaic and up to 100% for parabolic trough power plants during a major dust outbreak. Frequent dust outbreaks occurring in West Africa would cause frequent blackouts if sufficient storage capacities are not available. On average, aerosols reduce the daily power yields by 13% to 22% for photovoltaic and by 22% to 37% for parabolic troughs.
For the second part, long-term atmospheric variability and trends of solar irra- diance are analyzed and their impact on photovoltaic yields is examined for West Africa. Based on a 35-year satellite data record (1983 - 2017) the temporal and spatial variability and general trend are depicted for global and direct horizontal irradiances. Furthermore, photovoltaic yields are calculated on a daily basis. They show a strong meridional gradient with highest values of 5 kWh / kWp in the Sahara and Sahel zone and lowest values in southern West Africa (around 4 kWh / kWp).
Thereby, the temporal variability is highest in southern West Africa (up to around 18%) and lowest in the Sahara (around 4.5%). This implies the need of a North- South grid development, to feed the increasing demand on the highly populated coast by solar power from the northern parts of West Africa. Additionally, global irradiances show a long-term positive trend (up to +5 W / m
2/ decade) in the Sahara and a negative trend (up to -5 W / m
2/ decade) in southern West Africa. If this trend is continuing, the spatial differences in solar power potential will increase in the future.
This thesis provides a better understanding of the impact of atmospheric vari-
ability on solar power in a challenging environment like West Africa, characterized
by the strong influence of the African monsoon. Thereby, the importance of aerosols
is pointed out. Furthermore, long-term changes of irradiance are characterized con-
cerning their implications for photovoltaic power.
Um eine nachhaltige Entwicklung umzusetzen muss der Stromsektor dekarbonisiert werden. Im Jahr 2017 waren 54% der westafrikanischen Haushalte nicht an das Stromnetz angeschlossen. Deshalb sollte dort für die Entwicklung des Stromnetzes auf erneuerbare Ressourcen gesetzt werden. Wegen des hohen Potentials wird ins- besondere Solarenergie eine entscheidende Rolle spielen. Jedoch ist diese stark von den atmosphärischen Bedingungen abhängig.
In dieser Arbeit werden die Herausforderungen für ein solar betriebenes En- ergiesystem in Westafrika untersucht. Dabei wird im ersten Teil der Einfluss von atmosphärischen Aerosolen quantifiziert. Meteorologische Daten aus dem Jahr 2006 von überwiegend klaren Tagen an sechs Messtationen werden genutzt, um den Er- trag eines potentiellen Photovoltaik- und eines Parabolrinnenkraftwerkes zu model- lieren. Während eines Sandsturms können Aerosole für eine Ertragsreduktion von bis zu 79% bei Photovoltaik- und von bis zu 100% bei Parabolrinnenkraftwerken verantwortlich sein. Im Durchschnitt reduzieren Aerosole den Ertrag von Photo- voltaikanlagen um 13% bis 22% und von Parabolrinnenkraftwerken um 22% bis 37%.
Im zweiten Teil werden die langfristige atmosphärische Variabilität und generelle Trend analysiert und deren Einfluss auf Photovoltaikerträge in Westafrika beleuchtet. Basierend auf Satellitendaten (1983 - 2017) werden sowohl zeitliche und räumliche Variabilität als auch Trends der Global- und Direktstrahlung bes- timmt. Außerdem wird der Photovoltaikertrag anhand von Tageswerten berechnet.
Der Ertrag zeigt eine starke meridionale Abhängigkeit mit höheren Erträgen und niedrigerer Variabilität in der Sahara und Sahel Zone (mehr als 5 kWh / kWp und etwa ± 4.5%) und niedrigeren Erträgen und höherer Variabilität im südlichen Westafrika (etwa 4 kWh / kWp ± 18%). Hier wird sichtbar, dass ein Netzausbau in Nord-Süd Richtung notwendig ist, um die bevölkerungsreiche Küste mit Solarstrom aus der nördlichen Region zu versorgen. Zusätzlich ist ein positiver Trend (bis zu +5 W / m
2/ Dekade) der Globalstrahlung in der Sahara und ein negativer Trend (bis zu -5 W / m
2/ Dekade) im südlichen Westafrika zu erkennen. Setzt sich dieser Trend weiter fort, werden sich die regionalen Unterschiede im Solarenergiepotential in Zukunft noch verstärken.
Diese Arbeit verbessert das Verständnis der atmosphärischen Einflüsse auf So-
larenergie in einer vielfältigen Region wie Westafrika. Die Bedeutung des Aerosol-
einflusses wird deutlicher, insbesondere in Wüstenregionen. Außerdem werden
langzeitliche Veränderungen der Strahlung charakterisiert und deren Einfluss auf
Photovoltaik aufgezeigt.
1 Introduction 1
1.1 Motivation and state of the art . . . . 1
1.2 Thesis overview . . . . 4
2 Background 7 2.1 West Africa . . . . 7
2.1.1 Solar energy . . . . 8
2.1.2 Regional climate and aerosols . . . . 8
2.2 Solar power . . . 12
2.2.1 Photovoltaic systems . . . 12
2.2.2 Parabolic trough power plant . . . 14
2.3 Solar irradiance . . . 16
2.3.1 Absorption and scattering . . . 17
2.3.2 Radiative transfer theory and numerical solution methods . . 20
2.4 Atmospheric aerosols . . . 21
2.4.1 Aerosol formation and classification . . . 21
2.4.2 Aerosol optical properties . . . 22
2.4.3 Standard aerosol profiles . . . 23
3 Data and models 25 3.1 Ground-based measurements . . . 25
3.1.1 Aerosol Robotic Network . . . 25
3.1.2 Energy meteorological laboratory at University of Applied Sci- ence Bonn-Rhein-Sieg . . . 26
3.1.3 Further observational data . . . 27
3.2 Satellite products . . . 27
3.3 Model development . . . 28
3.3.1 Atmospheric radiative transfer model . . . 29
3.3.2 Photovoltaic power model . . . 31
3.3.3 Parabolic trough power model . . . 37
4 Impact of atmospheric aerosols on solar power 39 4.1 Model development and relevance . . . 39 4.2 Analysis at six measuring locations . . . 51 5 Photovoltaic power potential in West Africa using long-term satel-
lite data 69
6 Summary and outlook 89
6.1 Impact of atmospheric aerosols on solar power . . . 89 6.2 Variability of solar irradiance and its implications for photovoltaic
power . . . 92 6.3 Next steps for a carbon neutral electricity system in West Africa . . . 94 A Supplementary material of Publication II 97
Bibliography 110
List of Figures 126
List of Tables 128
List of abbreviations and symbols 131
Acknowledgment 135
Introduction
1.1 Motivation and state of the art
One of the biggest challenges for humanity is to sustainably live on the Earth to keep it livable for future generations. To achieve sustainable development the United Nations defined 17 goals as a call for action. These Sustainable Development Goals (SDG) aim to ”end poverty, protect the planet and ensure that all people enjoy peace and prosperity” (United Nations 2015). All these aims can be highly connected to climate conditions. The Intergovernmental Panel on Climate Change (IPCC) predicts an increasing risk for extreme weather events like droughts, floods and heat waves due to climatic changes (IPCC 2014a). These events might cause a lack in agricultural production, military conflicts or land degradation and flooding, to name only the obvious consequences. Especially greenhouse gas (GHG) emissions impact the Earth climate and force climatic changes. These GHG emissions are mainly driven by population growth and lifestyle, i.e. higher use of resources.
Globally the electricity sector is responsible for around one quarter of GHG emis- sions (IPCC 2014b). The seventh goal of the SDGs proposes to ”ensure access to affordable, reliable, sustainable and modern energy for all”. With the Paris Agree- ment (UNFCCC 2015) and according to international law the total decarbonization of the electricity sector is requested. The electricity sector depends on future de- mand and available technologies as well as on political decisions. Currently, the most promising solution to decarbonize the electricity sector are renewable energies (Delucchi and Jacobson 2011).
Especially in poor regions of the world, renewable energies can contribute to a
sustainable and more reliable electricity system. In this study we focus on West
Africa, where grid connected electricity is currently mainly based on gas, oil and
hydro power (Sterl et al. 2020a, IRENA 2018a). The electrification rate lies below
50% (in 2010-2011) in many West African countries (ECOWAS 2014) and only
54% of the households have access to the electric grid (in 2017) (Abdulrahman and
Paco 2019).
1Therewith, the West African energy sector is confronted with two major challenges. First, the rising demand and current lack in electricity supply needs to be served. Second, climatic changes and international agreements (e.g.
Paris Agreement (UNFCCC 2015)) require carbon neutral solutions (e.g. renewable energies). Many West African countries are moving toward this decarbonization of the power sector by setting high targets for renewable energy use (ECOWAS 2014).
Globally the highest technical potential of renewable energy sources is given by direct solar energy
2(SREEN 2012). By being prone to high solar insolation year around West Africa is suitable for solar based power systems (Solargis 2019).
However, the yield of solar power systems is highly variable and depends on the fre- quently changing atmospheric composition (Sengupta et al. 2017). The dependency of power supply on atmospheric conditions increases with a rising share of solar power in the electricity system. Therefore, the integration of solar power into the electricity system raises challenges for the dimensioning of power plants and storage as well as for network stability and grid development (Lorenz et al. 2011). Only with the knowledge of temporally and spatially high-resolved solar power resources, profits can be estimated and thus stimulate large scale private investments in the so- lar power sector. Furthermore, they are necessary for the integration of solar power plants into the electricity system and to secure network stability.
Shortwave global irradiance at ground is the major modulator of solar power (e.g.
Sengupta et al. 2017). Its variability highly depends on atmospheric properties, such as clouds, aerosols and water vapor as well as on the daily and seasonal cycle, due to the Earth’s orbit around the sun (Perez et al. 2016). The latter one is well known and can be calculated from astronomical formulas. The atmospheric variability depends on local conditions, which are variable in space and time. A high temporal resolution (less than one hour) of atmospheric data is required to estimate the power variability over the course of the day (Gueymard and Wilcox 2011). Therefore, the impact of clouds, aerosols and water vapor on solar irradiance needs to be investigated to enable the calculation of potential solar power. However, these quantities (clouds, aerosols and water vapor) show the largest uncertainties in weather and climate models (e.g. Rieger et al. 2017, Sengupta et al. 2017, Boucher et al. 2013).
Only a few studies investigated solar power in West Africa, focusing on different aspects, e.g. site assessment (Yushchenko et al. 2018, Ramdé et al. 2013), grid development (Adeoye and Spataru 2018) and future potential (Bazyomo et al. 2016, Köberle et al. 2015). For such studies information on solar irradiance is needed which is taken from either global climate models or long-term yearly averages. However,
1Numbers are given for the Economic Community of West African States (ECOWAS), including Benin, Burkina Faso, Cabo Verde, Cote d’Ivory, The Gambia, Ghana, Guinea, Guinea Bissau, Liberia, Mali, Niger, Nigeria, Senegal, Sierra Leone and Togo.
2Direct solar energy is defined here as the direct use of solar irradiance to produce electricity, including photovoltaic and concentrating solar power. Note that the term ’direct’ connects to the direct use of solar irradiance for power generation, by using diffuse and direct irradiance.
no temporally highly resolved solar irradiance data is used to determine the power yield of solar based systems.
There are three major types of surface solar irradiance data: measurements (including ground-based or satellite data), models (including numerical models for weather and climate prediction) and reanalyses (combining observations and mod- els). While ground-based measurements provide the most accurate information on irradiance at a certain location, such measurements are not available over larger domains. Satellite data aim to fill this gap. However, satellite retrievals are based on reflectance measurements in the visible and near-infrared spectral range. The derivation of surface radiation, requires assumptions on aerosol distribution, which is typically taken from climatologies (Mueller et al. 2015, Boucher et al. 2013). Ra- diative transfer models are well suited to investigate the impact of single atmospheric parameters (e.g. gases, clouds, aerosols). However, they depend on the accuracy and availability of the atmospheric input data and need high computational times.
Reanalyses provide high temporal and spatial resolved best estimates from historical atmospheric information combined with advanced modeling and data assimilation systems. However, the accuracy of the data highly depends on the correct descrip- tion of atmospheric phenomena and needs to be validated for each new product.
West Africa is a region with very few routine meteorological measurements.
Prominent international projects concerning the characterization of the climate were recently undertaken in West Africa, the African Monsoon Multidisciplinary Analysis (AMMA) since 2002 (Redelsperger et al. 2006) and the Dynamics-aerosol-chemistry- cloud interactions in West Africa (DACCIWA) project since 2013 (Knippertz et al.
2015). The main goal of AMMA was to investigate the West African climate and to achieve a better understanding of the West African Monsoon (WAM). The DAC- CIWA project aims to quantify the natural and anthropogenic emissions over south- ern West Africa and their impact on the atmospheric composition. During both projects many additional meteorological instruments have been deployed for con- tinuous and temporal measurements. The DACCIWA campaign included aircraft and ground-based measurements in June-July 2016 covering the pre and post-onset phase of the WAM. Furthermore, three supersites were established for longer term measurements. The data of these campaigns were analyzed concerning changes of atmospheric parameters (e.g. aerosols (e.g. Deetz et al. 2018, Cavalieri et al. 2011, Matsuki et al. 2010), clouds (e.g. Babić et al. 2019, Kniffka et al. 2019, Penide et al. 2010) and their interaction (e.g. Taylor et al. 2019, Crumeyrolle et al. 2008)).
Furthermore, the measurements were used for the evaluation of numerical weather
prediction and climate models (e.g. Hannak et al. 2017, Hourdin et al. 2010). How-
ever, up to now the campaign data have not been used to assess the potential of
solar power in the region of West Africa which is the topic of the thesis at hand.
1.2 Thesis overview
Solar energy will play a key role in the future global sustainable electricity-mix.
Here this technology is analyzed concerning the impact of atmospheric variability on power yields. West Africa is used as study region for several reasons. First, it is a region with high solar insolation year around with an average annual sum of global irradiance up to 2400 kWh / m
2(Solargis 2017). Second, the region is suffering from a lack of electricity as well as energy infrastructure and the energy system needs to be expanded to serve current and future demand.
West Africa is a particular challenging region due to the WAM, which leads to a typical annual cycle of clouds and precipitation in south and central West Africa.
This implicates regular dry and wet seasons and related variable solar irradiance.
During the dry season, with only few clouds, frequent dust outbreaks and therewith extreme aerosol loads occur. A detailed analysis of extreme aerosol loads, resulting in high reductions of solar power, can be undertaken for this region.
The central research question of this thesis ”What is the impact of atmospheric variability on solar based power systems in West Africa?” is divided into two sub- questions, each representing the focus of one result chapter.
1. What is the impact of atmospheric aerosols on concentrating and photovoltaic solar power plants (Chapter 4)?
2. How do long-term atmospheric variability and trends affect photovoltaic yields in West Africa (Chapter 5)?
In this thesis different types of solar irradiance data are used. Ground-based measurements are utilized to validate newly developed models (the ”Solar Power modeling including atmospheric Radiative Transfer” (SolPaRT) model and a lin- ear photovoltaic yield model) and satellite retrievals. A radiative transfer model, calculating surface irradiances for a given atmospheric state, is applied to analyze the aerosol impact at several locations where ground-based measurements of aerosol optical properties are available. Novel satellite retrievals covering the full region of West Africa are exploited to investigate the long-term trends and variability of solar irradiance and its implications on photovoltaic power. How these different data sets and tools are used to answer the two main questions is detailed in the following.
1. Impact of atmospheric aerosols on solar power
Solar based power system are impacted by the atmospheric variability of the in-
coming solar irradiance. This variability is mainly driven by the absorption and
scattering of solar radiation by aerosol and cloud particles as well as trace gases
(e.g. Wendisch and Yang 2012, Wallace and Hobbs 2006). Even if clouds are a more
efficient modulator of solar radiation, this part of the thesis focuses on the impact of
aerosols on solar power for three reasons. First, especially in a desert environment like in the Sahel and the Sahara aerosols can become the decisive factor, limiting the availability of solar irradiance, during the dry season (Kothe et al. 2017). Sec- ond, frequent dust outbreaks might cause severe power reductions, which need to be regarded by planing a storage and grid system for the power sector (Rieger et al.
2017). Third, aerosols are often only included as climatology in global climate mod- els and satellite retrievals (e.g. Pu and Ginoux 2018, Mueller et al. 2015, Boucher et al. 2013) and therefore their temporal variability is neglected.
Depending on their physical and chemical composition aerosols reduce global hor- izontal irradiance (GHI) (e.g. Boucher 2015, Kaufman et al. 2002, Hess et al. 1998).
Direct normal irradiance (DNI) is strongly lowered while diffuse horizontal irradi- ance (DHI) is changed concerning its direction and increased to some maximum.
Different solar irradiance components are used by different solar power technologies.
While concentrating solar power (CSP) plants only exploit DNI, non-concentrating technologies, such as photovoltaic, use GHI.
The central question of this part of the thesis can be refined into:
1. What is the magnitude of the impact of aerosols on solar power?
2. How sensitive are photovoltaic and concentrating solar technologies to aerosol conditions?
3. Which challenges need to be considered during a desert dust outbreak?
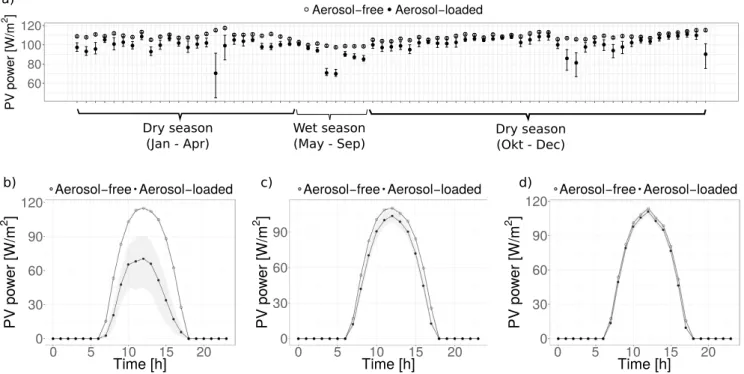
To answer these questions first a model framework (”Solar Power modeling in- cluding atmospheric Radiative Transfer” - SolPaRT) to separate the aerosol effect from other atmospheric quantities is developed. This model combines a radiative transfer model with solar power calculations and explicitly considers the impact of aerosols on solar irradiance. The impact of clouds is ruled out by considering clear sky situations only. For the quantification of the aerosol impact on solar power the aerosol-free and aerosol-loaded atmosphere are compared. The model is validated by using measurements in Sankt Augustin, Germany. Furthermore, a location (Niamey, Niger) with detailed observational data and high solar insolation is used to give an- swer to the first sub-question (see Section 4.1). The second and third sub-questions then are addressed by analyzing historical data at six well distributed locations in West Africa (see Section 4.2).
2. Variability of solar irradiance and its implications for pho- tovoltaic power
A detailed analysis of the variability as well as long-term trends of solar irradiance
is necessary to identify suitable sites for photovoltaic power plants. To determine
economically promising sites for photovoltaic power plants a regional analysis of the resource over total West Africa is needed.
Ground-based measurements have a limited availability. Satellite based data in- stead are available over larger regions and long time periods (Gueymard and Wilcox 2011). In particular, geostationary satellites can provide data having a temporal res- olution of one hour or less to analyze the intraday variability. The Meteosat satellites are geostationary and operated by the European Organisation for the Exploitation of Meteorological Satellites (EUMETSAT). The Satellite Application Facility on Cli- mate Monitoring (CM SAF) provides the Surface Solar Radiation Data Set-Heliosat, Edition 2 (SARAH-2.1) by using Meteosat satellite data. SARAH-2.1 is a 35-year long climate record for solar irradiance at ground with an half hourly resolution, covering the whole of Europe and Africa (Pfeifroth et al. 2019).
In this part, the central question is split into two sub-questions:
1. How variable is solar irradiance and therewith photovoltaic power potential between 1983 and 2017 in West Africa?
2. What are the trends of solar irradiance during these 35 years and how do they impact photovoltaic potential?
To answer these questions the global and direct horizontal irradiance of the SARAH-2.1 data record is analyzed for West Africa (3
◦N to 20
◦N; 20
◦W to 16
◦E, see Chapter 5). The objectives of the analysis are fourfold. First, the satellite data record is validated with ground-based measurements at three sites to determine their suitability. Second, the variability and trends of solar irradiances are estimated annually as well as for the dry and wet season separately with a spatial resolution of 0.05
◦x0.05
◦. Third, the temporal variability is analyzed by monthly anomalies along a meridional gradient which exhibits the strongest variations. Finally, a simple approach is derived which allows to derive photovoltaic yields for the full region of West Africa and subsequently addresses their variations.
Structure of the thesis
In the following, this thesis first provides background information on the West African climate, solar power, solar irradiance and atmospheric aerosols (Chapter 2).
Chapter 3 summarizes the used data sources and models as well as the newly devel- oped model chain SolPaRT. The impact of aerosols on solar power is presented in Chapter 4. Chapter 5 points out the potential of photovoltaic power in West Africa.
Finally, Chapter 6 gives an overall conclusion and outlook.
Background
This chapter gives an overview on the background of this thesis. First, West Africa with its current climatological conditions is described, including solar power, the climate and aerosols. Second, different solar energy technologies are characterized.
Third, solar irradiance and its interaction within the atmosphere is presented by giv- ing a short introduction to the radiative transfer theory. Finally, aerosol properties and their interconnection to land use conditions are summarized, as the atmospheric composition of aerosols depend among other factors on local land use properties.
2.1 West Africa
West Africa is located at the westernmost edge of Africa, including Benin, Burk- ina Faso, Cape Verde, The Gambia, Ghana, Guinea, Guinea-Bissau, Ivory Coast, Liberia, Mali, Niger, Nigeria, Senegal, Sierra Leone and Togo, also known as the Economic Community of West African States (ECOWAS). In the west and south the region is limited by the Atlantic Ocean. The northern boundary is the central Sahara and in the east an imaginary north-south boundary at 10
◦E delimits the region. West Africa is the habitat of around 350 million people and covers more than 5 million square kilometers of land. Vegetation in West Africa is diverse and can be classified into five east-west vegetation belts, the Saharan, Sahel, Sudanian, Guinean and Guinean-Congolian regions (from north to south, see Figure 2.1). The
Figure 2.1: Landscapes of West Africa (CLISS 2016).
Saharan region is dominated by arid and sandy landscapes. The Sahel is a home for grass and bush lands as well as for the Sahel-acacia-Savanna. In the Sudanian region vegetation ranges from open tree savannas to wooded savannas and open woodlands. The landscape in the Guinean region manly consists of forests, with a tree height of around 18 to 20 m. The wettest region is the Guinean-Congolian, with dense forests and trees reaching up to 60 m height and the highest population density. (CLISS 2016)
2.1.1 Solar energy
Currently solar power plays hardly any role in West Africa with far less than 1%
of final energy consumption and 454.5 MW installed capacity (in 2018) (IRENA 2018b). Thereby up to today only photovoltaic (PV) power is used, there are no CSP plants running or planed for West Africa. The usage of PV power in West Africa is twofold. On the one hand, small solar home systems and mini-grids connect rural areas to electricity (especially in Sierra Leone, Senegal, Mali, Niger, Nigeria, Benin and Togo). On the other hand, a few larger PV power stations exist in Burkina Faso, Ghana, Niger, Senegal and Cabo Verde (ECOWAS 2019). The largest grid connected PV power plant is Zagouli in Burkina Faso with 33.7 MW (Sterl et al.
2020b).
The future energy plan for the West African region is projected from different organizations, including all renewable sources, with hydro power having the largest share. The ECOWAS projects around 7.6 GW installed capacity of renewable en- ergies (48% of total installed capacity) by 2030 (ECREE 2017). The West African Power Pool (WAPP) Master Plan, and the ECOWAS Renewable Energy Policy (EREP) propose to increase the share of renewable energy production to 23% by 2020 and 31% by 2030. The International Renewable Energy Agency (IRENA) estimates that more than 25% of West Africa’s power will come from renewable sources in 2030 (with an installed capacity of 65% of renewable energies) (IRENA 2018b). Furthermore, IRENA estimates an overall PV power potential of more than 100.000 TWh / year and an overall CSP potential of around 22.000 TWh / year (Her- mann et al. 2014). With around 7 GW of currently planned PV power plants over the region, solar energy use is already accelerating (Sterl et al. 2020b).
Many West African countries have their own policy targets for renewable ener- gies. Cabo Verde has the highest target, with 50% grid connected renewable energies in 2020. In other West African countries the targets of renewable energies range from 10% (in Ghana and Niger) to 35% (in The Gambia) for 2020. (ECOWAS 2014)
2.1.2 Regional climate and aerosols
The West African climate is highly variable due to its location between the humid
equatorial region and the dry subtropical desert regions. The northern region in the
Sahara is mainly influenced by the high pressure belt due to the so-called Hadley cir- culation causing the dry trade winds (also called Harmattan). Thus, in the northern regions arid, desert conditions prevail. The southern coast is humid all-year round and there is a transition zone to the north which has distinct dry and wet seasons, influenced by the WAM. These sharp contrasts between the two regions are caused by the global circulation system. The Hadley circulation characterizes an upward motion of the air in the equatorial region and identifies the Intertropical convergence zone (ITCZ) (Kraus 2004). In contrast, the northern desert region is influenced by the subsiding air branch of the Hadley cell.
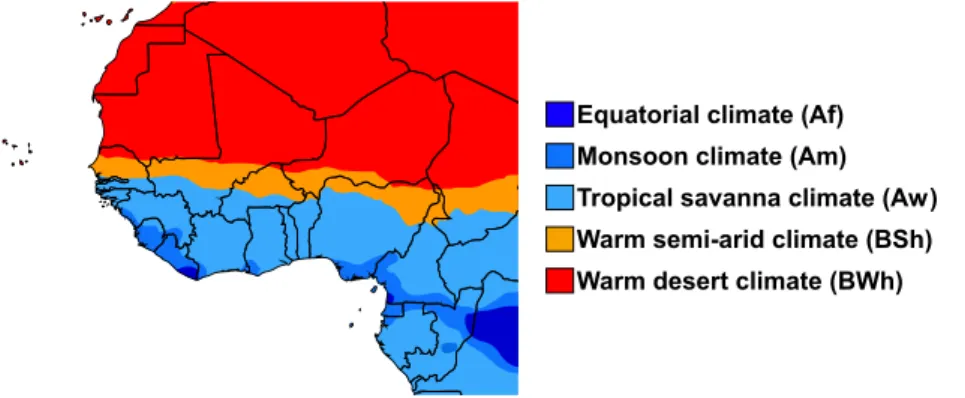
According to the Köppen-Geiger climate classification (Peel et al. 2007), climatic conditions range from tropical climates (equatorial, monsoon and tropical savanna climate) near the coast in the south over a narrow belt of warm semi-arid climate in the central latitude of West Africa to a warm desert climate in the Sahara (see Figure 2.2). Tropical climates show average temperatures of 18
◦C or higher for the coldest month and typical precipitation pattern. A warm semi-arid climate represents a savanna climate and a warm desert climate an arid desert climate, both are defined due to their low precipitation, whereby the desert climate shows lower precipitation than the semi-arid climate. (Peel et al. 2007)
Figure 2.2: Map of West Africa with Köppen-Geiger climate classification (derived from Peel et al. (2007)).
The averaged annual sum of GHI between 1994 and 2016 varied in West Africa between about 1600 kWh / m
2and 2400 kWh / m
2(see Figure 2.3, (Solargis 2019)).
Compared to other regions in the world incoming solar irradiance is high in West Africa, especially in the Saharan region. Between 1983 and 2015 the Sahara was one of the most sunny regions on Earth (see Figure 2.4 from the CM SAF). Sunshine hours go up to 4000 hours/year. For the whole West African region, sunshine hours vary between around 2400 hours/year (6.6 hours/day) near the Guinean coast to up to 4000 hours/year (more than 10 hours/day) in the desert region (Kothe et al.
2017).
In West Africa, radiative transfer is mainly conditioned by the WAM circulation
in the southern parts, causing the formation of clouds and their variability. The
relevance of dust from the Sahara and biomass burning on solar irradiance increases
15°W 0° 15°E
Mauritania
Mali Senegal
Gambia Guinea-Bissau
Guinea Sierra Leone
Liberia Ivory Coast
Ghana Togo Burkina Faso
Benin Nigeria Niger
Figure 2.3: Averaged sum of global horizontal irradiance (modeled by Solargis) in West Africa (adapted from Solargis (2019)).
Figure 2.4: Mean annual sum of average sunshine hours in West Africa between 1983 and 2015 (derived from Kothe et al. (2017), who used the SARAH-2.1 data
record).
towards the north (Miller et al. 2012). In the Sahel zone precipitation is connected to the dry and wet season (Lélé and Lamb 2010, Yoshioka et al. 2007). During the dry season (October-April) hardly any rainfall is observed in this region, while during the wet season precipitation fluxes reach up to 5 mm / day (Miller et al. 2012).
Over the total region the mean annual rainfall ranges from less than 100 mm to over 1.800 mm (see Figure 2.5) (Niang et al. 2014). Months with more than 50 mm rainfall range from 0 in the Sahara to 10 at the Guinean coast. The effective cloud albedo between 1983 and 2017 (see Figure 1 c in Chapter 5) is low in the north of West Africa and increases towards the south. Near to the coast it reaches up to 0.3.
The aerosol composition in West Africa consists of a complex mixture of com- bustion aerosols and dust particles from the Sahara (Marticorena et al. 2011, Li- ousse et al. 2010, Haywood et al. 2008). Major emitters for combustion aerosols are biomass burning (mainly in the savanna during the dry season), fossil fuels (from traffic and industry, mainly in urban areas, year around) and fires for domestic use (cooking with fuelwood and charcoal, distributed over rural areas, year around).
Mineral dust is ubiquitous in West Africa, it is present all year around especially in
Figure 2.5: Mean annual rainfall in West Africa (Derived from data from the IPCC 5th Assessment Report (Niang et al. 2014) for West Africa).
the northern part. However, there exist a typical dust cycle over the course of the year. Dust concentrations peak during the dry season, with frequent dust emissions (Cowie et al. 2014). Also in the beginning of the wet season high dust concentrations of more than 4000 µg / m
3are present (Marticorena et al. 2011). Especially in the dry season, the Harmattan winds transport the dusty air from the Sahara towards the south, while the air loaded by biomass burning aerosols mainly remains south.
Especially near the ITCZ the dusty air is mixed with air loaded by biomass burn- ing aerosols. Some secondary organic aerosols formed from vegetation (Capes et al.
2009), nitrates from soil (Delon et al. 2010) and maritime aerosols (Marticorena
et al. 2011) (especially near the coast) can be found as well. Satellite retrievals,
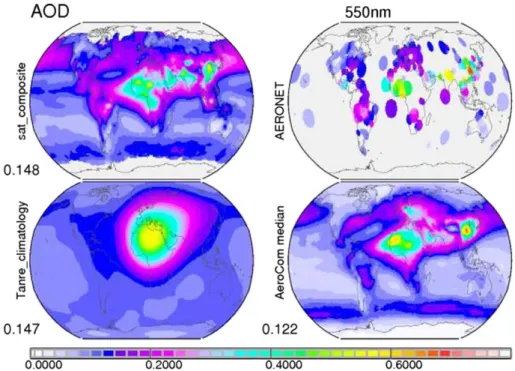
remote sensing and ground measurements show annual mean aerosol optical depth
(AOD) of up to 0.6 in the Sahara (see Figure 2.6, (Kinne et al. 2013)). In the global
view, West Africa is one of the regions with highest annual AOD. In many regions
of the world, the AOD lies under 0.2 (see Figure 2.6). When looking at ground mea-
surements, AOD can go beyond 4 in the West African region and is highly variable
in time (Slingo et al. 2006).
Figure 2.6: Global distribution of AOD at 550nm from four different data sources.
A a combination of different satellite retrievals, including MODIS, MISR, and AVHRR (top left), the Tanre climatology (Tanre et al. 1984) (bottom left), AErosol RObotic NETwork ground data (top right), and a global model median
(bottom right, the used 14 models are given at AeroCom (2020) for phase I).
Values below the labels indicate global averages. (Kinne et al. 2013)
2.2 Solar power
There exist several technologies to generate solar power. Due to the physical power generating process two main groups can be distinguished from each other - PV and thermal. PV power systems directly transform solar irradiance to electrical power using the photoelectric effect. Solar thermal power systems instead utilize the heat from the sun to run an electric generator with a steam or gas turbine.
Solar thermal power plants include CSP like parabolic trough (PT) power plants and solar tower power plants. This sections describes PV and PT power, the latter representing a concentrating technology, with their advantages and disadvantages, as these technologies are used for the analysis in this thesis.
2.2.1 Photovoltaic systems
Photovoltaic cells (from Greek "photos" - light and "volt" - the unit of electric volt-
age) can directly convert solar irradiance into electrical power. The first PV cell was
built in 1954 in the American Bell-Laboratories with an efficiency of 5% (Quaschn-
ing 2011). Nowadays, crystalline PV cells reach efficiencies far over 20% in the
laboratories (RECP 2019). Costs are still falling from year to year and annual new
installations increase. In 2018, the worldwide PV power generation was 585 TWh,
which covers over 2% of global electricity need (IEA 2019), with an installed total capacity of over 500 GW (RECP 2019) (with only 0.1% being installed in West Africa). PV systems have one important advantage. They are based on a modular technology which allows to build up large power plants as well as small systems for single households or even off-grid applications. A grid-connected PV installation consists of PV modules (arranged in parallel or in row and build up from several PV cells) and an inverter to convert the direct current (DC) to alternating current (AC).
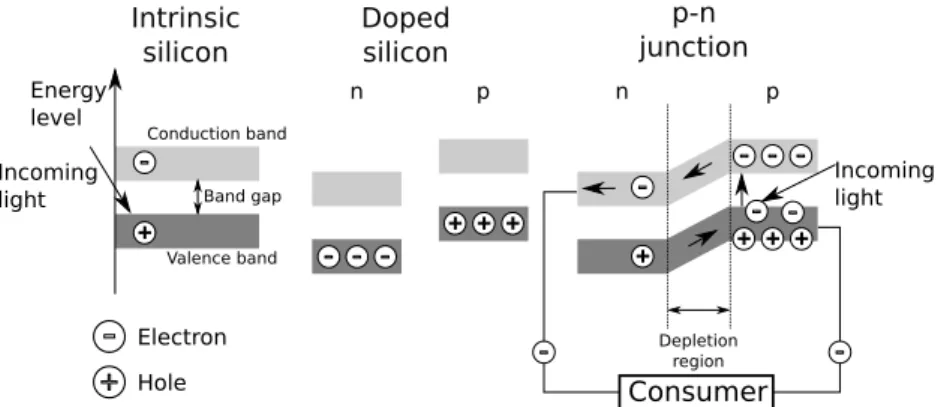
The photovoltaic effect is the physical basis of PV systems and creates voltage and electric current while the cell is exposed to light. Photovoltaic cells are made of semiconductors. The mainly used semiconductor for PV cells is silicon (the global market share was 90% in 2014 (Armaroli and Balzani 2016)). Silicon has four valence electrons. These electrons can be elevated to the conduction band under the exposure to light. The remaining empty space in the valence band is called hole. To generate electricity several layers of doped semiconductor material need to be arranged. For the doping of silicon, one atom is replaced by an atom from the III (p-doping, often with Bor) or the V main group of the periodic table (n- doping, often with Phosphor). Due to the additional (n-doping) or missing electron (p-doping) in the material local positive or negative charge preponderance occurs.
By connecting the two differently doped layers to a p-n-junction a depletion region is built up in the middle. In this region charge carriers are separated due to the different local charge preponderance. Electrons drift towards the n-layer and holes towards the p-layer. This evokes a current subtended to the forward direction of the p-n junction which can be diverted by the connection of a consumer (see Figure 2.7).
(Quaschning 2011)
Intrinsic silicon
Doped silicon
p-n junction
Energy level
Conduction band
Valence band
-
+
Electron Hole
-
+
Band gap
n p
- - -
+ + +
Depletion region
n p
Incoming light
+ + + +
- - - -
- -
- -
Incoming light
Consumer
Figure 2.7: Electric bands for intrinsic and doped silicon as well as for the p-n-junction.
Beside the p-n-junction, the PV cell has additional layers. To divert the cur- rent a front and a back layer, including the electrical contact need to be installed.
Furthermore, an antireflection layer is applied on the front of the PV cell to reduce
optical losses of incoming solar irradiance.
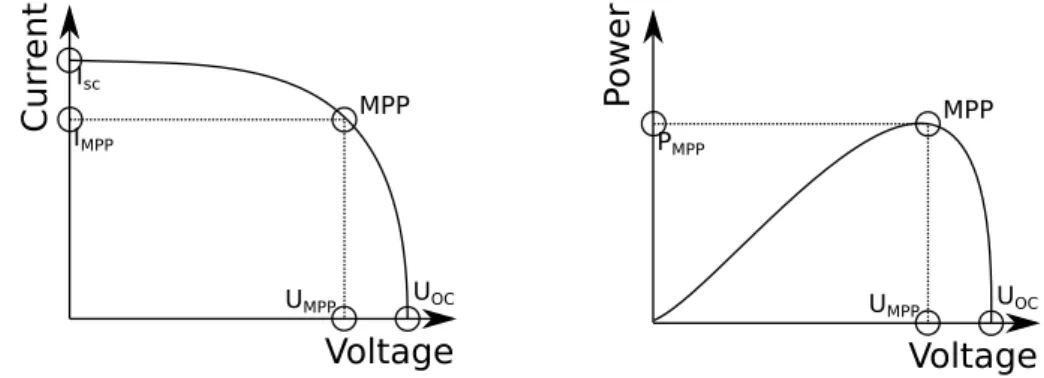
Modeling PV power implies to accurately simulate the current (I) - voltage (U) curve during each modeling step. Therefore at least three points are necessary to accurately represent the I-U curve, the maximum power point (MPP), the open- circuit voltage ( U
OC) and the short-circuit current ( I
SC) (see Figure 2.8).
Voltage
Cur rent
MPP
UMPP UOC IMPP
Isc
Voltage
Power
MPPUMPP UOC PMPP
Figure 2.8: Typical curse of the I-U and Power-U curve of a PV cell, with MPP, U
OCand I
SC.
The optically generated charge carriers are exposed to the recombination and diffusion processes. For the ideal PV cell these processes can each be represented by a diode. However, losses must be taken into account for real PV cells. The two diode model represents the optimal characterization of a crystalline PV cell (for detailed description see Section 3.3.2). Thereby losses can be summed up in one series- and one parallel resistance term. The series resistance represents the losses of the semiconductor material and contacts and the parallel resistance the defects in the p-n-junction and the leakage currents over the surface (Fischbach 1982).
2.2.2 Parabolic trough power plant
The utilization of CSP dates back to the seventh century B.C.. In these times, it was used to light fire using glass or mirrors to concentrate the direct radiation. Nowa- days, CSP is developed as a modern technology to produce power, e.g. as PT power plants. The technology is attractive due to its combination with traditional thermal gas or steam turbines coupled to a generator and used in the fossil fuel based energy system. Therefore, a combination with fossil fuels is possible. Parabolic trough power plants (PTPP) are one of the most established CSP technologies. For PTPP heat levels of around 250
◦C to 400
◦C are needed. To achieve such temperatures the concentration of the solar irradiance is necessary. The concentration of solar irradiacne is only possible for the direct component of irradiance, which makes CSP attractive for regions with a low share of clouds and aerosols. To analyze the impact of aerosols on solar power a PTPP is used as an exemplary CSP plant in this thesis.
(Quaschning 2011)
The PT technology consists of single line concentrators in the shape of a parable.
Parallel rays are collected by reflection on the reflector and focused to one receiver
tube (see Figure 2.9). The reflectors are usually built of glass mirrors because of their long life time. The receiver tube is filled with a working fluid (e.g. thermal oil), able to capture high temperatures. The parabolic trough tracks the sun with a single-axis in East-West direction to capture the solar irradiance perpendicular to the aperture. The heated working fluid evaporates and overheats water, which
Figure 2.9: Parabolic trough collector (Cabrera et al. 2013: Fig. 2).
then drives a steam turbine with a generator producing electrical power. A PTPP is generally constructed by several parabolic collectors in series, named assembly, and multiple assemblies are connected in parallel. The Andasol I (see Figure 2.10) power plant in Spain is used for theoretical calculations in this thesis. For this power plant 12 typical collectors (the line-focusing Eurotrough, (Luepfert et al. 2003)) are used in one assembly and 624 assemblies are connected in parallel. The heat collector elements are PTR70 by Schott (SCHOTT Solar 2013) and for the power block, a Steam Rankine process is used. The SST-700 turbine was developed by Siemens.
The solar field efficiency of Andasol I lies around 50% and the efficiency of the entire plant, including the steam turbine process, at around 15% (Solar Millenium 2008).
Figure 2.10: Diagram of the Andasol I power plant without storage (A: possible
secondary combustion, B: Steam turbine with generator, C: Cooling tower).
2.3 Solar irradiance
Solar (or shortwave) radiation is emitted by the sun’s photosphere and incident on the top of the Earth’s atmosphere. The sun emits mainly in the wavelength λ range between 100 and 4000 nm (Petty 2006: p.68). Thereby the shape of the extraterrestrial spectrum follows a Planck curve of the sun’s surface temperature of approximately 5777 K (Petty 2006), with a maximum at about 500 nm (see Figure 2.11). The mean irradiance arriving at the top of the atmosphere is specified
Figure 2.11: The extraterrestrial solar spectrum with a corresponding Planck curve at 5777 K (temperature of the sun) and the AM1.5 spectrum (American Society
for Testing and Materials 2003).
as the total solar irradiance, having a value of 1361.1 W / m
2(Gueymard 2018). The solar constant is influenced by the Earth elliptical orbit around the sun and the sun’s 11-year solar cycle. Due to the elliptical orbit of the Earth around the sun, the top of the atmosphere solar radiation varies from 1330 W / m
2in summer to 1420 W / m
2in winter (Petty 2006: p. 50). The 11-year solar cycle has an amplitude of about 0.12%, so it plays only a secondary role (Kopp and Lean 2011). On its way to the Earth’s surface, solar irradiance interacts with the Earth’s atmosphere.
Solar irradiance at the Earth surface (global horizontal irradiance - GHI) consists of two components: direct horizontal (DIR) and diffuse horizontal irradiance (DHI).
GHI can be calculated as: GHI = DIR + DHI. The direct component is the part of the extraterrestrial light which passes the atmosphere without interaction with particles and molecules, it comes from the direction of the sun. The diffuse component arrives at the ground from several directions after being scattered by trace gases, aerosols or clouds (see Figure 2.12). They absorb, reflect and scatter the incoming light and therewith affect the intensity as well as the spectral composition of the irradiance. About 30% of the incoming solar irradiance is reflected by the Earth’s atmosphere while about 20% is absorbed there (Stocker et al. 2014).
A very simple consideration of the atmosphere can be undertaken by using the
air mass (AM) factor. This factor defines the direct optical path length through the
atmosphere compared to the vertical path length. In the solar energy community the
Figure 2.12: Way of the irradiance through the atmosphere to the plane of a PV module.
AM1.5 spectrum, which is defined at 25
◦C (see Figure 2.11), is used as a standard spectrum for terrestrial power generation (cloud free atmosphere with a rural aerosol loading). In this thesis, however, detailed radiative transfer calculations will be used to determine irradiance on the Earth surface. Therefore the propagation of solar radiation, through the atmosphere will be discussed in more detail in the following.
2.3.1 Absorption and scattering
In the atmosphere solar radiation is scattered and absorbed by gases, aerosol and cloud particles. The reduction of solar radiation by scattering and absorption in the atmosphere is called extinction. The fraction of radiation passing the atmosphere to the Earth surface is called transmittance.
Depending on the size extent and composition, molecules and particles absorb the solar radiation at typical wavelengths and transform the radiance into thermal or electronic energy. Thereby they induce rotational, vibrational and electronic transi- tions. Transmittance lines and bands for the major atmospheric gases are shown in Figure 2.13 in a wavelength range between 200 nm and 70 µm. By comparing the absorption bands of the single trace gases with the spectral range of the incoming solar radiation, one can clearly see that absorption and scattering by water vapor has the major influence on the solar spectrum (under 4000 µm). The effect of ab- sorption and scattering by nitrous oxide (N
2O), oxygen (O
2), ozone (O
3), carbon dioxide (CO
2) and methane (CH
4) has only a slight influence on the incoming solar spectrum.
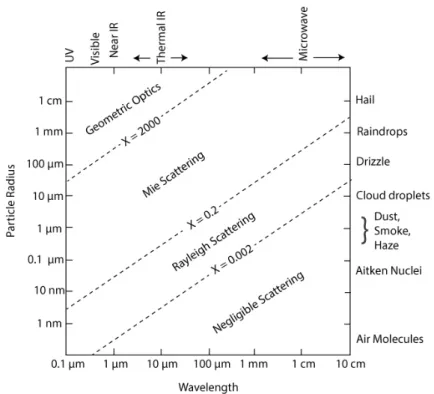
Scattering processes change the direction of the incoming radiation. Depending on the size of the particles and the wavelength, various scattering behaviors are differentiated (see Figure 2.14). The size parameter x is defined as
x = 2 πr
λ , (2.3.1)
with r being the radius for a spherical particle. For larger particles and smaller
Figure 2.13: Spectral absorption bands of major atmospheric trace gases (Worldpress 2012).
Figure 2.14: Relationship between particle size, wavelength and scattering behavior for atmospheric particles. The dashed lines represent rough boundaries
between the different scattering regimes (Petty 2006: p. 346).
wavelengths ( x ≥ 2000) the scattering process follows geometric optics. For the
incoming solar radiation (in a wavelength range between 100 to 4000 nm) particles
with radii larger than about 100 nm follow Mie scattering (0 . 2 ≤ x ≤ 2000). Smaller
particles are either Mie or Rayleigh scattered depending on the certain wavelength.
For the mathematical description of the extinction of radiation on particles some basic parameters and equations are introduced here. The effective surface which interacts with the radiation perpendicular to its direction of propagation is called the absorption σ
absand accordingly the scattering cross section σ
scais defined, both in [m
2]. Therewith the absorption Q
absand scattering efficiency Q
scacan be defined as
Q
abs= σ
absπ r
2and Q
sca= σ
scaπ r
2(2.3.2)
Generally it is assumed that clouds and aerosols are spherical particles. The ex- tinction efficiency Q
extis then defined as the sum of the absorption and scattering efficiency to Q
ext= Q
abs+ Q
sca.
The absorption β
absand scattering coefficient β
sca, both in [m
−1], characterize the absorption and scattering process depending on the wavelength and the particle nature. They are defined as the cross section times the particle number concentration N
C[m
−3]
β
abs= σ
abs· N
Cand β
sca= σ
sca· N
C. (2.3.3) The extinction coefficient β
extis again defined as the sum of the absorption and scattering coefficient to β
ext= β
abs+ β
sca. The single scattering albedo (SSA) specifies the share of scattering of the whole extinction
SSA = Q
scaQ
ext= β
scaβ
ext= σ
scaσ
ext. (2.3.4)
If SSA = 0 the particle is solely absorbing and if SSA = 1 the particle is solely scattering.
Besides the scattering efficiency it is important to analyze the direction of the scattered light after interacting with a particle. The dimensionless phase function p (Ω , Ω
0) describes the scattering of light from the spatial direction Ω
0into the spatial direction Ω. A widely used approximation of the phase function for scattering processes on aerosols (where the size parameter lies in the Mie regime) is the Henyey- Greenstein phase function depending on the cosine of the scattering angle ν
p ( cos ν ) = 1 − g
2(1 + g
2− 2 g cos ν )
2/3. (2.3.5) This equation includes the dimensionless asymmetry parameter g being defined as the cosine-weighted average of the probability of irradiance being scattered in a given direction
g = 1 2
Z 1
−1
cos ν · p ( cos ν ) d cos ν. (2.3.6)
Thereby it can reach values between − 1 ≤ g ≤ 1. A value of − 1 defines only backward, a value of 1 only forward and a value of 0 isotropic scattering. (Petty 2006, Wendisch and Yang 2012)
2.3.2 Radiative transfer theory and numerical solution methods
The theory of radiative transfer describes the propagation of irradiance in a medium based on the particle description of light. The radiative transfer equation (RTE) is the mathematical description of the interaction between electromagnetic radiation and particulates (including molecules, aerosol and cloud particles). It includes all absorption, emission and scattering processes in a spectral dependency. The mono- spectral radiance
1I
λ(Ω) in the spatial direction Ω derived along its path ~ s depends on all sinks (first term, including absorption and scattering) and all sources (second and third term, including thermal emission and scattering)
dI
λ(Ω)
d~ s = − ( β
λ,abs+ β
λ,sca) · I
λ(Ω)
| {z }
Sinks
+ (2.3.7)
β
λ,abs· B
λ( T ) + β
λ,sca4 π
Z
4π
p
λ(Ω , Ω
0) · I
λ(Ω
0) d Ω
0| {z }
Sources
.
Thereby B
λ( T ) is the temperature dependent Planck function.
Analytical mathematical solutions can only be found for a few very simplified cases in a plane-parallel atmosphere (Petty 2006). In general, numerical solutions are necessary. Radiative transfer (RT) models, using information on the atmospheric state as input, can be used to calculate the radiative flux profiles in the atmosphere.
For a detailed description of the radiative transfer theory see for example Wendisch and Yang (2012) or Petty (2006).
The majority of algorithms to solve the RTE can be classified into two cate- gories, Discrete-Ordinate and Monte-Carlo methods. Here, the DIScrete Ordinate Radiative Transfer (DISORT) algorithm by Stamnes et al. (1988) is described be- cause it is applied in this thesis. DISORT mathematically describes the transfer of monochromatic unpolarized radiances in a plane parallel atmosphere where scatter- ing, absorption and emission takes place. Furthermore bidirectional reflection and emission at the lower boundary is considered. DISORT can calculate radiances, irradiances and actinic fluxes for the direct beam and the diffuse incidence with a pre-described atmospheric state from the ultra violet to the microwave region of the electromagnetic spectrum. The DISORT solver approximates the irradiance into a Fourier cosine series to separate the azimuth dependence. To find an analytical solution the atmosphere is split into a finite number of plane parallel layers. For
1The radiance is defined as the irradiance per unit of solid angle.
each layer the phase function and the SSA are assumed to be constant, but can vary from layer to layer. Then, the optimal solution can be approximated by Gaus- sian quadrature, with at least n notes for polynomial functions of the order 2 n − 1.
(Stamnes et al. 2000, 1988)
2.4 Atmospheric aerosols
Atmospheric aerosols (from latin "aer" - air and "solutio" - solution) are solid or liquid suspended particles (excluding hydrometers) in the air. Aerosols are always present in the atmosphere and interact with clouds and radiation. Aerosol-radiation interaction occurs due to scattering and absorption of the incoming solar radiation.
This is called the direct aerosol effect. Furthermore, aerosols have an impact on cloud formation, the size of cloud droplets and the lifetime of clouds. This is called the indirect aerosol effect. Due to these interactions aerosols have impacts on the energy budget and the climate of the Earth (Boucher et al. 2013). The human eye is not able to identify single aerosols, but if the concentration gets high enough people can realize the effect of aerosols by a reduced visibility (for example during desert dust storms, smog in large cities or the smoke from fossil fuel combustion).
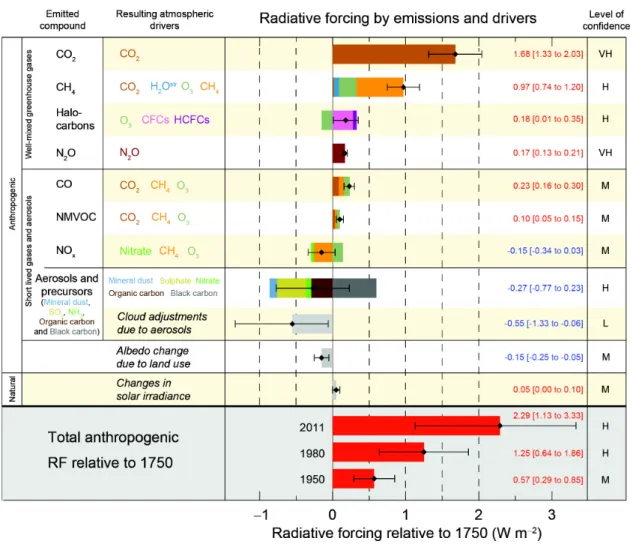
Aerosols vary in size and chemical composition. In Figure 2.15 radiative forcing (being the change of the difference between energy radiating down to earth and being radiated back to space caused by a certain driver) by different greenhouse gas emissions and aerosols is shown. The impact of aerosols on radiative forcing has still high uncertainties and ranges from negligible to significant (up to -0.77 W / m
2).
Depending on the type of the aerosol this impact can result in a radiative warming or cooling (Srivastava et al. 2014, IPCC 2013). Under clear sky conditions aerosols show the highest influence on the irradiance budget at the surface (Hoyer-Klick et al.
2015).
Aerosol concentrations are extremely variable in space and time, because of their various sources and relatively short residence time of hours to weeks in the atmo- sphere. The size of single aerosols can vary between some nanometers to some micrometers (Wallace and Hobbs 2006: p. 169 - 173).
2.4.1 Aerosol formation and classification
Aerosols are either directly emitted into the atmosphere or formed by condensation or nucleation (secondary aerosols). There are two major classifications by source.
Anthropogenic aerosols include remaining particles from the combustion of fossil and biofuels, fires by humans, industrial and agricultural activities against what natural aerosols are mainly emissions from soil, vegetation, ocean, wild fires and volcanoes (Boucher 2015, Boucher et al. 2013).
By physical properties aerosols can be classified into three major groups,
Figure 2.15: Radiative forcing by greenhouse gases and aerosols relative to 1750 (IPCC 2013: p.12).
nucleation-, accumulation- and coarse mode. Each of these groups represents a maximum in the size, surface and accordingly volume distribution. Furthermore a classification depending on chemical properties (chemical species and mixture) can be undertaken. The composition of aerosols can be in an internal or exter- nal mixture. External mixtures are composed of aerosols with different chemical composition, while realistic internal mixtures consists of different chemical species within single particles. Different chemical species of aerosols are organic, inorganic and black carbon aerosols. Their physical and chemical properties are needed for radiative transfer calculations (Boucher 2015).
2.4.2 Aerosol optical properties
The most important aerosol optical properties is the AOD. Furthermore the above
described SSA and the asymmetry factor g give information on the scattering-
absorption rate and the direction of scattering, respectively. These parameters are
needed to analyze the direct radiative forcing of aerosols (Boucher 2015, Fiebig and Ogren 2006, Wallace and Hobbs 2006).
For most applications aerosol optical properties can be described by the Mie theory with the assumption of spherical particles (Horvath et al. 2016). To define the AOD the extinction efficiency Q
exthas to be integrated over the whole size distribution n ( r ), so that one can specify the extinction coefficient β
extto
β
ext=
Z ∞0
π r
2Q
ext( r ) n ( r ) dr, (2.4.1) where r is the radius of the aerosol particle. The AOD integrated over the vertical dimension of the atmosphere is defined as
AOD =
Z z(TOA)0
β
ext( z ) dz. (2.4.2)
Whereby z is the vertical height and z (TOA) is the height of the top of the atmo- sphere.
This AOD still depends on wavelength. Generally the AOD decreases with in- creasing wavelength λ (Sakerin and Kabanov 2006). In the shortwave range the wavelength dependency of AOD can be described with the Ångström exponent α
α = − ln (AOD
1) − ln (AOD
2)
ln ( λ
1) − ln ( λ
2) (2.4.3) and the following relation
AOD = AOD
0· λ λ
0!−α