Role of Insulin/IGF-1-regulated FoxO
transcription factors in epidermal morphogenesis
Inaugural-Dissertation
zur
Erlangung des Doktorgrades
der Mathematisch-Naturwissenschaftlichen Fakultät der Universität zu Köln
vorgelegt von Christian Günschmann
aus Ilmenau
Köln 2014
Berichterstatter: Prof. Dr. med. Jens C. Brüning Prof. Dr. rer. nat. Carien M. Niessen
Tag der mündlichen Prüfung: 11.04.2014
Abstract
The mammalian epidermis is a self-renewing protective epithelial barrier against external challenges and dehydration, which is formed during embryogenesis through a stratification program. The external signals that initiate and regulate this program are presently unknown. Previous findings in the laboratory identified epidermal insulin/IGF-1 signaling (IIS) as key regulators of epidermal morphogenesis. Mice with an epidermal deletion of either the insulin receptor, the IGF-1 receptor or both showed a increasing reduction in the formation of suprabasal layers, impaired proliferative potential with a temporary arrest in mitosis. The goal of this thesis was to identify how epidermal IIS controls self-renewal and stratification during embryogenesis and address the role of the IIS controlled Forkhead box-O (FoxO) transcription factors, in these processes. The results show that IIS signaling is activated in mitosis and sufficient to drive mitotic progression. Initiation of stratification is accompanied by a shift from symmetric (SCD) to asymmetric division (ACD). This shift is impaired upon loss of IIS as a result of a biased loss of ACDs.
We further identified the transcription factor p63 as a downstream signaling target of
IIS. P63 is a master regulator of epidermal specification, controls the shift towards
ACDs and promotes proliferative potential. Upon loss of IIS, FoxO transcription
factors were retained in the nucleus where they bind and inhibited p63-regulated
transcription, which was independent of direct FoxO DNA binding. Small interfering-
RNA mediated knockdown of FoxOs reversed IIS loss induced alterations in p63
target gene expression. Accordingly, transgenic expression of a constitutive nuclear
FoxO variant in mice epidermis abrogates ACD, inhibits p63-regulated transcription
and stratification, mimicking loss of p63. In summary, this study revealed a critical
role for IIS-dependent control of p63 activity in coordination of ACD and stratification
during epithelial morphogenesis.
Zusammenfassung
Die Epidermis von Säugetieren bildet eine sich selbst erneuernde Schutzbarriere
gegen äußere Einflüsse und Dehydrierung, die während der Embryonalentwicklung
durch Stratifizierung entsteht. Die äußeren Signale, die dieses Programm initiieren
und regulieren sind momentan noch nicht bekannt. Vorrangegangene
Laborergebnisse haben gezeigt dass Insulin/IGF-1 wichtige Regulatoren der
epidermalen Morphogenese sind. Mäuse denen der Insulinrezeptor (IR), der IGF-1
Rezeptor (IGF-1R) oder beide Rezeptoren gleichzeitig in der Epidermis fehlten,
entwickelten weniger suprabasale Schichten und hatten ein verringertes
proliferatives Potential mit vorrübergehendem Mitosearrest. Ziel dieser Arbeit war es
nun zu verstehen, wie epidermales IIS Selbsterneuerung und Stratifizierung während
der Embryogenese kontrolliert und zu fragen welche Rolle Forkhead box-O (FoxO)
Transkriptionsfaktoren dabei spielen. Unsere Ergebnisse zeigten dass IIS während
der Mitose aktiv ist und die Mitose fortführen konnte. Während der Initiierung der
Stratifizierung findet ein Umschalten von symmetrischen (SCD) zu asymmetrischen
Zellteilungen (ACD) statt. Diese Verschiebung wurde durch den Verlust von IIS
gestört und resultierte in weniger ACDs. Des weiteren identifizierten wir den
Transkriptionsfaktor p63 als nachgelagertes Regulationsziel von IIS. P63, der
Hauptregulierer der epidermalen Spezifizierung, kontrolliert diese Umverteilung zu
ACDs und das proliferative Potential der Zellen. Durch den Verlust von IIS wird FoxO
im Nukleus zurückgehalten, bindet und hemmt dort die p63 regulierte Transkription
unabhängig von einer direkten FoxO-DNA Interaktion. SiRNA vermittelter knockdown
von FoxO konnte den Verlust von IIS auf die p63 Zielgenexpression umkehren. Wie
erwartet, führte die transgene Expression einer konstitutiv nukleären FoxO Variante
in der Mausepidermis zum Verlust von ACDs, inhibierte die p63-regulierte
Transkription und Stratifizierung, ähnlich dem Verlust von p63. Diese Studie konnte
eine wichtige Funktion für die IIS-abhängige Kontrolle von p63 bei der Koordination
von ACDs und Stratifizierung aufzeigen.
Table of contents
1. Introduction ... 1
1.1. The mammalian epidermis ... 1
1.2. Epidermal morphogenesis ... 4
1.2.1. Asymmetric cell division in the epidermis ... 7
1.2.2. The transcription factor p63: structure, expression and function ... 10
1.3. Insulin/IGF-1 signaling ... 15
1.3.1. FoxO transcription factors ... 18
1.3.2. Regulation of FoxO transcriptional activity ... 21
1.3.3. FoxO function in stem cells ... 24
1.3.4. FoxO function in the epidermis ... 25
1.3.5. IID/FoxO in skin pathogenesis ... 26
1.3.6. IIS Regulates epidermal thickness and proliferative potential ... 28
1.4. Aims of this thesis ... 34
2. Results ... 35
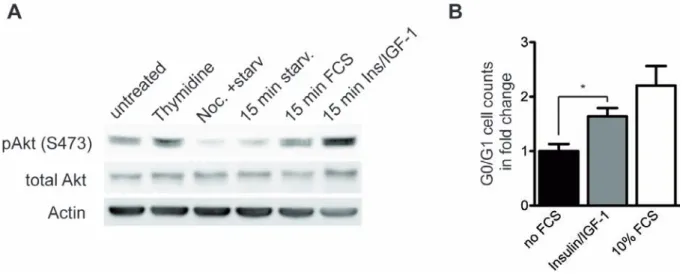
2.1. Epidermal IIS controls mitotic progression ... 35
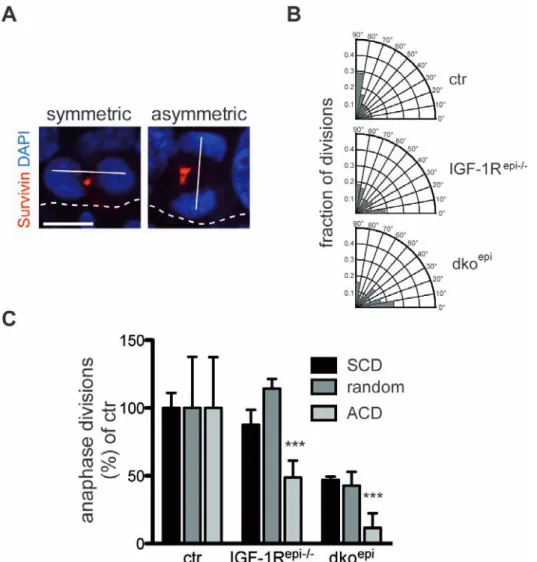
2.2. Epidermal IIS promotes ACD ... 36
2.3. IIS regulates p63 activity in keratinocytes in vitro ... 39
2.4. IIS and p63 share an overlapping gene expression set ... 41
2.5. Epidermal IIS regulates p63 target gene expression ... 43
2.6. Binding of p63 to target promoters is not altered ... 46
2.7. IIS regulated FoxO transcription factors are expressed during epidermal development and in primary keratinocytes ... 47
2.8. IIS regulates nuclear translocation of FoxOs ... 49
2.9. Nuclear FoxO1-ADA impairs p63 activity ... 51
2.10. FoxO regulation of p63 activity is independent of FoxO-DNA interaction ... 52
2.11. FoxO interacts with p63 ... 54
2.12. IIS regulates recruitment of FoxO to p63-DNA consensus binding sites ... 56
2.13. FoxO binding to p63 is important for target gene regulation ... 57
2.14. Overexpression of FoxO1-DN does not rescue IGF-1R
epi-/-phenotype ... 59
2.15. Perinatal death of mice expressing epidermal FoxO1-ADA ... 60
2.16. Strongly impaired stratification in FoxO1-ADA mice ... 62
2.17. No increase in apoptosis in FoxO1-ADA mice ... 64
2.18. Biased loss of ACD in FoxO1-ADA mice ... 65
2.19. Altered p63 target gene expression in FoxO1-ADA mice ... 66
2.20. Wnt/
β-catenin signaling is impaired in FoxO1-ADA mice ... 67
3. Discussion ... 69
3.1. A role for IIS in mitotic progression ... 69
3.2. The role of IIS/FoxO in the regulation of SCD and ACD ... 71
3.3. The role of IIS regulation of p63 in epidermal development ... 73
3.4. The interaction of FoxO and p63 ... 75
3.5. The role of FoxO during hair follicle development ... 77
3.6. Model ... 79
3.7. Future prospects ... 81
4. Material and Methods ... 82
4.1. Mice ... 82
4.1.1. Epidermis specific IR and IGF-1R knockout mice ... 82
4.1.2. FoxO1-DN and FoxO1-ADA mice ... 82
4.1.3. FoxO1-GFP mice ... 83
4.1.4. Isolation of epidermis of newborn mice ... 83
4.1.5. Isolation of epidermis of E16.5 embryos ... 83
4.2. Immunohistochemistry ... 84
4.2.1. Paraffin embedded skin sections ... 84
4.2.2. Division axis orientation determination ... 84
4.3. Protein biochemistry and molecular biology ... 85
4.3.1. Protein extraction from epidermal splits and keratinocytes ... 85
4.3.2. SDS-Polyacrylamid-gelelectrophoresis (SDS-PAGE) and immunoblot ... 85
4.3.3. Co-immunoprecipitation ... 86
4.3.4. RNA extraction ... 86
4.3.5. cDNA synthesis and realtime qPCR analysis ... 86
4.3.6. Global genome expression analysis ... 87
4.3.7. Chromatin-immunoprecipitation followed by qPCR ... 87
4.3.8. Site directed mutagenesis ... 88
4.4. Cell biology ... 88
4.4.1. Isolation and cultivation of primary keratinocytes ... 88
4.4.2. Chinese hamster ovarian cell culture ... 89
4.4.3. Transient transfection of keratinocytes and CHO cells and luciferase reporter assays ... 89
4.4.4. RNA interference ... 90
4.5. Statistical methods ... 90
4.6. Antibodies, primer and plasmids ... 91
4.6.1. Primary antibodies ... 91
4.6.2. Secondary antibodies ... 91
4.6.3. Primer ... 92
4.6.4. Plasmids ... 93
5. Abbreviations ... 94
6. References ... 97
7. Acknowledgements ... 118
8. Erklärung ... 119
9. Curriculum vitae ... 120
1. Introduction
1.1. The mammalian epidermis
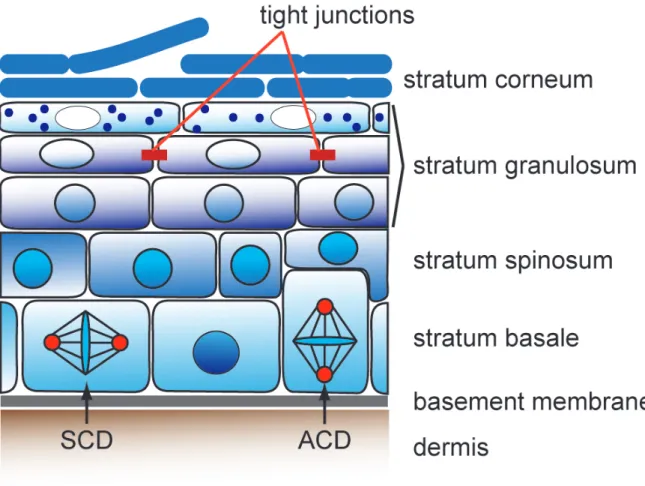
The mammalian skin is composed of two distinct compartments, the dermis and the epidermis, which are separated by a basement membrane. The outermost layer, the epidermis, is a stratifying epithelium that forms a protective barrier against external challenges and dehydration (Fig. 1). This life-long self-renewing tissue is composed of the interfollicular epidermis (IFE) and its appendages, the hair follicles, sebaceous glands and sweat glands (Chuong et al., 2000; Fuchs et al., 2002; Watt et al., 2013).
The majority of the cells in the epidermis are keratinocytes but also other cell types, e.g. dendritic cells, macrophages or melanocytes, are present. The IFE is organized in distinct layers beginning with the basal cell layer (stratum basale), which through cell adhesion receptors such as integrins adhere to the underlying basement membrane. The keratinocytes in this layer are undifferentiated, have a high proliferative potential and are characterized by the expression of the cytoskeletal intermediate filaments keratin 14 and keratin 5 (K5 and K14) (Nelson and Sun, 1983;
Eichner et al., 1986; Koster and Roop, 2007). Due to yet ill-defined stimuli certain cells of the basal layer move outwards into the suprabasal spinous layer (stratum
spinosum) with post-mitotic cells that undergo further differentiation (Smart, 1970).This layer is mainly characterized by the stratification markers keratin 1 and keratin
10 (K1 and K10). These spinous cells undergo terminal differentiation and form the
granular layer (stratum granulosum) and the subsequent cornified layer (stratum
corneum). This final process is accompanied by the initiation of the late stratificationmarkers loricrine and involucrin and involves the formation of the epidermal barrier
(Bickenbach et al., 1995). A major component of the granular layer are the
intercellular tight junctions, which are ion and size selective paracellular diffusion
barriers that prevent diffusion of solutes through the intercellular space and thereby
form the paracellular diffusion barrier (Furuse et al., 2002; Tunggal et al., 2005);
Morita et al., 2011). The dead cornified layer consists of corneocytes that together with extracellular lipids forms the outer most barrier. During the final terminal differentiation step cells flatten, degrade their DNA and subsequently assemble the cornified envelope underneath the plasma membrane by the incorporation and processing of precursor proteins, such as filaggrins and small proline-rich proteins (Sprr’s) (Segre, 2003). Finally, the cells become more permeable and the influx of calcium activates transglutaminases that crosslink proteins of the cornified envelope, which forms a scaffold for the lipids that are produced by the layers underneath (Segre, 2003).
Although essential structural components of the epidermis are identified, the precise
regulation of the balance between proliferation and differentiation during epidermal
homeostasis to maintain the barrier needs further investigation. For example, it is
poorly understood which signals are important for the initiation of this stratified
epithelium and how these signals are altered during epidermal pathogenesis.
Figure 1: Schematic representation of the mammalian interfollicular epidermis. The interfollicular epidermis (IFE) is a stratified epithelium with different layers. The basal layer (stratum basale) contains proliferating keratinocytes. Cells in this layer can either divide symmetrically expanding the basal layer or asymmetrically resulting in one basal and one suprabasal daughter. Upon differentiation keratinocytes migrate into the spinous layer (stratum spinosum). In the granular layer (stratum granulosum), the cells are more flattened and form the tight junction barrier. The stratum corneum forms the most outer layer of the epidermis and fuctions as a the lipid barrier. SCD- symmetric cell division, ACD-asymmetric cell division
1.2. Epidermal morphogenesis
The barrier function of the epidermis is established during embryogenesis as a result
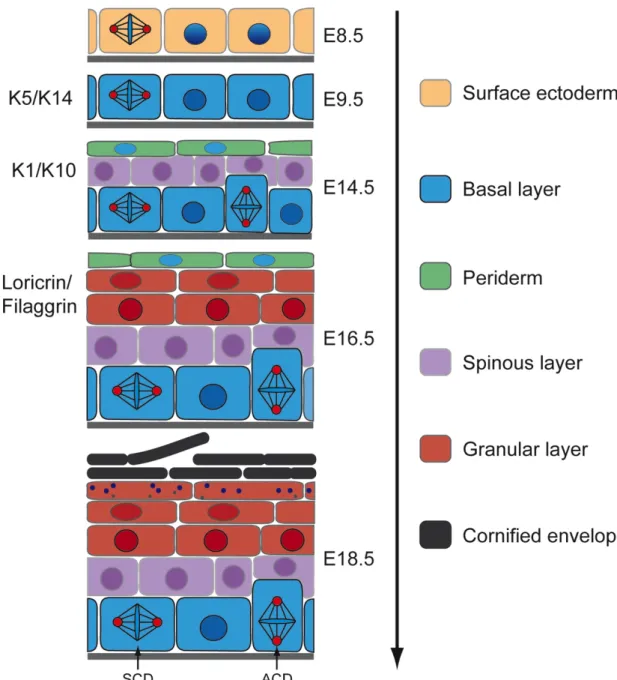
of a precisely coordinated stratification program (Koster and Roop, 2007) (Fig. 2). In
mice, the execution of this program initiates at around embryonic day 8.5 (E8.5)
when cells of the ectoderm are committed to an epidermal fate and start to express
the fibrous structural proteins K5 and K14 (Byrne et al., 1994). This initial step of
stratification is controlled by p63, a member of the p53 transcription factor family,
which specifies the epidermal lineage (Green et al., 2003) by blocking neural
specification in the surface ectoderm (Bakkers et al., 2002). Subsequently, at E9.5
the first newly formed layer of keratinocytes gives rise to the periderm, a specialized
simple epithelium that forms a barrier towards placental fluids and is shed off before
birth, when the functional barrier of the epidermis is formed (M'Boneko and Merker,
1988). At around embryonic day 12.5 (E12.5) stratification is initiated and the
epidermis becomes multilayered resulting in the formation of the intermediate
spinous layer between the basal layer and the periderm (Smart, 1970; Weiss and
Zelickson, 1975). In this layer the keratinocytes are committed to differentiation,
which is accompanied by the expression of K1 and K10. How this cell layer is
initiated and maintained is not completely understood. The prevailing model suggests
that a change in the plane of cell division in the basal keratinocytes, switching from
parallel to perpendicular to the basement membrane, is important for this process
(Smart, 1970; Lechler and Fuchs, 2005). Moreover, this division in the cells of the
basal layer is associated with the asymmetric distribution of proteins, which have
been implicated in asymmetric cell divisions (ACD) in lower organisms (Lechler and
Fuchs, 2005; Poulson and Lechler, 2010) Williams et al., 2011). In lower organisms,
this asymmetric distribution of cell fate determinants is responsible for the
development of daughter cells with two distinct cell fates. In the epidermis, this
perpendicular or asymmetric division results in one daughter cell that remains in the basal layer and contributes to the maintenance of this layer and the other daughter cell is committed towards differentiation and thereby contributes to suprabasal layers (see also section 1.2.1).
During the transition from E15.5 to E16.5 the suprabasal layers expand from 2-3 to 4- 6 layers accompanied by the formation of the granular layer and the initiation of
stratum corneum formation at the dorsal site resulting in local barrier function (Byrneet al., 1994). At this step a program for the expression of essential proteins for barrier formation and terminal differentiation, such as loricrin and filaggrin, is initiated (Bickenbach et al., 1995). This program involves the transcriptional activation of specific sets of genes, which are found in the epidermal differentiation complex (EDC) of mouse chromosome 3 (Marshall et al., 2001; Martin et al., 2004). The coordinated expression of these genes eventually leads to the development of the cornified envelope, which forms a scaffold for the barrier lipids. Additionally, the tight junction barrier, which has been shown to depend on Claudin 1 and E-cadherin function (Furuse et al., 2002; Tunggal et al., 2005), is a crucial part of the granular layer. Finally, the epidermal morphogenesis is completed at E18.5 when a fully functional epidermal barrier is formed.
Several signaling pathways have been implicated in the regulation of different steps of this morphogenetic stratification program. For example, Notch signaling was shown to be essential for the onset of stratification and formation of spinous layers as loss of all Notch activity, or its processing enzyme ADAM10 in the epidermis resulted in hyperproliferation and inhibited the induction of the differentiation markers K1 and involucrin resulting in a reduced number of spinous layers (Rangarajan et al., 2001;
Blanpain et al., 2006; Weber et al., 2011). Another pathway involves serine/threonine
protein kinase C (PKC) activity that specifically regulates the transition from spinous
to granular layers, which was indicated by the down regulation of K10 and the induction of loricrin in vitro in keratinocytes (Dlugosz and Yuspa, 1993).
However, how all these signaling cascades involved in the different steps during this
stratification process are orchestrated requires further investigation. To date, only the
transcription factor p63 has been implicated in most of these processes, the onset of
epidermal specification, regulation of ACD/SCD, control of proliferative potential,
differentiation and formation of the barrier (Koster and Roop, 2007). This transcription
factor is therefore regarded as the “master regulator“ of epidermal morphogenesis.
Figure 2: Schematic representation of epidermal morphogenesis. During murine epidermal morphogenesis from E8.5 to E18.5, the single layered surface ectoderm initiates a stratification program leading to the formation of the different epidermal layers with the different stratification markers (left) and eventually the barrier. SCD- symmetric cell division, ACD-asymmetric cell division
1.2.1. Asymmetric cell division in the epidermis
Asymmetric cell division (ACD) is the process by which a cell divides into two daughter cells with differential cell fates (Fig. 3). In contrast to ACDs in symmetric cell divisions (SCDs) the two daughter cells maintain the same fate. Studies in
C.elegans
and
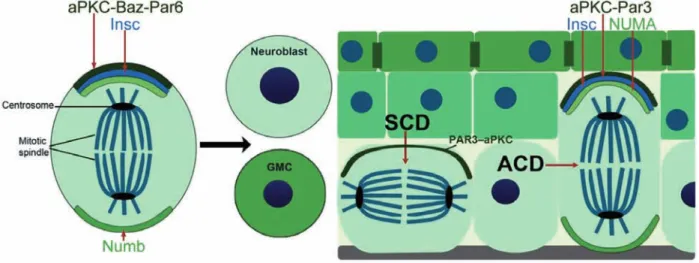
Drosophila melanogaster were instrumental to unravel the conservedmolecular machinery regulating ACDs (Fig. 3) (Morin and Bellaiche, 2011). In Drosophila neuroblasts, polarity signaling coordinates the orientation of the spindle with the asymmetric distribution of cell fate determinants. The initial polarity of these cells is achieved by apical localization of the partitioning defect (Par)-complex, which consists of Par3, Par6 and the atypical protein kinase C (aPKC), resulting in a neuroblast cell with an apical-basal axis along which the spindle aligns (Knoblich, 2008; Poulson and Lechler, 2012). This polarity is transmitted to the spindle by the protein Inscutable (Insc), which binds directly to Par3 and forms an apical cortex (Schober et al., 1999). This alignment is accompanied by the basal localization of cell fate determinants, including Numb (Knoblich, 2010; Poulson and Lechler, 2012). By the interactions with further proteins involving LGN and NuMA the proper spindle alignment is achieved and the cell is able to divide asymmetrically into two daughter cells with different cell fate, one neuroblast and one ganglion mother cell (Poulson and Lechler, 2012).
In mammals, ACD provides a mechanism to generate distinct cell types and thereby can generate cellular diversity in a three dimensional tissue (Niessen et al., 2012).
Already in 1970, divisions perpendicular to the basement membrane were observed
in esophagus, a stratifying epithelium (Smart, 1970), suggesting that ACD might
regulate stratification. More direct evidence came from a study by Lechler and Fuchs
(2005), in which a shift in division orientation was linked to the initiation of
stratification. Cells in the basal layer of the epidermis can divide in parallel to the
basement membrane resulting in two daughter cells, thus contributing to expansion of the surface area. In contrast, cells that dividing perpendicular to the basement membrane fuel the suprabasal epidermal layers. In these ACDs, one daughter remains in the basal layer and one daughter cell is committed towards differentiation (Lechler and Fuchs, 2005). At E12.5, when stratification is initiated, a major shift from SCDs to ACDs occurs in the basal layer. In these ACDs, the basal daughter expresses the basal layer marker K14 and the suprabasal daughter of the ACD begins to express K10 (Williams et al., 2011; Poulson and Lechler, 2012).
Interestingly, this switch towards more asymmetrical divisions was completely lost in mice lacking p63 (Lechler and Fuchs, 2005), implicating p63 in the regulation of oriented cell divisions in the epidermis. Further studies investigating the role of the polarity proteins Insc and NuMA showed that the expression of Insc and the recruitment of NuMA to the apical cell cortex are necessary for ACDs and epidermal stratification (Poulson and Lechler, 2012). Importantly, p63
-/-did not alter the expression or localization of both proteins, suggesting a more indirect regulation of ACD by p63 (Lechler and Fuchs, 2005). Additionally, knockdown of either LGN or NuMA during initiation of stratification resulted in a shift from ACDs to SCDs. This switch was accompanied by a reduction in Notch signaling, which is important for suprabasal cell differentiation (Williams et al., 2011). Interestingly, this depletion did not affect the Par-complex localization, suggesting that aPKC and Par3 are upstream of NuMA and LGN in the regulation of ACD (Williams et al., 2011). In line with this, the epidermal inactivation of the aPKCλ isoform produced more ACDs in the developing IFE and in different hair follicle compartments, accompanied by an altered cellular fate (Niessen et al., 2013).
These results indicate that division orientation is crucial for epidermal morphogenesis.
However, whether signals from the niche control SCDs and ACDs during epidermal
morphogenesis and how p63 regulates these processes are still not known and will be important subjects for future investigations.
Figure 3: Asymmetric cell division in Drosophila and mammalian epidermis. In drosophila neuroblast (right panel) and SCD/ACD in the mammalian epidermis (left panel) (Niessen et al., 2012) aPKC- atypic protein kinase C, Baz- drosophila Par3, Par6- patitioning defect 6, Par3 patitioning defect 3, Insc- inscutible, NuMA- nuclear mitotic apparatus protein. Figure was adapted from Niessen et al. (2012).
1.2.2. The transcription factor p63: structure, expression and function
P63 is a member of the p53 family of transcription factors, which consists of p53, p63 and p73. All three genes share a significant sequence homology and contain a N- terminal transactivation domain, a DNA-binding domain (DBD) and an oligomerization domain (Yang et al., 2002). In addition, they all can bind DNA at a canonical p53-binding site and thereby regulate the expression of a subset of similar target genes (Yang et al., 2002; Yang et al., 2006).
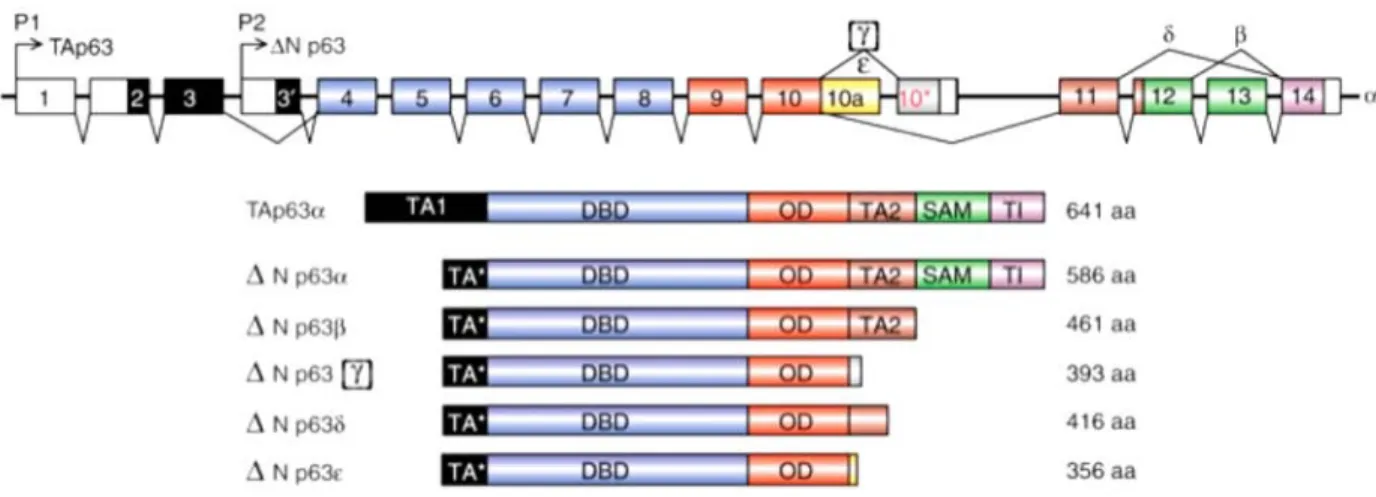
P63 is a tetrameric transcription factor that is expressed from two different promoters,
thereby generating at least six different isoforms with identical DBD, but different
transactivation capabilities (Yang et al., 1998). Three of these isoforms contain a N-
terminal transactivation domain (TA) similar to p53 whereas three Δ N isoforms
contain a shorter alternative TA domain (Yang et al., 1998) (Fig. 4). Furthermore, the p63
αisoforms contain a C-terminal sterile alpha motif (SAM), thus suggesting the interaction with other co-regulating proteins (Yang et al., 1998; Thanos and Bowie, 1999; Cicero et al., 2006). Initially, it was thought that the ΔN isoforms were unable to induce target gene expression due to the presence of the alternative TA domain and therefore would function as dominant negative transcriptional repressors. However, later it was shown that ectopic
ΔNp63 isoform expression could transactivate p53reporter and induce expression of endogenous p53 targets (Dohn et al., 2001; Ghioni et al., 2002; King et al., 2003).
At present, contradictory opinions about the expression of the different p63 isoforms during surface ectoderm initiation and epidermal morphogenesis exist. One model suggests that TAp63
αfunctions as a molecular switch to initiate epithelial stratification as it is expressed as one of the first genes in the surface ectoderm prior to the expression of K5/K14 at E7.5 (Koster et al., 2004; Romano et al., 2009).
Indeed, induced ectopic expression of TAp63 in simple epithelia induced a
stratification program (Koster et al., 2004). ΔNp63
α, the major isoform responsible for
epidermal development and homeostasis, suppresses TAp63
αand is expressed
later at E8.5 (Koster et al., 2004; Laurikkala et al., 2006). During ectodermal
specification Bmp signaling is essential for the initiation of p63 expression, which
blocks neural development and promotes epidermal commitment (Bakkers et al.,
2002; Aberdam et al., 2007).
Figure 4: Schematic representation of p63 isoforms. Exon/intron organization of the human p63 gene and the alternative promoter and splicing site that give rise to the six different p63 isoforms (Vanbokhoven et al., 2011). DBD- DNA-binding domain, aa- amino acids, OD- oligomerization domain, SAM- sterile alpha motif, TA- transactivation domain, TI- transactivation inhibitory domain. (adapted from Vanbokhoven et al. 2011)
The importance of p63 for stratifying epithelia became first obvious when mice lacking p63 were investigated. These mice die from dehydration shortly after birth and display cleft palate, limb truncation and fail to develop all stratified epithelia, including the epidermis (Mills et al., 1999; Yang et al., 1999). This severe epidermal phenotype indicated a non-redundant role for p63 in this tissue and was associated with the loss of proliferative potential in progenitor cells (Yang et al., 1999; Senoo et al., 2007), impaired epidermal stratification and alterations in the differentiation of keratinocytes (Mills et al., 1999; Koster et al., 2004).
This key role for p63 as regulator of ectodermal development is in line with observations in human syndromes that have been linked to mutations in p63 resulting in altered p63 function. These ectodermal dysplasia (ED) syndromes are characterized by split hand/foot malformations and orofacial clefting. It was shown that dominant mutations in the p63 gene can cause at least five different syndromes:
ectrodactyly, ectodermal dysplasia and cleft lip/palate syndrome (EEC),
ankyloblepharon-ectodermal defects-cleft lip/palate syndrome (AEC), limb-mammary syndrome (LMS), acro-dermato-ungual-lacrimal-tooth syndrome (ADULT) and Rapp- Hodgkin syndrome (RHS). One of the main characteristics of these syndromes is ED.
In this condition skin, hair, teeth, nails and several glands are usually abnormally developed. In extreme cases large areas of the skin can be eroded. The genotype/phenotype correlations of these patients can provide information about the function of the different p63 domains in the different ectodermal compartments (Rinne et al., 2007).
For example, EEC syndrome is associated with mutations in the DBD of the p63 gene and thereby impairs the binding of p63 to the DNA (Rinne et al., 2007). One potential target that is miss-regulated by altered DNA-binding of p63 is the interferon- regulated factor 6 (IRF6) as mutations in the gene encoding this protein display similar phenotypic outcome as p63 mutations (Thomason et al., 2010; Moretti et al., 2010). These patients suffer mainly from cleft lip/palate (40% of the patients), which demonstrates the importance of this domain for craniofacial development (Rinne et al., 2007). AEC and RHS syndrome patients in contrast, mainly harbor mutations in the SAM domain of p63 (Rinne et al., 2007). The SAM domain is known to be involved in protein-protein interactions and mutations in this domain are thus most likely hampering the binding to interacting proteins (Rinne et al., 2007). The main features of AEC/RHS patients are nail and teeth defect (80% of patients), hair defects e.g. alopecia (94% of patients) and severe skin erosions (80% of patients), indicating the crucial role for p63-protein interactions in the regulation of specific target gene (Rinne et al., 2007).
In the epidermis p63 is predominantly expressed in the basal and the spinous layer
and is downregulated upon initiation of differentiation in the suprabasal layers (Yang
et al., 1999; Westfall et al., 2003; Koster et al., 2004; Koster and Roop, 2007). In the
basal layer p63 was shown to maintain keratinocyte proliferative potential and regulates cell adhesion (Yang et al., 1999; Truong et al., 2006; Carroll et al., 2006). It was proposed that p63 regulates proliferation by preventing senescence, as shown by the loss of the senescence markers p16 and promyelocytic leukemia (PML) protein in p63 deficient cells (Keyes et al., 2005). In addition, p63 promotes cell cycle progression by transcriptional regulation of genes, such as p21, p57Kip2 and Skp2 (Westfall et al., 2003; Beretta et al., 2005; McDade et al.). However, the cell cycle defect that was observed in p63-depleted keratinocytes could be rescued by the down-regulation of p53, indicating that p63 effects on proliferation are at least in part dependent on p53 (Truong et al., 2006). As p63 is able to regulate p53 genes (King et al., 2003; Westfall et al., 2003), it is possible that p53 and p63 compete for the same p53 consensus sequences and thereby regulate a similar set of target genes in the opposing manner (Westfall et al., 2003). Moreover, p63 knockdown in keratinocytes resulted in the down-regulation of adhesion genes, such as integrin
α3 and integrin
β4, and in cell detachment, suggesting a role for p63 in the regulation of cell adhesion (Carroll et al., 2006).
In addition to proliferation and adhesion,
ΔNp63α regulates keratinocytedifferentiation and epidermal stratification. This becomes evident by the investigation
of its transcriptional targets. Thus, p63 inhibits a range of proteins that are implicated
in cell cycle arrest and differentiation. For example, 14-3-3σ is suppressed by p63 in
the basal layer. Suprabasal commitment of keratinocytes was accompanied by the
loss of p63 repression on 14-3-3σ allowing 14-3-3σ to induce, most likely, a G2/M
arrest (Hermeking et al., 1997) resulting in the cell cycle exit of these differentiating
keratinocytes (Pellegrini et al., 2001). In agreement mice that overexpressed 14-3-3σ
in the basal epidermal layer display a hypoplastic phenotype and fail to develop a
stratified epidermis (Cianfarani et al., 2011). Another example of a p63 target gene
implicated in epidermal differentiation is Zfp750. This transcription factor promotes terminal differentiation by transactivation of another transcription factor, the Krüppel- like factor 4 (Klf4) (Sen et al., 2012), which is required for the establishment of the epidermal barrier function (Segre et al., 1999). Moreover, p63 regulates several genes of the EDC indirectly by epigenetic modulation. In mice the special AT-rich sequence-binding protein 1 (Satb1), another direct p63 target, functions as chromatin remodeler regulating the EDC locus opening during terminal differentiation of keratinocytes and thereby allows the expression of these genes, such as late cornified envelope 3c (Lce3c) and
Involucrin (Fessing et al., 2011). Thus, p63 hasbeen implicated in both early and late steps of the epidermal stratification program.
Understanding how p63 orchestrates proliferation, differentiation and stratification will be essential to understand how mutations in p63 can result in such a wide spectrum of patient phenotypes and will thus require further investigation. In addition, the identification of upstream signals that regulate the different functions of p63 during morphogenesis and homeostasis is another important research area for the future.
1.3. Insulin/IGF-1 signaling
Insulin and insulin-like growth factor 1 (IGF-1) are endocrine hormones with high
structural similarity. Insulin is produced by the
β-cells in the pancreas and is central
for the regulation of carbohydrate metabolism. IGF-1 is primarily produced by the
liver, but can also be secreted by other tissues, including stromal fibroblasts. Both
ligands control energy metabolism and tissue growth through binding to their
receptors. The insulin-like growth factor 1 receptor (IGF-1R) and the insulin receptor
(IR) are related tyrosine kinase transmembrane proteins, which are ubiquitously
expressed. Thus, IGF-1 binds the IGF-1R with high and the IR with low affinity the IR
and vice versa insulin binds to the IR with high and to the IGF-1R with low affinity.
Furthermore, both receptors can form heterodimers and thereby fine-tune the response to ligand binding. In addition, the insulin-like growth factor 2 (IGF-2) ligand is also able to bind, with reduced affinity, to both receptors. In contrast to the IR and IGF-1R, the insulin-like growth factor 2 receptor (IGF-2R) has no reported tyrosine kinase activity (Baserga et al., 1997; Pollak et al., 2004).
The IR and the IGF-1R share approximately 70% amino acid identity and both are synthesized as single chain pre-proreceptors. The processed proreceptors are further glycosylated, proteolytic cleaved and finally cross-linked by cysteine bonds to form a
αβtransmembrane protein. Whereas the putative ligand-binding site is found in the extracellular
αsubunit, the tyrosine kinase domain is located in the intracellular
βsubunit. Ligand binding to IR or IGF-1R results in kinase activation and autophosphorylation on three conserved tyrosines in the kinase domain, which further leads to phosphorylation at carboxy-terminal and juxta-membrane tyrosines.
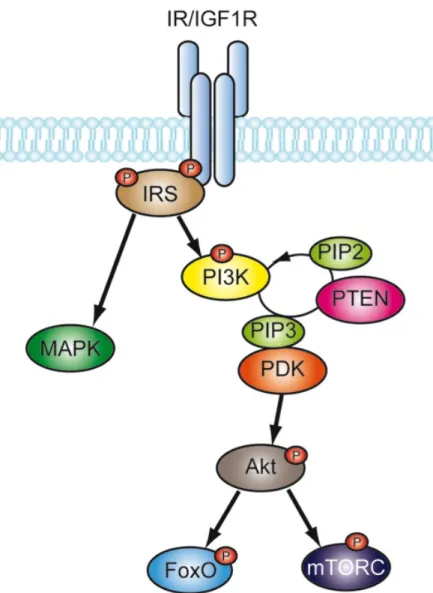
This results in the recruitment and subsequent phosphorylation of specific binding proteins, such as insulin receptor substrate 1 (IRS1) (Pollak et al., 2004). These molecules can activate different signaling cascades. For example, upon activation IRS1 can recruit and activate the phosphoinositide-3 kinase (PI3K). This interaction results in the accumulation of phosphatidylinositol-3,4,5-trisphosphate (PIP3), which in turn activates the phosphoinositide dependent kinase 1 (PDK1) resulting finally in the activation of protein kinase B (PKB also known as Akt). Akt itself can regulate a plethora of downstream signaling targets, such as Forkhead box O transcription factors (Fig. 5) (Ogg et al., 1997). Additional downstream effectors of IR/IGF-1R (IIS) include the mammalian target of rapamycin complex (mTORC), extracellular signal- regulated kinases (ERK) and c-jun N-terminal kinases (JNK) (Pollak et al., 2004).
Although structurally very similar, the function of IR and IGF-1R can be quite distinct
in different tissues. Thus, the IR was suggested to be more important for energy
metabolism, as demonstrated by IR
-/-mice, which are born largely normal, but have an early onset of diabetes and die due to ketoacidosis (Accili et al., 1996; Pollak et al., 2004). IGF-1R
-/-mice, in contrast, are much smaller then control mice at birth (±45%
of normal size) and die due to severe organ hypoplasia, thus indicating the
importance of IGF-1 for tissue growth (Liu et al., 1993). Nevertheless, IR/IGF-1R
double knockout studies indicate an additional growth related role of the IR during
embryogenesis (Kitamura et al., 2003). Single mutations ablating IR function result in
embryos that are 90% of normal size, whereas single IGF-1R mutations result in
small embryos (±45% of normal size). Combined ablation of IR and IGF-1R, however,
resulted in even smaller embryos that are 30% of normal size, demonstrating a
growth-promoting role during embryogenesis not only for the IGF-1R but also for IR
(Kitamura et al., 2003).
Figure 5: Schematic representation of the IR/IGF-1R signaling pathway. The insulin/IGF-1 binding dependent signaling cascade with conserved downstream regulators. IRS- insulin receptor substrate, PI3K- phosphoinositide-3 kinase, PIP3- phosphatidylinositol 3,4,5-trisphosphate, PDK- phosphoinositide dependent kinase, PTEN- phosphatase and tensin homolog, Akt- protein kinase B, FoxO- forkhead box O factor, mTORC- mammalian target of rapamycin complex, MAPK- mitogen activated protein kinase
1.3.1. FoxO transcription factors
Forkhead box O transcription factors (FoxOs) belong to the family of FOX transcription factors. The defining feature of this family is a 80-100 amino acid motif that binds DNA. This motif is a highly conserved “winged-helix” DBD and was first described in
Drosophila melanogaster (Lam et al., 2013). The sub-family of FoxOproteins mainly acts as transcriptional activators by binding to a conserved TTGTTTAC consensus core recognition motif in diverse target genes (Furuyama et al., 2000) thereby controlling various cellular processes including cell cycle, cell survival and metabolism by regulating the expression of diverse target genes (Calnan and Brunet, 2008). FoxOs are highly conserved and in mammals consists of four members, FoxO1, FoxO3, FoxO4 and FoxO6. They are controlled by a wide range of stimuli, such as growth factors, nutrients, cytokines and oxidative stress stimuli (Fig.
6) (Calnan and Brunet, 2008; Eijkelenboom and Burgering, 2013). For example,
insulin/IGF-1, act through PI3K to activate PDK1 and subsequently Akt. Active Akt
then translocates to the nucleus and phosphorylates FoxO at three conserved
phosphorylation sites leading to nuclear export and cytoplasmic retention of FoxO
(Fig. 7) (Calnan and Brunet, 2008; Eijkelenboom and Burgering, 2013). FoxO6 in
contrast lacks the third phosphorylation site and is not regulated by nucleo-
cytoplasmic shuttling (Jacobs et al., 2003). In addition, stress signaling (mainly high
levels of reactive oxygen species) activates FoxO in the opposite way and induces
translocation to the nucleus. This was initially shown to involve JNK-mediated
phosphorylation of FoxO (Eijkelenboom and Burgering, 2013).
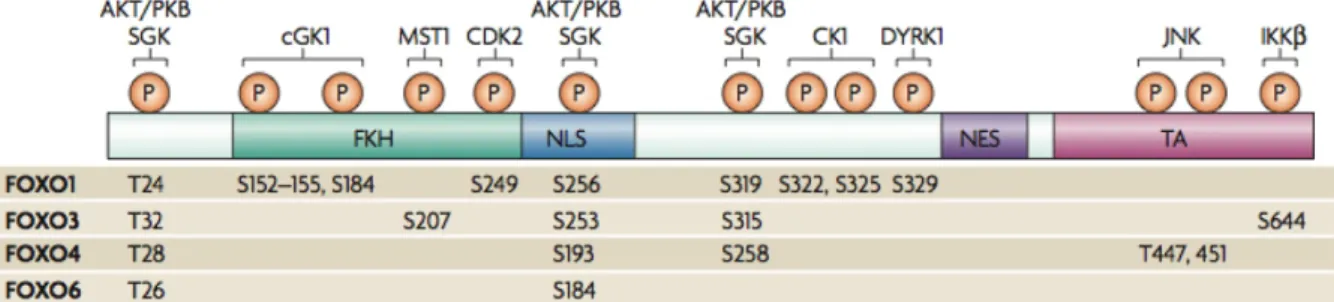
Figure 6: Schematic representation of human FoxO isoforms. The structure and the phosphorylation sites of the different mammalian FoxO isoforms are shown. FKH- forkhead domain, NLS- nuclear localization signal, NES- nuclear export sequence, TA- transactivation domain. (adapted from van der Horst et al. 2007)
The FoxO homologue Daf-16 in
C. elegans extends longevity (Lin et al., 1997; Ogget al., 1997; van der Horst and Burgering, 2007). The effects of loss of the C. elegans
homologue Daf-2 resulting in longevity, were bypassed by the loss of Daf-16,
indicating that Daf-2 antagonizes Daf-16 function. In C. elegans, loss of Daf-2 leads
to a developmentally arrested dauer stage, but animals bearing weak Daf-2 mutants
could develop reproductively, but showed increased energy storage and longevity
(Lin et al., 1997; Ogg et al., 1997). These findings suggested a potential role for the
insulin/IGF-1/FoxO axis in longevity and ageing of higher organisms. In agreement,
deregulation of FoxO activity was identified in several age-related diseases, such as
cancer and diabetes (van der Horst and Burgering, 2007; Eijkelenboom and
Burgering, 2013).
Figure 7: Simplifies Scheme of insulin/IGF-1 mediated regulation of FoxOs. Insulin/IGF-1 regulate FoxO cytoplasmic retention by Akt dependent phosphorylation. Upon ligand binding IR/IGF- 1R phosphorylate Akt via IRS and PI3K. Akt translocates to the nucleus and phosphorylates FoxOs.
Phosphorylated FoxOs are actively exported from the nucleus. IRS- insulin receptor substrate, PI3K- phosphoinositide-3 kinase, Akt- protein kinase B, FoxO- forkhead box O factor
1.3.2. Regulation of FoxO transcriptional activity
As shown by the IIS/PI3K/Akt mediated cytoplasmic retention, FoxO regulation is
achieved mainly by post-translational modification (PTM). Phosphorylation of FoxO at
the first and the second phosphorylation site that regulate nuclear export creates
binding sites for the chaperone protein 14-3-3 (Brunet et al., 1999; Obsilova et al.,
2005). This binding allows the active export of FoxOs by exposing the nuclear export
sequence (Brunet et al., 2002). Additionally, the second phosphorylation site
prevents re-entry to the nucleus by the introduction of a positive charge in the nuclear
localization signal (Rena et al., 2001). Multiple other kinases can also regulate FoxO
activity at other sites than those targeted by Akt and regulate FoxO cytoplasmic sequestration (Rena et al., 2001). E.g. cyclin dependent kinase 1 and 2 are able to phosphorylate FoxO1 at serine 249 and also induce sequestration in the cytoplasm (Huang et al., 2006; Yuan et al., 2008). Although this is connected to DNA-damage responses the functional consequence of this is unclear.
Vice versa stress stimuli promote nuclear translocation of FoxOs, even in the presence of growth factors. In response to oxidative stress, the kinase MST1 phosphorylates FoxO3 at Ser207 (human) in the DNA-binding domain and disrupts 14-3-3 binding. This enables FoxO3 re-localization from the cytoplasm to the nucleus (Lehtinen et al., 2006; Calnan and Brunet, 2008). Similarly, the stress activated protein kinase JNK phosphorylates FoxO4 at two phosphorylation sites (Thr447 and Thr 451), which also results in FoxO nuclear localization (Essers et al., 2004).
The AMP-activated protein kinase (AMPK), which has a central role in cellular energy homeostasis controls cell growth and energy expenditure by among others phosphorylating FoxO3 at three conserved serine residues (Ser413, Ser588 and Ser626) (Hardie et al., 2012). This leads to FoxO transcriptional activity in response to low energy levels and contributes to stress resistance, by the up-regulation of the superoxide dismutase Sod3 (Greer et al., 2007). This activation of FoxO is independent of the regulation of its subcellular localization and also independent of additional growth factor stimulation.
Acetylation is another PTM that can regulate FoxO nuclear activity. For example,
Histone deacytelases, including sirtuins (Sirt), regulate FoxO acetylation leading to
changes in FoxO DNA-binding capacities in response to stress signaling (Brunet et
al., 2004; van der Horst et al., 2004). Thus, the de-acetylation of FoxO by Sirt1 has
been proposed to induce a switch in gene expression from apoptosis to stress
resistance and cell cycle arrest. This was shown by the deletion of Sirt in mouse
embryonic fibroblasts (MEFs), which reduced FoxO-dependent CDKN1B and GADD45 expression but not the pro apoptotic gene BCL2 (Brunet et al., 2004).
In response to insulin and growth factor signaling through the PI3K-Akt pathway, FoxOs are not only sequestered in the cytoplasm but also can be targeted for degradation. This degradation is also induced by Akt phosphorylation resulting in poly-ubiquitinylation of FoxO by the E3 ligase SCFskp2 complex (Huang et al., 2005).
Moreover, the interaction of FoxOs with other transcription factors creates further variation in the transcriptional output in different cell types. Through these interactions FoxOs are able to mediate crosstalk with other signaling pathways and integrate their upstream information into target gene regulation. Several transcriptional interaction partners have been described. FoxOs can bind nuclear receptors (e.g. oestrogen receptor, retinoic acid receptors), metabolic regulators (PPARγ) and transcription factors (e.g. SMAD proteins) (Eijkelenboom and Burgering, 2013).
Interestingly, FoxO and p53 are both involved in regulation of cell cycle progression and cellular survival. They also both can control expression of enzymes such as Sirt1 and MDM2. Moreover, it was shown that in response to nutrient deprivation FoxO releases p53 mediated Sirt1 repression and thereby leads to Sirt1 up regulation. This repression appeared to be independent of the presence of a FoxO-binding site in the Sirt1 promoter (Nemoto et al., 2004). This binding is mediated by two conserved regions in the FH domain and the C-terminal transactivation domain of FoxO, which interact with the DNA-binding domain of p53 (Wang et al., 2008). Thus, FoxO may also regulate gene expression independent of FoxO binding to DNA.
Further, it was proposed that FoxO and the myelocytomatosis viral oncogene (MYC)
act as antagonists during the regulation of mitochondrial homeostasis. Hypoxia
induced binding of FoxO3 to the promoter of mitochondrial genes is inversely
correlated with MYC promoter binding. Thus, siRNA knockdown of FoxO3 increased the binding of MYC to these promoters suggesting that FoxO3 directly inhibits MYC DNA interactions. Generally, FoxO and MYC directly and indirectly inhibit each other and have opposing effects on proliferation and energy consumption independent of FoxO-DNA binding (Jensen et al., 2011).
It was also demonstrated that upon increased oxidative stress FoxO and
β-catenincan interact and regulate FoxO transcriptional activity.
β-catenin is a transcriptional co-activator downstream of Wnt signaling that binds to and activates TCF (T cell factor) transcription factors. Interestingly, in osteoblasts oxidative stress causes a switch from TCF dependent transcription to FoxO-dependent target expression. This is most likely due to FoxO-sequestration of
β-catenin away from TCF (Essers et al., 2005; Hoogeboom et al., 2008). Overall, FoxO transcription factors function at the intersection of numerous signaling pathways and transmit external stimuli into transcriptional regulation of the appropriate target genes. Therefore, FoxO function has to be fine-tuned at various levels to induce the proper cellular responses.
1.3.3. FoxO function in stem cells
FoxO transcription factors mainly function to regulate cellular and organismal homeostasis. In addition to their roles in differentiated cells they also are critical to limit the expansion of stem and progenitor cells of tissues.
In the hematopoietic system FoxOs normally limit the expansion of myeloid and
lymphoid cell lineages by inhibiting stem cell proliferation and maintaining quiescence
(Eijkelenboom and Burgering, 2013). Conditional ablation of FoxO1, -3 and -4 in
hematopoietic system resulted in hematopoietic stem cell (HSC) pool exhaustion and
increased reactive oxygen species (ROS) and apoptosis. HSCs are considered to be
quiescent stem cells and FoxOs control the G0 to G1 and G1 to S phase progression
during cell cycle through the regulation of transcriptional targets including
CCNG2, CDKN1A, CDKN1B and CCND2. In addition, they protect HSCs from cell death andmaintain their self-renewal capacity, which is mediated by the resistance to oxidative stress through upregulation of Sod2, Catalase, ATM and CDKN2A (p16) (Tothova et al., 2007; Miyamoto et al., 2007).
In neural stem cells (NSC), FoxO family members play a prominent role in proliferation and stem cell renewal (Eijkelenboom and Burgering, 2013). Combined knockout of FoxO1, 3 and 4 in the brain of mice resulted in increased brain size and proliferation of neural progenitor cells during early postnatal life. In adults, the effect was reversed and resulted in a decline of NSC pool. Similar to HSCs, FoxOs regulates genes and pathways that control cellular proliferation, differentiation and oxidative defense by the up-regulation of several cyclins and cyclin dependent kinases (CDKs) and the suppression of p57/KIP2 (Paik et al., 2009).
Together, the data on FoxO function in HSCs and NSCs suggest a general mechanism by which FoxOs mediate self-renewal and stem cell maintenance of adult stem cells through transcriptional regulation of cell cycle arrest and oxidative stress resistance.
1.3.4. FoxO function in the epidermis
The role of FoxOs in epidermal keratinocyte homeostasis is largely unknown.
However, signals crucial for epidermal morphogenesis, such as tumor necrosis factor
α(TNF
α) or Notch can regulate FoxO activity in other tissues (Hu et al., 2004; Hu
and Hung, 2005; Kitamura et al., 2007). In human keratinocytes FoxOs were
implicated in regulating immediate gene activation responses to tumor growth factor-
β1 (TGF-
β1) treatment (Gomis et al., 2006). Interestingly, activation of these target
genes required Smad4 as a co-regulator of FoxOs. Among the FoxO-Smad regulated
genes were stress response genes, including
GADD45A and GADD45B, andadaptive cell signaling response genes, such as JAG1, OVOL1 and CTGF (Gomis et al., 2006). Furthermore, in murine wound healing experiments FoxO1 promoted keratinocyte migration and blocked apoptosis, which is in contrast to other cell types where it inhibits proliferation and induced apoptosis (Eijkelenboom and Burgering, 2013; Ponugoti et al., 2013).
These data thus indicate that FoxOs may integrate multiple upstream signals to differentially regulate proliferation and oxidative stress responses also during epidermal development and homeostasis.
1.3.5. IIS/FoxO in skin pathogenesis
Several insulin/IGF-1 related skin conditions have been described, such as impaired wound healing in type 2 diabetes mellitus, psoriasis and skin cancer, that correlate with and might be due to an altered insulin/IGF-1 function.
Diabetes affects 8.3% (2013) of the population worldwide and more then 80% of that account for type 2 diabetes mellitus (Tamayo et al., 2013). Type 2 diabetes is a result of impaired insulin action and inadequate insulin secretion from the
β-cells of the pancreas. Dermatologic problems are common in type 2 diabetes patients and often involve bacterial skin infections and skin barrier breakdown. These conditions appear to be secondary to multiple factors, including poor microvasculature, peripheral neuropathy and the decreased immune response (Ahmed and Goldstein, 2006).
Some of these factors may also contribute to impaired wound healing, which is the
major characteristic of diabetic skin complications with an incidence of about 15% of
all diabetic patients (Faglia et al., 2001). These wound closure problems can lead to
severe ulcerations, diabetic foot and ultimately to amputations. However, the role of
IR/IGF-1R signaling in diabetes-associated wound healing problems in the skin is not
clear. In a well-characterized mouse model of obese mice (Ob/Ob mice) that ultimately develop diabetes severe impairment of insulin signaling in the skin was observed in wound healing experiments (Goren et al., 2006). Accordingly, conditional overexpression of the insulin relative IGF-1 in murine keratinocytes accelerated wound closure (Semenova et al., 2008), suggesting the involvement of skin IIS in these processes.
Insulin resistance in diabetes can compromise negative regulation of FoxOs. This has been observed in various tissues and cell types in connection with diabetes, such as liver, pancreas and adipose tissue (Nakae et al., 2008). However, the role of FoxOs in diabetic skin complications is unknown. Interestingly, conditional inactivation of FoxO1 in murine epidermis altered wound closure, suggesting a promoting role for FoxO in tissue regeneration. Surprisingly, FoxO regulated keratinocyte migration by up-regulation of TGF-β1 signaling (Ponugoti et al., 2013).
Psoriasis, a common, chronic skin disease that affects approximately 2% of the
population is another skin disease associated with impaired insulin function
(Christophers, 2001). Around 85-90% of these patients suffer from the most common
variant psoriasis vulgaris (Griffiths and Barker, 2007). One main feature of this
disease are scales, which are the result of a hyper-proliferative epidermis with
premature keratinocytes and incomplete cornification with retention of nuclei in the
stratum corneum (Nestle et al., 2009) resulting in skin barrier impairment. This incombination with dermal inflammatory infiltrate, which consists mainly of dendritic
cells, macrophages and neutrophils, contributes to the overall thickness of psoriatic
lesions (Nestle et al., 2009). Population based studies have shown that psoriasis is
linked to diabetes mellitus and insulin resistance (Takahashi and Iizuka, 2012). How
both conditions are linked is still not completely understood. One recent study
suggested the involvement of inflammatory cytokine interleukin 1
β(IL-1
β). IL-1
βis
present in high quantities in psoriatic lesions and was suggested to induce insulin resistance through p38MAPK (mitogen-activated protein kinase) signaling resulting in a block of insulin-dependent differentiation of keratinocytes (Buerger et al., 2012). In addition, IGF-1, secreted by dermal fibroblasts, may contribute to the epidermal hyperplasia of psoriasis by promoting keratinocyte proliferation (Krane et al., 1992;
Miura et al., 2000). In line with this, targeting the IGF-1R by oligonucleotide interference reduced epidermal hyperproliferation in psoriasis (Wraight et al., 2000).
Additionally, several downstream signaling targets of insulin/IGF-1 have been studied in the context of psoriasis. The PI3K/Akt axis e.g. was proposed to activate the anti- apoptotic nuclear factor-κ B signaling cascade and inhibits pro-apoptotic Bcl2- associated death promoter (BAD) signaling in keratinocytes, which contributes to the thickening of psoriatic skin (Madonna et al., 2012). Although the functional role for FoxOs in psoriasis is not known, pathways that have been demonstrated to regulate FoxO activity are essential for psoriasis pathogenesis, such as TNF receptor signaling, suggesting potential involvement of FoxOs (Hu and Hung, 2005; Hu et al., 2004; Kitamura et al., 2007; Kumari et al., 2013).
Moreover, insulin/IGF-1 and FoxO have been shown to be crucial regulators of
carcinogenesis and tumor growth (Pollak, 2008; Kloet and Burgering, 2011), which
indicate also a role in epidermal cancers, such as basal cell carcinoma and
squamous cell carcinoma. Overall this pathway might thus be a promising candidate
for potential therapies of skin diseases, such as diabetic wound problems, psoriasis
and skin cancer, even though the precise role of IIS regulated FoxOs in these
conditions is not fully understood.
1.3.6. IIS regulates epidermal thickness and proliferative potential
In addition to circulating insulin and IGF-1, dermal fibroblasts are the major source of IGF-1 in the skin. Epidermal keratinocytes express both receptors, the IR and the IGF-1R, but they do not produce insulin or IGF-1 ligands (Misra et al., 1986;
Verrando and Ortonne, 1984; Wertheimer et al., 2000). In the skin, dermal fibroblasts secret IGF-1 and insulin and thereby could support keratinocyte proliferation.
Interestingly, IGF-1R
-/-mice had an abnormal thin skin with translucent epidermis, indicating a role for IGF-1 signaling in epidermal development (Liu et al., 1993).
Consistently, the combined deletion of Akt1 and Akt2, the main downstream targets of the IIS pathway, also resulted in a hypoplastic skin phenotype (Peng et al., 2003).
In contrast, IR
-/-mice showed no obvious skin phenotype, suggesting that IR signaling does not directly contribute to epidermal morphogenesis and homeostasis.
In summary, these data suggested a putative role for IIS in skin development primarily through IGF-1R action.
To test whether cell autonomous IIS regulates epidermal morphogenesis, conditional epidermal IR
epi-/-and IGF-1R
epi-/-mice were generated by K14-Cre driven inactivation (Stachelscheid et al., 2008). Investigation of these mice revealed that IR
epi-/-mice were viable, showed no obvious macroscopic phenotype and developed normally to adulthood. In contrast, the loss of IGF-1R resulted in newborn mice with thin translucent skin and reduced survival rate (60% viable). In addition, the surviving IGF-1R
epi-/-mice maintained a thinner epidermis throughout lifetime and showed occasional hair loss. Most interestingly, the simultaneous deletion of IR and IGF-1R (dko
epi) resulted in an even more severe phenotype and perinatal lethality due to a major barrier defect resulting in dehydration (Stachelscheid et al., 2008).
Histological investigation of these three different knockout mice revealed that
although they have a normal macroscopic appearance, there was a slightly
decreased epidermal thickness in the IR
epi-/-mice compared to control. This reduction in suprabasal layers was much more severe in the IGF-1R
epi-/-mice and most severe in the dko
epimice (Fig. 8A) (Stachelscheid et al., 2008). These results indicate an essential, non-redundant role for IIS during epidermal morphogenesis and furthermore show that IGF-1R is the major regulator of this signaling pathway in the epidermis.
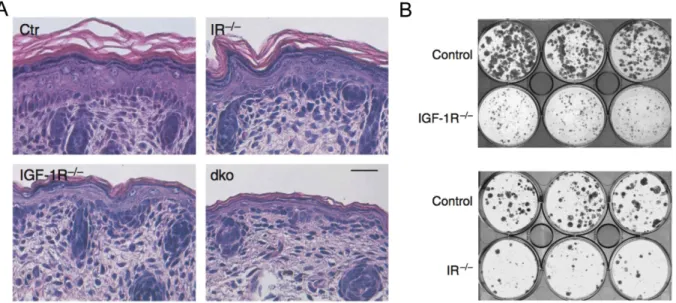
Figure 8: IIS regulates epidermal thickness and proliferative potential. (A) H&E staining of ctr,
IRepi-/-, IGF-1Repi-/- and dkoepi newborn mice show decreased epidermal thickness. (B) CFA with
primary murine IRepi-/- and IGF-1Repi-/- keratinocytes indicate loss of proliferative potential in upon loss of IIS (adapted from Stachelscheid et al., 2008).
Interestingly, overall differentiation of the keratinocytes in the IGF-1R
epi-/-and the dko
epimice did not seem to be obviously impaired as the localization of markers for the different layers K14, K10 and loricrin was not altered (Stachelscheid et al., 2008).
As IIS can promote cell survival through Akt activation, increased cell death could
explain the loss of keratinocytes in the epidermis. However, apoptosis was not
changed upon loss of IIS. Ki67 staining also revealed no obvious change in
proliferation of newborn IGF-1R
epi-/-and dko
epiepidermis compared to control
epidermis. This was remarkable as keratinocytes isolated from IGF-1R
epi-/-mice were growth impaired and displayed a severe loss of proliferative potential in cell culture conditions, as assessed by colony-forming assays (CFA) (Fig. 8B). In CFAs colony- size signifies the number of cell division each cell can undergo (Izumi et al., 2007).
The largest colonies are thought to represent stem cell like progenitor cells with high proliferative potential (Izumi et al., 2007). This suggested that in the epidermis the reduction of suprabasal cells was indirectly caused by a decrease in progenitor cells.
In line, progenitor markers, such as Keratin 15 (K15) and IGF-binding protein 5 (Igfbp5), were down regulated upon loss of IIS
in vivo (Stachelscheid et al., 2008).The hypomorphic epidermis and the loss of the proliferative potential were partially rescued by expression of constitutive active Rac1. Thus, IIS to regulates proliferative potential and epidermal morphogenesis through the small GTPase Rac (Stachelscheid et al., 2008).
The question remained how IIS promotes proliferative potential and how an altered
proliferative potential resulted in a loss of suprabasal layers. Further analysis of
different embryonic stages of these mice showed that the hypoplastic epidermis was
first obvious at E16.5 (Fig. 9A), which is the developmental stage when there is a
strong increase in number of suprabasal layers. Surprisingly, Ki67 labeling did not
reveal any changes in proliferation at this stage, similar to what was observed in
newborn mice. However, one day later at E17.5 Ki67 staining was reduced. As Ki67
is expressed in all stages of the cell cycle, it may not detect either a G2/M or mitotic
arrest at E16.5. Quantification of the number of anaphase spindles at E16.5 revealed
a decrease of cells in anaphase at E16.5 in the epidermis (Fig. 9B). Interestingly, this
decrease was in agreement with the severity of the phenotype with dko
epimice
having the strongest reduction in anaphase divisions. Further analysis showed an
increase of cells in metaphase spindles in E16.5 dko
epiepidermis and IGF-1R
epi-/-keratinocytes concomitant with a decrease in anaphase stage, thus indicating a mitotic checkpoint arrest (Fig. 9C). This was associated with altered expression of regulators of cell cycle progression in keratinocytes, such as Mdm2, 14-3-3σ, Ccng1 and p63 in the epidermis of newborn dko
epimice.
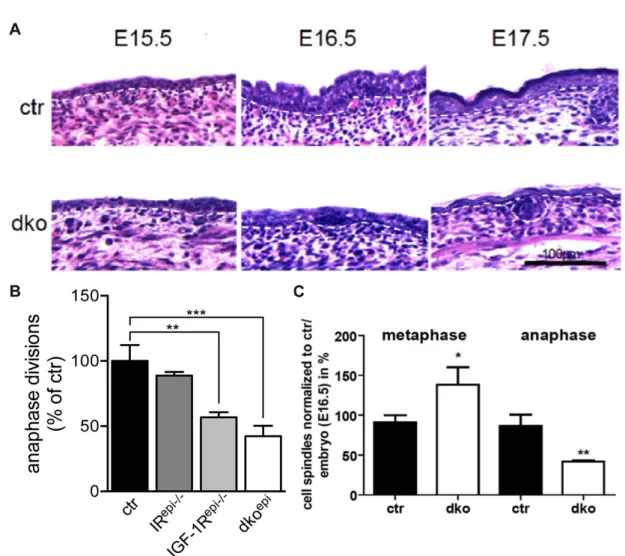
Figure 9: IIS regulates cell cycle progression at E16.5. (A) H&E staining of embryonic ctr and dkoepi epidermis show first appearance of hypomorphic epidermis at E16.5. (B) Less anaphase cell division upon loss of IR, IGF-1R or both (dkoepi) in E16.5 epidermis. (C) Quantification of metaphase and anaphase divisions in E16.5 dkoepi epidermis reveal a mitotic block (adapted from the PhD thesis of Heike Stachelscheid 2010).