1
Indian hedgehog function in skin development and tumour formation
Inaugural-Dissertation zur
Erlangung des Doktorgrades
der Mathematisch-Naturwissenschaftlichen Fakultät der Universität zu Köln
vorgelegt von
Parisa Kakanj
aus Teheran
Köln 2011
2
Berichterstatter/in: Prof. Dr. med. Jens C. Brüning Prof. Dr. rer. nat. Carien M. Niessen
Vorsitzender: Pof. Dr. rer. nat. Martin Hülskamp Schriftführerin: Dr. rer. nat. Catherin Niemann
Tag der mündlichen Prüfung: 28.06.2011
3
To my beloved parents
ﻢﻳﺪﻘﺗ ﻪﺑ ﺭﺩﺎﻣ ﻭ ﺭﺪﭘ ﻡﺰﻳﺰﻋ
ﺎﺑ
ﻖﺸﻋ
ﻭ
ﻡﺍﺮﺘﺣﺍ
ﯽﺒﻠﻗ
4
“The pipette is my clarinet.”
Max Delbrück (1970)
5
Table of contents
6
Table of contents
1 Abbreviations... 13
2 Abstract... 17
2.1 Zusammenfassung... 18
3 Introduction... 19
3.1 Hedgehog (Hh) signalling... 19
3.1.1 Mechanisms of Hh signal transduction in mammalian tissues... 19
3.1.2 Expression and function of Hh ligands during mammalian development... 22
3.2 Structure and function of mammalian skin... 23
3.3 Hedgehog signalling during skin development and regeneration... 26
3.4 Ihh signalling during epidermal development... 27
3.5 Hh signalling in skin cancer... 29
3.5.1 Hh signalling activity in sebaceous tumours... 31
3.5.2 Hh signalling and p53... 31
3.6 Aims of this study... 35
4 Materials and Methods... 36
4.1 Materials... 36
4.1.1 Chemicals, solvents, media and additives... 36
4.1.2 Kits, devices and accessories... 38
4.1.3 Media, solutions and buffers... 40
4.2 Mice... 44
4.2.1 Tumour studies in K14ΔNLef1 transgenic mice... 44
4.2.2 Two-stage skin carcinogenesis experiment... 45
4.3 Molecular Biology... 47
4.3.1 Genotyping and efficiency of deletion... 47
4.3.2 Isolation of genomic DNA (gDNA)... 47
Table of contents
7
4.3.3 Polymerase Chain Reaction (PCR) for genotyping... 47
4.3.4 PCR anaylsis for efficiency of deletion... 48
4.3.5 DNA sequencing... 49
4.4 Protein biochemical methods... 49
4.4.1 Protein extraction from skin and skin tumours... 49
4.4.2 Protein quantification by Biuret protein assay... 50
4.4.3 SDS-polyacrylamide-gel-electrophoresis (SDS-PAGE)... 51
4.4.4 Western blot analysis (WB)... 52
4.4.5 Membrane stripping to detect housekeeping proteins... 52
4.5 Tissue Analysis... 53
4.5.1 Preparation of whole mount tail skin (WM)... 54
4.5.2 Isolation and cultivation of primary keratinocytes... 54
4.5.3 Passaging of primary keratinocytes... 54
4.5.4 Cell number determination of (by CASY Counter)... 55
4.6. Histological analysis... 55
4.6.1 Sectioning... 55
4.6.2 Deparaffining of paraffin sections... 56
4.6.3 Haematoxylin-Eosin (H&E) staining... 56
4.6.4 Immunofluorescence (IF)... 56
4.6.4.1 IF staining with Paraffin embedded sections... 56
4.6.4.2 IF staining of frozen sections... 57
4.6.4.3 IF staining using anti-Lrig antibody... 57
4.6.4.4 IF staining using anti-Plet1 and -SCD1 antibody... 58
4.6.4.5 IF staining of paraffin sections using anti-K6a and -SCD1 antibodies. 58 4.6.4.6 IF staining of paraffin sections using anti-BrdU and -K14 antibody.... 59
4.6.4.7 IF staining of paraffin sections using anti-BrdU and –K6 antibody... 59
4.6.4.8 IF staining of Whole Mount (WM) tissue... 60
4.6.4.9 IF staining of cells... 60
4.6.4.10 IF staining of cells with anti-BrdU antibody... 61
4.6.4.11 TUNEL assay... 61
4.9 Statistical Methods... 63
Table of contents
8
4.10 Computer programs and data bases... 63
5 Results... 64
5.1 Generation of epidermal specific Ihh knockout mice (Ihh EKO)... 64
5.2 Analysis of the skin phenotype of Ihh EKO mice... 68
5.2.1 Analysis skin morphology of Ihh EKO mice... 68
5.2.2 Sebocyte differentiation is not altered in Ihh EKO mice... 70
5.2.3 Ihh stimulates epidermal proliferation in neonatal mice... 72
5.2.4 Ihh regulates epidermal proliferation by keratinocyte-intrinsic Signalling... 74
5.3 The function of Ihh signalling for skin tumorigenesis... 76
5.3.1 The function of Ihh signalling during sebaceous tumour development... 76
5.3.1.1 Ihh does not affect incidence and frequency of sebaceous tumours but represses tumour growth... 77
5.3.1.2 Ihh promotes sebocyte and sebaceous duct fate differentiation in tumours of K14∆NLef1 mice... 79
5.3.1.3 Altered differentiation of tumour cells upon loss of Ihh... 85
5.3.1.4 Ihh controls the number of progenitor cells in sebaceous tumours.. 87
5.3.1.5 Ihh induces proliferation in sebaceous tumours... 90
5.3.2 The function of Ihh signaling for development of papilloma and progression of squamous cell carcinoma (SCC)... 92
5.3.2.1 Ihh reduces the incidence and frequency of papilloma and promotes tumour growth... 94
5.3.2.2 Increase in progression of benign papilloma into malignant carcinoma in Ihh EKO mice... 96
5.3.2.3 Metastasis of SCC in Ihh EKO mice... 99
5.3.2.4 Ihh stimulates proliferation in papilloma... 100
5.4 Molecular mechanisms of Ihh signalling in skin tumours and normal skin... 102
Table of contents
9 5.4.1 Ihh regulates p53 nuclear accumulation in benign squamous
Papilloma... 102
5.4.2 Ihh regulates p53 in sebaceouse tumours... 104
5.4.3 Ihh regulates p53 during epidermal morphogenesis... 105
6 Discussion... 107
6.1 The role of Ihh during epidermal differentiation... 108
6.2 A role of Ihh in controlling epidermal cell divisions... 111
6.3 Ihh controls p53 nuclear accumulation... 114
6.4 Open questions and outlook... 116
7 Reference... 117
8 Acknowledgements... 134
9 Erklärung... 135
10 Curriculum Vitae... 136
Figure index
10
Figure index
Figure 1: Scheme of the Hh pathway in vertebrates and mammals 21 Figure 2: Temporal control of Hh expression and function during mammalian
development 22
Figure 3: Skin morphology and structure of the interfollicular epidermis (IFE) 24
Figure 4: Structure of the pilosebaceous unit 25
Figure 5: Expression pattern of Shh and Hh pathway components during HF
morphogenesis and hair regeneration 26
Figure 6: Expression of Ihh and Gli1 in the SG of mouse skin 27 Figure 7: Modification of SG formation in transgenic mouse models 28 Figure 8: Schematic view of sebaceous tumour development. 33 Figure 9: Standard curve for determining unknown protein concentrations 51 Figure 10: Generation of epidermal specific Indian hedgehog knockout mice (Ihh EKO) 66 Figure 11: High efficiency of Ihh deletion in primary keratinocytes 67 Figure 12: No morphological abnormalities in back and tail skin during
postnatal development (P0-P9) of Ihh EKO mice 69
Figure 13: SG morphogenesis and differentiation is not altered in the
absence of epidermal Ihh 71
Figure 14: Reduced epidermal cell proliferation in the absence of Ihh
during skin development 72
Figure 15: Reduced cellular proliferation in the IFE of neonatal Ihh EKO mice 73 Figure 16: Ihh is required for proliferation in vitro 75 Figure 17: Scheme of tumour induction in K14∆NLef1 mice 77 Figure 18: Repression of sebaceous tumour size in the presence of Ihh 78 Figure 19: Reduced differentiation into sebocytes in tumours of
K14∆NLef1/Ihh EKO mice 80
Figure 20: Decreased sebocyte differentiation in tumours of
K14∆NLef1/Ihh EKO mice 82
Figure 21: Ihh promotes differentiation of sebaceous duct fate in
sebaceous tumours 83
Figure 22: Analysis of proliferation in K6a positive tumour cells 84
Figure 23: Altered differentiation of tumour cells in K14∆NLef1/Ihh EKO mice 86
Figure index
11 Figure 24: Expression of Lrig1 is altered in tumours of K14∆NLef1/Ihh EKO 88 Figure 25: Increased Plet1 positive tumour cells in K14∆NLef1/Ihh EKO mice 89 Figure 26: Reduced proliferation in sebaceous tumours of
K14∆NLef1/Ihh EKO mice 91
Figure 27: Scheme of a two-stage skin carcinogenesis experiment 93 Figure 28: Ihh suppresses incidence and frequency of papilloma but
increases tumour size 95
Figure 29: Increased tumour progression into SCC in Ihh EKO mice 96 Figure 30: Reduced K10 expression in squamous tumours and increased
progression to SCC in Ihh EKO mice 98
Figure 31: Ihh suppresses the metastasis of SCC 99
Figure 32: Reduced proliferation in squamous tumours of Ihh EKO mice 101 Figure 33: p53 positive cell numbers are altered in papilloma of Ihh EKO mice 103 Figure 34: Ihh affects the level of p53 protein in sebaceous tumours 104 Figure 35: Stimulation of nuclear accumulation of p53 in the epidermis of
Ihh EKO mice 106
Figure 36: Hh ligand expression in the colonic crypt and the
pilosebaceous unit 109
Figure 37: Regulation of p53 by Ihh signalling in sebabeous tumours 115
Table index
12
Table index
Table 1: Mouse models with Hh-dependent SG malformation 29 Table 2: Mouse models with Hh-dependent skin tumours 30
Table 3: Chemicals and Reagents 36
Table 4: Kits 38
Table 5: Devices and accessories 38
Table 6: Mice used in this studies 46
Table 7: Mice used in this studies, first set of tumour experiment 46 Table 8: Mice used in this studies, second set of tumour experiment 46
Table 9: Oligonucleotides used for genotyping 48
Table 10: Oligonucleotides used in PCR analysis for efficiency of deletion 49
Table 11: Primary antibodies used for WB 53
Table 12: Secondary antibodies used for WB 53
Table 13: Primary antibodies used for IF 62
Table 14: Secondary antibodies used for IF 62
Table 15: Programs and data bases 63
Abbreviation
13
1 Abbreviations
A adenine
Ab antibody
B bulge
BCA bicinchonic acid BCC basal cell carcinoma BL basal layer
BM basement membrane
BMP Bone Morphogenetic Protein BP base pairs
BrdU Bromodeoxyuridine (5-bromo-2'-deoxyuridine) BSA bovine serum albumin
°C degree Celsius cDNA complementary DNA CL cornified layer
c-Myc cellular myelo cytomatosis oncogene CO2 carbon dioxide
Cre site specific recombinase from phage P1 (causes recombination) CS Cockayne syndromeb
DAPI 4`6-Diamidino-2-phenylindol DE dermis
Dhh Desert hedgehog
DMBA 7,12-dimethylbenz-[a]-anthracene DMEM Dulbecco`s modified Eagle’s Medium DMSO dimethylsulfoxide
DNA deoxyribonucleic acid DP dermal papilla
DSB double stand breaks E embryonic day
ECL enhanced chemiluminescence ECM extracellular matrix
Abbreviation
14 EDTA ethylene diamine tetra acetic acid
EGF epidermal growth factor EtOH ethanol
FACS fluorescence activated cell sorting FCS fetal calf serum
Ihh Indian hedgehog
Ihh EKO epidermal specific Ihh knockout
g gram
GFP green fluorescent protein GL Granular layer
Gli glioma-associated oncogene homolog GSK3 Glycogen synthase kinase 3
GTP Guanosintriphosphat
H hours
HCL hydrochloric acid H&E hematoxylin-eosin HF hair follicle
HG hair germ Hh Hedgehog
HR homologous recombination HRP horse radish peroxidase Hz hertz
IF immunofluorescent IFE interfollicular epidermis IRS inner root sheath IU international unit IZ isthmus zone JZ junctional zone
K keratin
K6a keratin 6a K10 keratin 10 K14 keratin 14
Abbreviation
15 kDa kilo Dalton
Ki67 Kiel 67 (university of Kiel) KO knockout
Lef1 Lymphoid enhancer-binding factor 1 LRC label retaining cells
M Mol
mAB monoclonal antibody Mdm2 Murine double minute 2 μg micro geram
mg milligram min minute μl micro liter ml milliliter μm micro molar mM millimolar mRNA messenger RNA MZ mature sebocytes
n nano
NER nucleotide excision repair Ng nanogram
NGS normal goat serum nm nanometer
NP-40 nonidet P-40 ORS outer root sheat P postnatal day
PAGE polyacrylamide gel electrophoresis PAP papilloma
PBS phosphate buffered saline PCR polymerase chain reaction
PDK1 phosphoinositide-dependent protein kinase 1 PFA paraformaldehyde
PI propidium iodide
Abbreviation
16 PI3K phosphatidylinositol 3 kinase
PKA protein kinase A Ptch patched
RNA ribonucleic acid RNAi RNA interference Rpm rounds per minute SC stem cell
SDS sodium dodecyl sulphate Sec seconds
Ser Serine
SG sebaceous gland Shh Sonic hedgehog SL Spinous layer s-Me s-mercaptoethanol Smo smoothened
Sufu Suppressor of Fused
TAE Tris-acetic acid-EDTA-buffer TBS tris buffered saline
TE Tris-EDTA buffered TF Transcription factor Tg Transgenic
TPA 12-O-Tetradecanoylphorbol-13-acetat
U unit
UV ultraviolet
V volt
vs. versus
v/v volume/volume WB western blot WM whole mounts Wt wild-type
w/v weight per volume XP Xeroderma pigmentos
Abstract
17
2 Abstract
The Hedgehog (Hh) signalling pathway plays an essential role during mammalian skin development and epidermal regeneration. Out of the three mammalian Hh homologs, Sonic hedgehog (Shh) is the best characterised Hh ligand in the skin. Shh is expressed during hair morphogenesis and is required for hair follicle formation and cyclic hair regeneration.
Mutations in Shh and other components of the Hh pathway result in skin abnormalities and tumour formation, e.g. Basal Cell Carcinoma (BCC), the most common cancer in humans.
Indian hedgehog (Ihh) is expressed in the sebaceous gland (SG), a hair follicle associated epidermal appendage, which secretes sebum to lubricate and protect the skin. However, an in vivo function for Ihh has not been identified in the skin. In vitro studies indicated that components of the Hh pathway are up-regulated and activity of the pathway is increased upon differentiation of human sebocytes. Furthermore, it was shown that activation of Hh signalling in basal keratinocytes promotes ectopic SG and sebaceous duct formation. Analysis of sebaceous tumours in mouse models and in humans demonstrated expression of Ihh in mature tumour cells. These observations led to the hypothesis that Ihh could be an important factor regulating differentiation and tumour formation in the skin. To address these issues, an epidermis-specific Ihh knockout (Ihh EKO) was generated. The absence of epidermal Ihh significantly inhibits proliferation in early skin development however; morphogenesis of SGs, hair follicles and the interfollicular epidermis was not altered. Importantly, a function of Ihh for tumourigenesis was identified. In particular, Ihh increases the size of tumours and induces SG and sebaceous duct fate differentiation and this was accompanied by a reduced number of follicular progenitors. In addition, Ihh signalling promoted proliferation and regulated p53 in squamous epidermal tumours. The results indicate that regulation of p53 constitutes a general function of Ihh in keratinocytes and that Ihh plays an important role in patho- physiological conditions of the skin.
Zusammenfassung
18
2.1 Zusammenfassung
Der Hedgehog (Hh) Signalweg spielt für die Entwicklung und Regeneration der Haut der Säugetiere eine wichtige Rolle. Unter den drei Hh Liganden, Sonic Hedgehog (Shh), Indian Hedgehog (Ihh) und Dessert Hedgehog (Dhh), ist die Rolle von Shh am besten untersucht.
Shh wird im wachsenden Haarfollikel exprimiert, wo es während der Haarfollikelbildung und der zyklischen Regeneration des Haares inbesondere die Proliferation der Keratinozyten kontrolliert. Die Aktivierung des Signalweges, z.B. durch Mutationen in dem Rezeptor Patched, führt zu Störungen der Hautentwicklung und zu Tumoren, unter denen das Basalzellkarzinom (BCC) die am häufigsten auftretende menschliche Krebserkrankung darstellt. Der Ligand Ihh wird in der Talgdrüse exprimiert, die häufig mit dem Haarfollikel assoziiert vorliegt. Bisher ist über die Funktion von Ihh in der Haut wenig bekannt. In vitro Studien zeigten, dass während der Differenzierung humaner Sebozyten die Expression von Komponten und die Aktivität des Hh Signalwegs erhöht sind. Eine Aktivierung des Hh Signalwegs in der Basalschicht der Epidermis führt zur Bildung ektopischer Talgdrüsen und Talgdrüsengänge. Die Analyse von Talgdrüsentumoren beim Menschen und der Maus zeigt, dass Ptch1 und Gli1 erhöht exprimiert sind, was darauf hinweist, dass der Hh Siganlweg in diesen Tumoren aktiviert ist. Ihh wird in Talgdrüsentumoren ebenfalls stark expimiert, wohingegen Shh und Dhh nicht detektierbar sind. Diese Beobachtungen führten zur Hypothese, dass Ihh für die Proliferation, Differenzierung und Tumorbildung in der Haut von großer Bedeutung ist. Um die Funktion von Ihh in der Haut zu untersuchen, wurden Mäuse generiert, in denen Ihh spezifisch im Epithel der Haut ausgeschaltet wurde (Ihh EKO). Der Verlust von Ihh in der Haut führt zwar zu einer verringerten Proliferation in der Epidermis von jungen Tieren, jedoch wurden keine offensichtlichen morphologischen Defekte beobachtet. Im Gegensatz dazu führt der Verlust von Ihh zu reduzierter Proliferation und zu veränderter Differenzierung in Talgdrüsentumoren. In Plattenephitelkarzinomen waren in Ihh EKO Mäusen ebenfalls die Proliferation und Differenzierung der Kerationzyten deutlich verändert. Des Weiteren führt der Verlust von Ihh in der normalen Haut als auch in Tumoren zu einer nuklearen Akkumulation von p53. Die Daten zeigen deutlich, daß Ihh neben der Regulation der Differenzierung von Sebozyten eine wichtige Funktion in der Kontrolle von Proliferation und p53 Aktivität der Haut hat.
Introduction
19
3 Introduction
Genetic studies have revealed that a small number of evolutionarily conserved pathways are used repeatedly in different contexts to control many cell fate decisions in all animals during their development. These include: the Bone morphogenetic protein (Bmp), Wnt, receptor tyrosine kinase, Notch and Hedgehog (Hh) pathways (Huangfu and Anderson, 2006). However, gene duplications and the increase of organism complexity during evolution led to increased numbers of pathway components and their divergent functions.
3.1 Hedgehog (Hh) signalling
The Hh signalling cascade is one of the key pathways for mammalian development. The Hh gene was first identified in a Drosophila genetic screening by Christiane Nüsslein-Volhard and Eric Wieschaus in 1980 and was observed to be important for embryonic segmentation and imaginal discs specifications in Drosophila (Nüsslein-Volhard and Erik Wieschaus, 1980; Basler and Struhl, 1994; Mohler, 1988; Tabata et al., 1992). Hh is conserved from insects to mammals and has been studied in greatest depth in Drosophila, in which forward genetic screens allowed identification of various components of the Hh signalling pathway (Hooper and Scott, 2005; Huangfu and Anderson, 2006). However, recent genetic studies have defined a surprisingly large number of proteins required for Hh signalling in vertebrates and mammals that have no apparent role in Drosophila Hh signalling.
3.1.1 Mechanisms of Hh signal transduction in mammalian tissues
Vertebrate Hh genes were first reported in 1993 across different species (fish, chick and mouse) by several groups (Echelard et al., 1993; Krauss et al., 1993; Riddle et al., 1993; Chang et al., 1994; Roelink etal., 1994). The obvious difference between invertebrates and vertebrates is that the genes encoding the specific Hh pathway components have been duplicated during vertebrate evolution (Kumar et al., 1994, Meyer and Schartl, 1999; Mazet
Introduction
20 and Shimeld, 2002). Three Hh homologs, Sonic hedgehog (Shh), Indian hedgehog (Ihh) and Desert hedgehog (Dhh) have been identified in mammals. Dhh is most closely related to the Drosophila Hh protein and regulates spermatogenesis whereas Shh and Ihh are more closely related to each other (90% amino acid identity) than to Dhh (80% amino acid identity). Shh and Ihh also play essential roles during embryonic development (Echelard et al., 1993). All three Hh proteins are synthesized as a precursor of ∼45-kDa which undergoes auto-processing to generate a ∼19-kDa amino-terminal fragment (Hh-N). The Hh-N fragment is activated after two post-translational modifications: covalent attachment of a cholesterol moiety to the carboxy-terminus and palmitoylation at the amino-terminus (Lee et al., 1994; Porter et al., 1995; Porter et al., 1996; Li et al., 2006; Li et al., 2011). These lipid modifications are crucial and contribute to the mobility and full signalling capacity of Hh proteins (Lewis et al., 2001;
Chen et al., 2004).
Secretion of Hh ligands induces various effects dependent on the cellular context. Hh can act as an on-off switch that regulates the fate of immediately adjacent cells. Alternatively, Hh can act as short-range morphogen over a distance of around 10-15 cell diameters or as long-range morphogen spanning over more than 100 cell diameters (Ingham and Hidalgo, 1993, Stone et al., 1996; Strigini and Cohen, 1997; Huangfu and Anderson, 2006). The Hh signalling cascade is initiated upon binding of a Hh ligand to its receptor Patched (Ptch), a protein with 12- transmembrane spanning domains (Fig. 1). There are two Ptch homologs in mice, Ptch1 and Ptch2. Ptch1 and Ptch2 are differentially expressed during development suggesting specific roles for each protein. Ptch1 is more widely expressed during embryonic development and in mouse and human it is known as a tumour suppressor. The function of Ptch2 however has not been fully clarified inspite of loss-of-function studies. A recent study suggests that Ptch2 may also act as a Hh receptor and modulates signalling in various cellular environments (Smyth et al., 1999; Rahnama et al., 2004, Lee et al., 2006; Eriken Nieunenhuis???).
Smoothened (Smo) a 7-transmembrane spanning protein is repressed by Ptch1 in the absence of the Hh-ligand. In the presence of high levels of Hh ligand, Ptch1 inhibition is released and Smo transduces the signal to the downstream Glioma-associated family of zinc finger transcription factors Gli1, Gli2 and Gli3. The precise mechanism by which Smo activates this cascade remains unclear. It is known that a conformational change of Smo protein and its translocation to the primary cilium are the two critical events for activation of the Hh pathway
Introduction
21
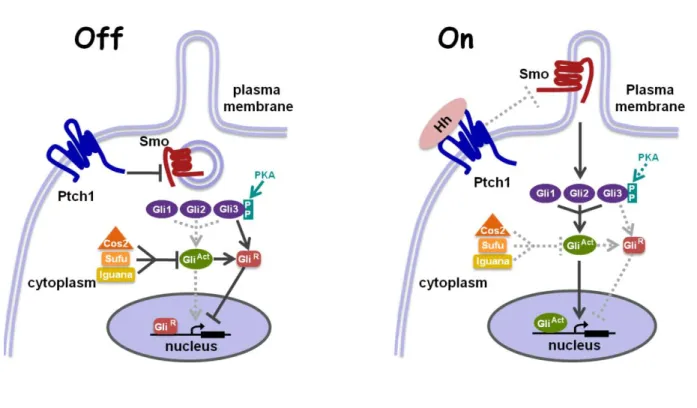
Figure 1: Scheme of the Hh pathway in vertebrates and mammals.
In the absence of Hh ligand (left) Ptch1 represses the transmembrane protein Smo; preventing the accumulation of Smo in cilia and turning off downstream signalling. Activation of Gli transcription factors is inhibited by a group of proteins: Sufu, Iguana (for zebrafish) and Cos2. Gli2 and Gli3 are processed (phosphorylated and cleaved) into a repressor form (GliR) in a cilia-dependent manner. The short form of Gli (GliR) accumulates in the nucleus and represses the transcription of target genes. In the presence of high levels of Hh ligand (right), Ptch1 inhibition is released; Smo is recruited to cilia and activates Gli proteins. The Gli proteins are no longer cleaved and full length Glis activate the transcription of Hh-target genes. Ptch1 (Patched1), Smo (Smoothened), Gli (Glioma-associated family of transcription factors), Sufu (Suppressor of Fused), p (phosphorylation), PKA (protein kinase A).
(Modified after Huangfu and Anderson, 2006)
in vertebrates (Zhao et al., 2007; Taipale et al., 2002). Smo controls both the activation of Gli transcription factors and the proteolytic processing event that generates a repressor form of Gli. However, this does not occur for all Gli proteins (Huangfu and Anderson, 2006). Gli3 and Gli2 are bifunctional and can be processed into a repressor or a transcriptional activator (Wang et al., 2000; Aza-Blanc et al., 2000). Gli1 cannot be proteolytically processed and is solely a transcriptional activator (Dai et al., 1999; Lee et al., 1997; Ruiz i Altaba, 1998). The three Gli proteins are characterised by a homologous zinc finger domain and have limited homology outside this region (Matise and Joyner 1999). Upon activation of the Hh pathway, the active form of the Glis (GliAct) induces the expression of target genes including Ptch1 and Gli1, which provide a negative (Ptch1) and a positive (Gli1) feedback for Hh signalling (Ruiz i Altaba et al., 2007; Wang et al., 2000; Pan et al., 2006; Litingtung et al., 2002; Bai et al., 2004).
Introduction
22
3.1.2 Expression and function of Hh ligands during mammalian development
Hh ligands act as morphogens and regulate multiple developmental processes (Fig. 2). All mammalian Hh ligands have similar signalling capacities but exert different roles during development due to their diverse expression patterns (Ingham and McMahon, 2001;
McMahon et al., 2003; Sagai et al., 2005; Varjosalo and Taipale, 2008).
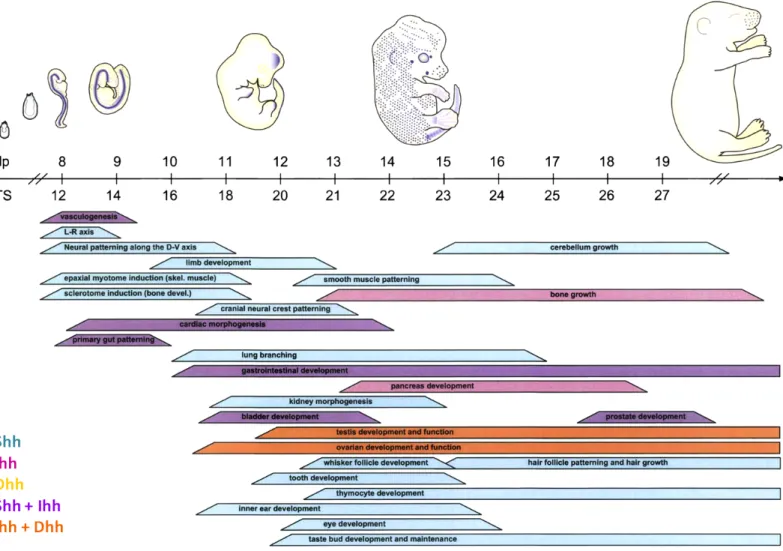
Figure 2: Temporal control of Hh expression and function during mammalian development.
(Top) Embryo cartoons show regions of the Hh target gene expression depicted by the embryos. Ptch1 (blue) during mouse embryonic development. (Bottom) Bars show approximate embryonic stages when Shh, Ihh, and/or Dhh (color code in bottom left) control developmental processes in the indicated tissues or cell types. The embryonic stage is indicated by postcoital (dpc) (Varjosalo and Taipale, 2008; Ingham and McMahon, 2001).
Introduction
23 Shh, the best characterised Hh ligand, is the most broadly expressed during mammalian development. Shh expression has been detected in the notochord, floor plate, limbs and many other developing organs (Huangfu and Anderson, 2006). Shh is an essential factor for patterning of the dorso-ventral axes as well as for the morphogenesis of different organs (Ingham and McMahon, 2001, McMahon et al., 2003; Varjosalo and Taipale, 2008). In contrast, Dhh expression and function is restricted to the regulation of spermatogenesis and development of the perineural sheath (Bitgood et al. 1996; Parmantier et al., 1996; Yao et al.
2002; Wijgerde et al. 2005). Ihh expression is limited to a few tissues during development, including primitive endoderm (Dyer et al. 2001), gut (Ramalho-Santos et al., 2000; van den Brink 2007) and growth plates of the bones (Vortkamp et al., 1996; St-Jacques et al. 1999, Karp et al., 2000). Importantly, more than one ligand is often expressed in the same tissue and therefore, can act redundantly.
Hh signalling also plays important roles beyond development and controls tissue maintenance and differentiation in adult organs (Varjosalo and Taipale, 2008), for instance in the gastrointestinal tract, pancreas, uterus, mammary gland and skin (St-Jacques et al., 1998; Oro at al. 2002; Ingham and McMahon, 2001; Varjosalo and Taipale, 2008).
3.2 Structure and function of mammalian skin
The skin is the only organ in mammals which is in direct contact with the surrounding milieu and forms an effective barrier between the organism and the environment. Its’ functions are to protect the body against pathogens, UV radiation, chemical and mechanical stress as well as the regulation of temperature, water and electrolyte balance (Wokalek, 1992, Chuong et al., 2002; Blanpain and Fuchs, 2006; Segre 2006). In addition, animals can perceive their environment through the tactile sense of the skin. I and consists of the epidermis, dermis and subcutaneous tissue, the hypodermis (Fig. 3). The subcutis is the fat tissue below the dermis composed of adipocytes (Alberts, 2008; Montagna and Parakkal, 1974). The dermis is a mesenchymal connective tissue, which underlies the epidermis. It is composed of fibroblasts and extracellular matrix (ECM) components (e.g.
talk between dermis and epidermis is important for proliferation and morphogenesis of the
Introduction
24 epidermal compartment. The epidermis, the outer most layer of the skin, is separated by a basement membrane from the dermis and is composed of two major compartments, the interfollicular epidermis (IFE) and the pilosebaceous unit (Fig. 3, 4). The epidermis is a stratified squamous epithelium, composed of several layers. The basal layer of IFE consists of the proliferating and transit amplifying cells giving rise to suprabasal differentiated cells of the spinous, granular, and cornified layer (Fig.3). The pilosebaceous unit is made of hair follicles (HFs) and sebaceous glands (SGs).
Figure 3: Skin morphology and structure of the interfollicular epidermis (IFE).
(A) Haematoxylin- and eosin-stained section of the dorsal skin of an adult mouse demonstrating epidermis (E), dermis (DE), and subcutis (SC). The epidermis consists of different compartments such as the interfollicular epidermis (IFE), Hair follicles (HF), bulge (B) and sebaceous glands (SG) (B) The IFE is composed of different layers: basal layer (BL), spinous layer (SL), granular layer (GL) and cornified layer (CL) (Niemann and Watt, 2002;
modified after Fuchs and Raghavan, 2002).
The HF is composed of the outer root sheath (ORS), companion layer, inner root sheath (IRS), hair shaft and the rapidly proliferating matrix cells in the hair bulb, which give rise to the different hair lineages (Fig. 4) (Niemann and Watt, 2002; Blanpain and Fuchs, 2006;
Shimomura and Christiano, 2010). Continuous renewal of the HF throughout life requires multipotential SC. The best characterised Hair follicle stem cell (HFSC) compartment is the bulge region which is established within the permanent part of the HF (Nowak et al., 2008).
The SG is an epidermal appendage associated with HFs. The SG consists of an undifferentiated
Introduction
25 layer of keratinocytes at the periphery of the gland and differentiated sebocytes in the center.
(Fig. 4) (Niemann, 2009; Schneider and Paus, 2009). One important feature of the mature sebocytes is the accumulation of lipid droplets. Once mature sebocytes burst, the lipid containing sebum is delivered via the sebaceous duct to the hair channel and surface of the skin. The secreted sebum lubricates the hair channel and the surface of the skin. It also protects the skin against pathogens and environmental stress factors (Thody and Shuster, 1989; Schneider and Paus, 2009). Therefore, the proper function of SGs is crucial for maintenance of the skin barrier. Furthermore, malfunctions of the SGs are associated with diseases including Acne vulgaris and cancers (Zouboulis, 2004).
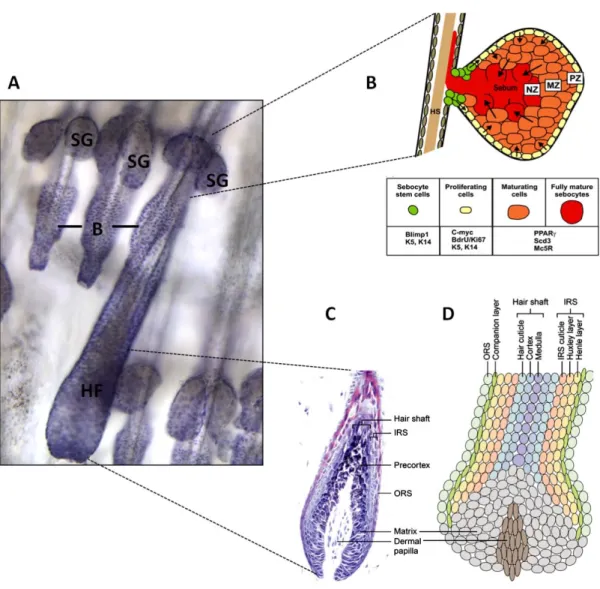
Figure 4: Structure of the pilosebaceous unit.
(A) Haematoxylin- and eosin-stained whole mount of mouse tail skin demonstrating HFs, SGs and the bulge region (B) of the HF. (B) Schematic drawing of the SG illustrating three regions: basal cell layer (PZ), partially mature sebocytes (MZ) and fully mature sebocytes (NZ). (C) Haematoxylin- and eosin-stained section through the base of a growing follicle. (D) Schematic drawing of the HF consisting of different cell layers: outer root sheath (ORS), companion layer, inner root sheath (IRS), hair shaft, matrix containing HF progenitor cells and the dermal papilla (DP), a specialized mesenchymal component embedded in the hair bulb which induces HF proliferation.
(Niemann and Watt, 2002; Schneider and Paus, 2009).
Introduction
26
3.3 Hedgehog signalling during skin development and regeneration
During skin development, a complex signalling network controls the morphogenesis and regeneration of each epidermal compartment. Hh signalling is one of the essential pathways during skin development and homeostasis (St-Jacques et al., 1998; Oro and Higgins, 2003). In mammalian skin, Shh is expressed in the matrix of the hair bulb and promotes cell proliferation and cyclic hair regeneration (Fig. 5A, G, H, I) (Oro at al., 2001; St-Jacques et al., 1998; Chiang et al., 1999; Sato et al., 1999; Wang et al., 2000; Oro and Higgins, 2003). During early skin development, expression of Shh in placodes of the HF and expression of Ptch1, Smo, Gli1 and Gli2 in both the epithelial and dermal compartment suggests Shh signalling activity in cell types derived from both compartments (Fig. 5A-F). (Oro et al., 1997; St-Jacques et al., 1998, Oro and Higgins, 2003). Lower levels of Ptch1, Smo, Gli1 and Gli2 expression were also detected in keratinocytes and in the dermis of the interfollicular region (Fig. 5A-F) (Oro et al., 1997; St-Jacques et al., 1998). However, the function of the Hh pathway in the IFE has not been elucidated yet.
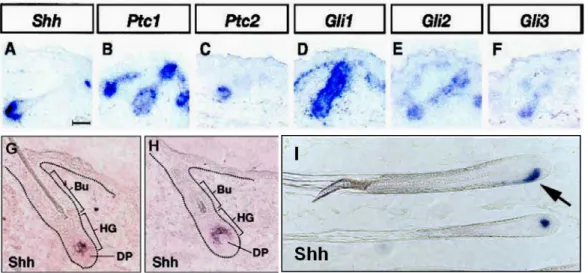
Figure 5: Expression pattern of Shh and Hh pathway components during HF morphogenesis and hair regeneration.
(A-F) Expression of Shh (A), Ptch1 (B), Ptch2 (C), Gli1 (D), Gli2 (E), and Gli3 (F) at E18.5 in wild-type skin.
(G-H) Shh expression in the cyclic, adult HF during hair development. (I) Shh expression in late anagen HFs. Bulge (BU), hair germ (HG), dermal papilla (DP), (Mill et al., 2003; Blanpain and Fuchs, 2006 review; Levy et al., 2007).
Introduction
27
3.4 Ihh signalling during epidermal development
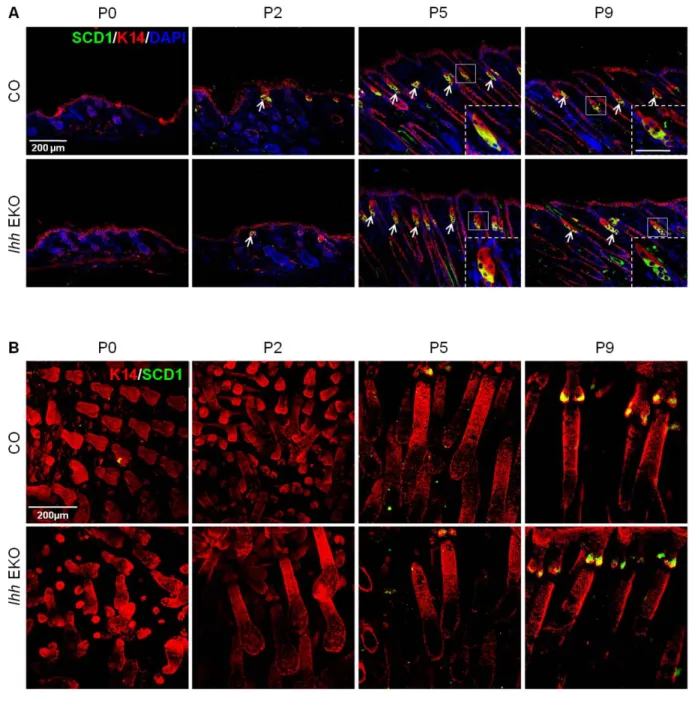
Previous studies indicate that Ihh is expressed in differentiated sebocytes in murine and human skin (Niemann et al. 2003; Takeda et al., 2006; Lo Celso et al., 2008; Bonfanti et al., 2010). In addition, a nuclear accumulation of Gli1 was observed in undifferentiated sebocytes at the periphery of the SG (Fig. 6) (Niemann et al. 2003). In vitro studies also indicate increased amounts of Ihh protein in differentiated human sebocytes (SZ95 cell line) and a nuclear accumulation of Gli1 and Gli2 in undifferentiated sebocytes. This increase in Gli expression correlates with proliferation of undifferentiated cells (Niemann et al., 2003;
Takeda et al., 2006; Lo Celso et al., 2008). The data suggest a paracrine mechanism of Ihh signalling in modulating proliferation of sebocyte progenitors in vitro (Niemann et al. 2003).
More detailed analyses indicated that components of the Hh pathway including Ihh, Ptch1, Smo, Gli2 and Gli3 are up-regulated upon differentiation in human sebocytes (Sequaris et al., unpublished data). The up-regulation of a Gli reporter construct upon sebocytes differentiation shows that not only components of the Hh pathway but also Hh signalling activity increases during sebocyte differentiation (Sequaris et al., unpublished data).
Figure 6: Expression of Gli1 in the SG of mouse skin.
Immunostaining for Gli1 protein (green) in whole mounts of wild type tail epidermis. Scale bars 50µl. (Niemann et al., 2003)
Introduction
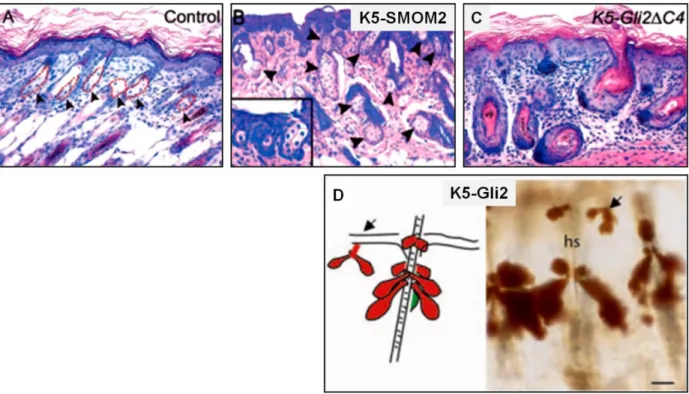
28 Gain and loss of function studies of components of the Hh pathway support the concept that Hh signalling plays an important role for SG differentiation (Table 1) (Niemann, 2009). For instance, ectopic activation of Hh signalling by overexpression of a gain-of-function mutant of the Smo receptor, K5-SMOM2, increases size and number of sebaceous glands (Fig. 7B) (Allen et al. 2003). In addition, constitutive Gli2 expression in the basal layer of all epidermal compartments (K5-Gli2) induces formation of ectopic sebaceous ducts and highly branched SGs not only in association with HFs but also with the IFE (Fig. 7D) (Gu and Coulombe 2008). In contrast, inhibition of Hh signalling in the skin by a dominant-negative form of Gli2 (K5- Gli2∆C4) leads to suppression of sebocyte development (Fig. 7C) (Allen et al. 2003). Taken together, these data led to the hypothesis that Ihh signalling could be an important mediator of sebocyte differentiation and SG formation in mammals.
Figure 7: Modification of SG formation in transgenic mouse models.
(A) Wild type skin. The black arrows indicate HF associated SGs. (B) K5-SMOM2 transgenic (tg) mice expressing a constitutive active SMO mutant in keratinocytes, indicates increased number of SGs. (C) K5-Gli2∆C4 tg mice with a constitutively expressed dominant-negative Gli2 allele in keratinocytes do not develop SG. (D) K5-Gli2 tg mice with constitutive expression of Gli2 develop prominent sebaceous ducts and additionally highly branched SGs (Allen et al. 2003; Gu and Coulombe 2008).
Introduction
29
3.5 Hh signalling in skin cancer
Aberrant regulation of the Hh pathway is implicated in several human developmental abnormalities and diseases including cancer. The first link between the Hh pathway and cancer was discovered in humans in 1992 (Gailani et al., 1992). Inherited loss of function mutations in the human PTCH1 gene were identified as the underlying cause of the Nevoid Basal Cell Carcinoma Syndrome (NBCCS), also called Gorlin syndrome (Hahn et al., 1996;
Johnson et al., 1996). The NBCCS causes developmental defects within different organs such as the Carcinoma (BCC) are frequently caused by inactivating mutations in PTCH1 or to a lesser extent, by activating mutations in SMO, both causing a constitutive activation of the Hh pathway (Hahn et al. 1996; Johnson et al. 1996; Gailani et al. 1996; Xie et al., 1998; Pasca di Magliano and Hebrok, 2003). BCC is the most common human cancer among Caucasians (Epstein, 2008 review). The main trigger of BCC is exposure of the skin t People with fair skin are especially at risk.
Introduction
30 Many transgenic mouse models exist for BCC or BCC-like lesions. These include mice with reduced levels of Ptch1 (Ptch+/-, Ptch fl/fl:K14, Ptch fl/fl:K6), an activated form of human SMO (K5-SMOM), epidermal overexpression of mouse Shh (K14-Shh), Gli2 (K5-Shh) and mouse and human Gli1 (K5-Gli1; K14-GLI1) mimic BCC or BCC like lesions (Table 2) (Goodrich et al., 1997, Hahn et al., 1998; Xie et al., 1998; Grachtchouk et al., 2003; Oro et al. 1997, Grachtchouk et al., 2000, Dahmane et al., 1997; Nilsson et al., 2000; Oro and Higgins, 2003).
In addition to BCC Hh pathway activity is also involved in the pathogenesis of other skin cancers including Squamous Cell Carcinoma (SCC) (Asplund et al., 2005; Snijders et al., 2005;
Wakabayashi et al., 2007), Merkel cell carcinoma (Brunner et al., 2010), Basal Follicular Hamartoma (BFH) (Svärd et al., 2006), tumour of the follicular infundibulum (TFI) (Grachtchouk et al., 2011) and Sebaceous adenoma (Niemann et al., 2003).
Introduction
31
3.5.1 Hh signalling activity in sebaceous tumours
Mice expressing N-terminally truncated Lef1 (∆NLef1), which blocks β-catenin signalling, in the basal layer of the epidermis (K14∆NLef1 transgenics) develop spontaneous sebaceous tumours including sebaceous adenoma and sebeceoma (Niemann et al. 2002). In humans sebaceous tumours are relatively rare benign age-related tumours. Lesions are usually located on sun-damaged skin of the head and neck area (LeBoit, 2006). One third of human sebaceous tumours are associated with mutations in Lef1 which impair Lef1 binding to β-catenin (Takeda et al., 2006).
A previous study showed that treatment of K14∆NLef1 transgenic mice with the carcinogen DMBA induced high frequencies of sebaceous tumours in those mice (Niemann et al., 2007).
The ∆NLef1 mutant appears to act as tumour promoter by preventing accumulation of the tumour suppressor p53. Analysis of sebaceous tumours of K14∆NLef1 transgenic mice revealed high expression of Ptch1 and Gli1. The increased Ptch1 RNA and protein levels and the nuclear localisation of Gli1 indicate that Hh signalling is activated in sebaceous tumours (Niemann et al., 2002, Niemann et al., 2003). Ihh is the prominent Hh ligand expressed in mature sebocytes of sebaceous tumours whereas no Shh and Dhh was detected. In human sebaceous adenoma high levels of IHH, PTCH1, GLI1 and GLI2 expression were also observed whereas SHH and DHH were not significantly expressed (Niemann et al., 2003). In contrast, Ihh protein was not detectable in Pliomatricomas which are benign skin tumours derived from the HF, indicating a specific function of Ihh during sebaceous tumour formation. Together these data suggest an involvement of Ihh signalling during epidermal lineage selection in normal skin and sebaceous tumours.
Introduction
32
3.5.2 Hh signalling and p53
p53 is one of the most well known tumour suppressor genes in mammals. It is mutated in majority of human cancers (Vogelstein et al., 2000). Its importance can be explained by the fact that it acts as a transcriptional regulator in a number of processes, which protect the organism against cell damage and uncontrolled proliferation. Thus, it is involved in cell-cycle control, apoptosis and maintenance of genetic stability (Vogelstein et al., 2000; Vousden and Lane, 2007). Undamaged cells are characterised by low levels of p53 protein where it is efficiently ubiquitinilated and targeted for degradation by the proteasome. However upon hypoxia, radiation-induced DNA damage (UV, X-ray) and induction of proliferation, p53 protein degradation is blocked resulting in a fast accumulation of the protein. p53 acts mainly as a transcription factor controlling a large number of genes, including the cell cycle inhibitor p21, several DNA repair genes (p53R2, XpC, XpG,) and many regulators of apoptosis (BAX, Bcl- 2, Puma) (Polager and Ginsberg, 2009; Weinberg, 2007).
Mutational analyses of p53 indicate that p53 is not a typical tumour suppressor gene.
Surprisingly, p53 inactivation does not lead to lethality while the inactivation of most tumour suppressor genes has profound developmental defects and results in lethality. Mice lacking p53 (p53-/-) show largely normal development but have a shorter life span and develop cancer (lymphoma and sarcoma) before reaching 10 months of age (Jacks et al., 1994). A closer examination Trp53 knockout mice (p53-/-) has however revealed that p53 negatively regulates proliferation and self-renewal of neural stem cells (Meletis et al, 2006). Recent studies on the production of induced pluripotent stem cells derived from somatic cells uncovered an even more general function of p53 in preventing cellular reprogramming and de-differentiation (Zhao and Xu, 2010, Puzio-Kuter and Levine, 2009). On the basis of these findings p53 has been suggested to contribute to the balance between tumour suppression and long-term cell proliferative potential, which is essential for the longevity of organisms with renewable tissues such as mammals (Vousden and Lane, 2007).
Recent studies indicate that, in particular for stem cell biology, Hh signalling is involved in regulating p53. In humans and mice the level of Gli1 is critical in maintaining neural stem cell number (Stecca and Ruiz i Altaba, 2009). In addition, downregulation of Gli1 activity limits brain tumour formation by reducing the number of cancer stem cells (Clement et al., 2007;
Introduction
33 Stecca and Ruiz i Altaba, 2009). This regulation depends on the interaction between the p53 and Gli1. Mechanistically p53 blocks nuclear localisation, expression levels, and consequently the activity of Gli1. Conversely, Gli1 represses p53 thereby establishing a sensitive balance between p53 and Gli1. Furthermore it was shown that stimulation of cerebellar granular neural precursor cells (GNP) with Shh promotes the accumulation and activity of the p53 inhibitor Mdm2 (Malek et al., 2011). Studies in zebrafish also indicate that Shh signalling controls p53 activity, which is required for cell cycle exit of retinal cells and differentiation of photoreceptors (Prykhozhij, 2010).
Previous studies have shown that p53 nuclear accumulation is increased in papilloma and SCC of wild-type mice, when induced by oncogenic Ras (Vousden et al. 2002). Interestingly, in sebaceous tumours induced in K14∆NLef1 transgenic mice the opposite trend was observed, nuclear p53 being significantly reduced (Niemann et al., 2007). Since in these tumours Ihh is up-regulated the question arises whether the unusual behaviour of p53 in sebaceous tumours is due to negative regulation by Hh signalling (Fig. 8).
Introduction
34
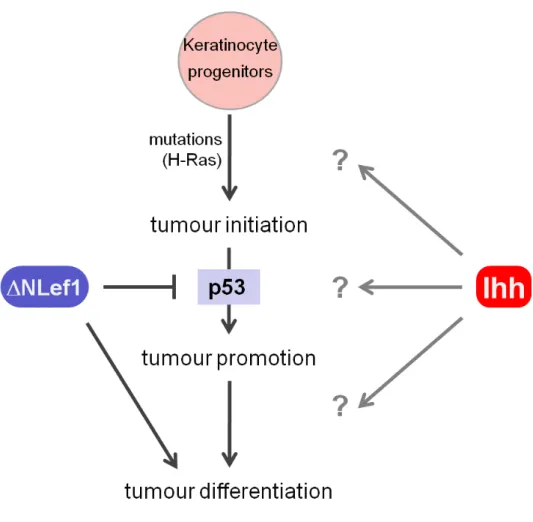
Figure 8: Schematic view of sebaceous tumour development.
The molecular mechanism which causes initiation of spontaneous sebaceous tumour in not clear yet, however chemical induction of H-Ras mutation is sufficient to induce sebaceous tumours in K14∆NLef1 transgenic mice.
The ∆NLef1 specifies tumor type and prevents accumulation of p53 by acting as a tumour promoter. The Ihh signal is proposed to be produced by differentiated sebocytes in the sebaceous tumours and is suggested to be involved in the differentiation process in sebaceous tumour.
Aims
35
3.6 Aims of this study
Many essential components of the Hh pathway, including the ligand Ihh, are expressed in mature sebocytes of SGs and sebaceous tumours in humans and mice. In vitro studies demonstrate that Ihh is involved in controlling differentiation and proliferation of sebocytes.
However an in vivo function of Ihh for morphogenesis and homeostasis of the skin has not been identified yet. Therefore, the aims of this project are:
• Generation and analysis of an epidermis-specific KO mouse model for Ihh.
• Investigation of a potential function of Ihh signalling during skin development and epidermal homeostasis, focusing on sebocyte differentiation and SG formation
• Determining the consequences of loss of epidermal Ihh for sebaceous tumour formation, as well as for development and progression of squamous skin tumours.
• Unravelling the molecular mechanism of Ihh signalling in skin and skin tumours including an analysis of the relationship between Hh signalling and p53.
Material and Methods
36
4 Materials and Methods
4.1 Materials
4.1.1 Chemicals, solvents, media and additives
Table 3: Chemicals and Reagents
Chemical Supplier
Agarose (Star pure9 Starlab, Ahrensburg
Ampicillin Fluka, Buchs, CH, Germany
Automation Buffer (10x) GenTex Inc., Germany
Bovine Serum Albumin (BSA) Sigma-Aldrich, Steinheim BrdU (5-bromo-2’-deoxyuridine) Sigma-Aldrich, Germany
Cholera toxin Sigma-Aldrich, Germany
Collagen G Biochrom AG
Complete Mini protease inhibitor Roche, Mannheim
Deoxycholic Acid (DCA) Fluka, Buchs, CH
Diamidino-2-phenylindol (DAPI) Sigma-Aldrich, Steinheim Diazabicycloloctan (DABCO) Sigma-Aldrich, Steinheim 7,12-dimethylbenz-[a]-anthracene (DMBA) Sigma-Aldrich, Steinheim Dimethyl Sulfoxide (DMSO) Sigma-Aldrich, Steinheim
Dithiothreitol (DTT) Biochemika, Duesseldorf
D-MEM/Ham`s F12 Biochrome, Berlin, Germany
EDTA pH 8.0 (0.5M) Gibco, Germany
Epidermal Growth Factor (EGF) Biochrom, Berlin
Ethanol Roth, Karlsruhe
Ethidium bromide Amersham Biosciences, Uppsala, S
Ethylenediaminetetraacetic Acid (EDTA) Roth, Karlsruhe
Fetal Calf Serum (FCS) Biochrom, Berlin
Glycerol Roth, Karlsruhe
Glycine Roth, Karlsruhe
Material and Methods
37
HEPES Merck, Darmstadt
Hydrochloric acid (HCl) Fluka, Buchs, CH
Isopropanol Roth, Karlsruhe
Keratinocyte Growth Factor (KGF) Biochrom, Berlin
Kanamycin Fluka, Buchs, CH
MassRuler DNA Ladder, high range Fermentas; Germany MassRuler DNA Ladder, low range Fermentas, Germany Magnesium Chloride (MgCl2) Sigma-Aldrich, Steinheim
Methanol Roth, Karlsruhe
Milk powder Heirler, Radolfzell
MOPS (10x) Invitrogen, Karsruhe
Mowiol Calbiochem, Darmstadt
Mitomycin C Sigma, Aldrich Steinheim
Mowiol Calbiochem
NaCl Roth, Karlsruhe
Normal goat serum (NGS) Sigma-Aldrich Steinheim
NuPAGE Antioxidant Invitrogen, Karsruhe
NuPAGE LDS Sample Buffer Invitrogen, Karsruhe NuPAGE MOPS SDS Running Buffer Invitrogen, Karsruhe
Optimem I Invitrogen, Karlsruhe
Paraformaldehyde (PFA) Merck, Darmstadt
Protease inhibitor cocktail tablets Roche, Mannheim
PBS Biochrom, Germany
PCR-Mastermix “Ready to load” Bio-Budget, Germany
Penicillin/Streptomycin Biochrom, Germany
Pertex Leica, Germany
PFA Merck, Darmstadt
Sebomed basal culture medium Biochrom, Berlin Sodium Dodecyl Sulfate (SDS) Roth, Karlsruhe
Sodium chloride (NaCl) Roth, Karlsruhe
Sodium hydroxide (5M NaOH) Roth, Karlsruhe
SOC-Medium Invitrogen, Karlsruhe
12-O-Tetradecanoylphorbol-13-acetat (TPA) LC laboratories, USA
Material and Methods
38
Transfer buffer Invitrogen, Karlsruhe
Tris Roth, Karlsruhe
TritonX-100 Merck, Darmstadt
Trypsin/EDTA Biochrom, Berlin
Tween-20 Roth, Karlsruhe
Xylol Roth, Karlsruhe
4.1.2 Kits, devices and accessories
Table 4: Kits Supplier
Pierce BCA Protein Assay Kit Pierce Biotechnology, USA QIAGEN Plasmid Purification Mini Kit Qiagen, Hilden
ECL Plus Western blotting detection reagent GE Healthcare, Germany DeadEnd™ Fluorometric TUNEL System Promega, Germany
Table 5: Devices and accessories Supplier Cameras:
Nikon eclips-E800 Nikon Instech Co, Japan
Nikon DMZ1200 camera Nikon Instech Co, Japan
Olympus U-TB190, 8M14203 Olympus GmbH, Japan
Leica DM 4000B Leica Microsystems, Germany
Leica JVC 3-Chip-Kamera KY-F75U Leica Microsystems, Germany
Centrifuges
Refrigerated Microcentrifuge, 5415 R Eppendorf AG, Hamburg
Microcentrifuge, 5417 C Eppendorf AG, Hamburg
Films
Hyperfilm for Western Blots Amersham, Biosciences, UK
Material and Methods
39 Gel electrophoresis and blotting systems
NuPage Novex high-performance pre-cast gels Invitrogen, Karlsruhe
XCell II, Blot Module Invitrogen, Karlsruhe
Heating blocks
Eppendorf Thermomixer compact Eppendorf AG, Hamburg Incubators
Hereaus 6000 cell incubator Kendro Laboratory Products, Germany Photometer
BioPhotometer plus Eppendorf AG, Hamburg
Others
BioDoc Analyze Biometra
Curix 60 developer AGFA; Belgian
ECL Hyperfilm Fermentas
Eppendorf Thermomischer kompakt Eppendorf AG, Hamburg
Loading dye blue 6x Fermentas, St. Leon-Rot
MagicMark-XP Invitrogen, Karlsruhe
MasterMix (2,5x) PCR Mix Eppendorf AG, Hamburg NuPAGE Novex 4-12% Bis-Tris Mini Gels Invitrogen, Karlsruhe
PowerPac Universal Biorad, Germany
PageRuler Plus Prestained Fermentas, St. Leon-Rot Pressure cooker (2100-Retriver) Prestige Medical, France SERVAGel TG10–Vertical,Tris-Glycine Gel Serva, Germany
Westram Clear Signal nitrocellulose-
Membrane Whatman Inc, Stanford, USA
Whatman Gel Blot paper Schleicher & Schuell, Dassel
Xcell II Blot module Invitrogen, Karlsruhe
Xcell SureLock Mini-Cell Invitrogen, Karlsruhe
Material and Methods
40
4.1.3 Media, solutions and buffers
Phosphate buffered saline (PBS, Instamed), Biochrom, Berlin 10x TAE:
0.9M Tris Ultra 0.89M Boric acid 20mM EDTA pH 0.8
1% Ripa buffer (western blot):
150mM NaCl
25mM Tris.HCL pH 7.5 1% sodium deoxycholate 1 % NP-40
add 1 protease inhibitor cocktail tablet to 10ml WCE buffer
after determination of protein concentration 1mM DTT was added
Whole cell extract (WCE) buffer (western blot):
20mM HEPES 0.42M NaCl 0.5% NP-40 0.5% DCA 25% glycerol 0.2mM EDTA 1.5mM MgCl2
add 1 protease inhibitor cocktail tablet to 10ml WCE buffer
after determination of protein concentration 1mM DTT was added
10x TBS (western blot):
0,2M Tris Base 2M NaCl pH 7.6
Material and Methods
41 1x TBS-T (western blot):
100ml 10x TBS 0.1% Tween
1M Tris-HCl 1M Tris Base pH 7.5
1l ddH2O
Blocking solution (western blot):
1x TBS-T
5% Milchpulver
Glycine strip (western blot):
0,1M Glycine 20% SDS pH 2.5
1 x Tris glycine running buffer (western blot):
25mM Tris 190mM Glycine 10 % SDS
1 x Tris glycine transfer buffer (western blot):
25mM Tris 190mM Glycine 20 % Methanol
NuPAGE Invitrogen (western blot):
2μl NuPAGE Reducing agent (10x) 5μl NuPAGE LDL Sample Buffer (4x) 13μl Sample
20μl ddH2O
Material and Methods
42 5 x Laemmli loading dye (western blot):
60mM Tris.HCL pH 6.8 10% Glycerol
2% SDS
5% s-mercaptoethanol 0.01% bromophenol blue TNE buffer lysis buffer:
40mM Tris 150mM NaCl 10mM EDTA pH 7.4
Keratinocytes medium
DMEM/Ham’s F12 medium (500ml) Supplements:
100U/ml penicillin 100μg/ml streptomycin 1.8 x 10⁻⁴M (16.6 mg) adenine 2mM L-Glutamine
0.5µg/ml (0.25 mg) hydrocortison 10ng/ml (5 μg) EGF
10-5M cholera enerotoxin 5 µg/ml (2.5 mg) insulin
10 % FCS Gold (chelex-100 resin treated)
FCS was treated with Chelex-100 resin overnight at RT, pH 7.0 and strained through a sterile filter prior to use
Material and Methods
43 J2/3T3 fibroblast medium supplemented with:
DMEM
100U/ml penicillin 100μg/ml streptomycin 10 % FCS
Lysis buffer (isolation of gDNA):
0.2M NaCl
0.1M Tris HCl pH 8,5 5 µM EDTA
0.2% SDS 8.4 ml dH2O
add 5U Proteinase K (20mg/ml) before use
Mowiol/DABKO:
4.8 g Mowiol 12 g Glycerin 12 ml H2O
stirr 3 - 4 h
add 24 ml 0.2 M Tris pH 8
heat to 50 °C and stir overnight
add 1.2 g DABKO (2,5%)
1M Tris-HCl:
1M Tris Base pH 7.5
Blocking solution for BrdU-IF-staining on cells:
3g BSA 10ml FCS 5g Milk powder 10µl Tween-20
100ml 1x PBS
Material and Methods
44
4.2 Mice
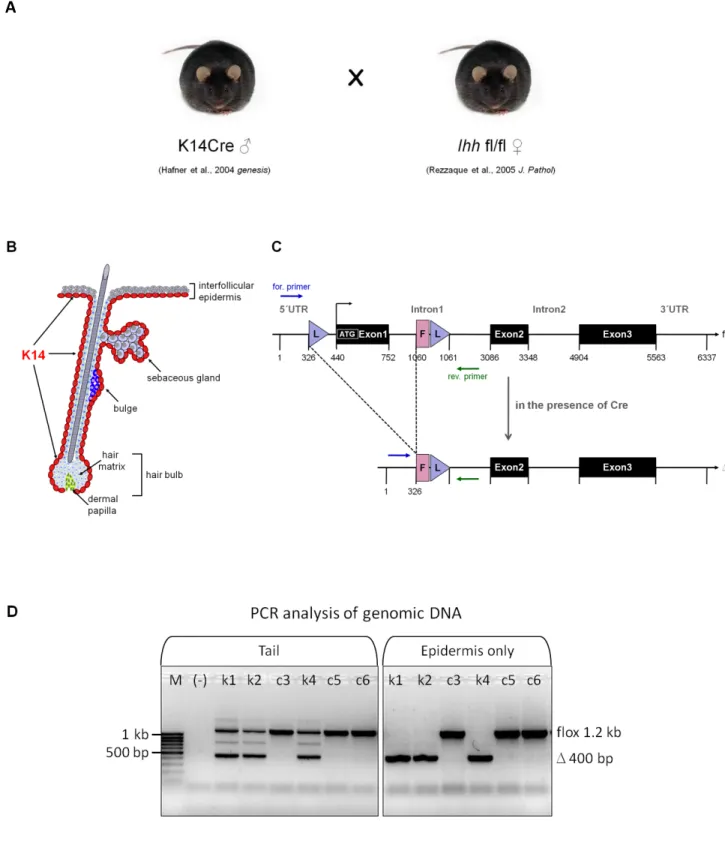
To generate epidermal specific Ihh knockout mice (Ihh EKO) (K14Cre+/-//Ihh fl/fl) homozygous mice carrying a floxed Ihh gene (Ihh fl/fl) (Razzaque et al., 2005) were crossed with mice expressing Cre-recombinase under control of the human Keratin 14 promoter (K14Cre+/-) (Hafner, et al. 2004). To generate triple mutant, homozygous Ihh EKO mice were crossed with K14∆NLef1 transgenic mice (Niemann et al., 2002).
The Ihh floxed mice have been used in studies of the role of Ihh in other organs (Kobayashi et al., 2005; Lee et al., 2006; Mao et al., 2010; van Dop et al., 2010; Kosinski et al., 2010; Ochiai et al., 2010).
All mouse strains used were backcrossed or maintained on a C57BL/6 background.
In this study K14Cre+/-//Ihh fl/fl and Ihh fl/fl littermates were analysed for development of postnatal skin and were also used in two-stage carcinogenic tumour experiment.
The K14∆NLef1 /K14Cre+/-//Ihh fl/fl and K14∆NLef1/Ihh fl/fl were used for one-stage carcinogenic tumour experiment. For the number and genotype of animals which were used in this study see table 6, 7 and 8.
4.2.1 Tumour studies in K14ΔNLef1 transgenic mice
To induce sebaceous tumours, skin of 8-9 week old K14ΔNLef1/Ihh EKO and K14ΔNLef1 littermates were treated once with a sub-critical threshold dose of 7,12-dimethylbenz-[a]- anthracene (100nmol DMBA /200µl acetone) (DMBA, Sigma-Aldrich) or acetone vehicle. 4 weeks after topical DMBA application tumours develop. DMBA induces point mutations at different genes, including codon 61 of the proto-oncogene H-Ras (in K14ΔNLef1/Ihh EKO background). With special safety precautions the solution was applied onto the skin of the shaved back of anaesthetized mice. Scoring of tumours was carried out once a week for up to 50 weeks after tumour initiation. For the number and genotype of animals which were used in this study see table 7 and 8
Material and Methods
45
4.2.2 Two-stage skin carcinogenesis experiment
To induce squamous tumours (papilloma and SCC) (Sundberg et al., 1997; Abel et al., 2009), skin of 8-9 week old Ihh EKO and Ihh fl/fl control littermates were treated once with a sub- critical threshold dose of 7,12-dimethylbenz-[a]-anthracene (100nmol DMBA /200µl acetone) (DMBA, Sigma-Aldrich) or acetone vehicle. One week later animals received the tumour promoter TPA (12-O-Tetradecanoylphorbol-13-acetat, LC Laboratories) (6nmol/200µl acetone, or acetone vehicle only, three times per week for 25 weeks. Under special safety precaution the solution was applied onto the skin of the shaved back of anaesthetized mice. Scoring of tumours was carried out one a week for up to 50 weeks after tumour initiation. For the number and genotype of animals which were used in this study see table 7 and 8
Material and Methods
46 Table 6: Mice used in this studies
Genotype number
(n)
Treatment Experiment
Ihh fl/fl 8-15
each stage
___
Studies for postnatal skin development (P0-P10) K14Cre+/-//Ihh fl/fl 8-15
each stage
___
Table 7: Mice used in this studies, first set of tumour experiment
Genotype number
(n)
Treatment Experiment
Ihh fl/fl 19 DMBA/TPA Two-stage carcinogenic
experiment
K14Cre+/-//Ihh fl/fl 20 DMBA/TPA Two-stage carcinogenic experiment
K14Cre+/-//Ihh fl/fl 5 TPA/Acetone Two-stage carcinogenic experiment
Ihh fl/fl 4 DMBA/Acetone Two-stage carcinogenic
experiment
K14Cre+/-//Ihh fl/fl 5 DMBA/Acetone Two-stage carcinogenic experiment
K14∆NLef1/hh fl/fl 17 DMBA One-stage carcinogenic
experiment
K14∆NLef1/K14Cre+/-//Ihh fl/fl 19 DMBA One-stage carcinogenic experiment
K14∆NLef1/hh fl/fl 4 Acetone One-stage carcinogenic
experiment
K14∆NLef1/K14Cre+/-//Ihh fl/fl 5 Acetone One-stage carcinogenic experiment
Table 8: Mice used in this studies, second set of tumour experiment
Genotype number
(n)
Treatment Experiment
Ihh fl/fl 31 DMBA/TPA Two-stage carcinogenic
experiment
K14Cre+/-//Ihh fl/fl 33 DMBA/TPA Two-stage carcinogenic experiment
K14∆NLef1/hh fl/fl 17 DMBA One-stage carcinogenic
experiment
K14∆NLef1/K14Cre+/-//Ihh fl/fl 17 DMBA One-stage carcinogenic experiment
Material and Methods
47
4.3 Molecular Biology
Standard methods of molecular biology were performed according to Sambrook and Russell (Sambrook and Russell, 2001; Celis, 2006) unless stated otherwise.
4.3.1 Genotyping and efficiency of deletion
Genotyping was performed by PCR on DNA extracted from tail biopsies using customised primers. PCR analysis on genomic DNA from split epidermis was performed to determine the efficiency of deletion of the floxed region in Ihh locus in the presence of keratin 14-driven Cre.
4.3.2 Isolation of genomic DNA (gDNA)
Tail biopsies of 3-week of mice were incubated in lysis buffer containing 0.2M NaCl, 0.1M Tris/HCl, PH8,5; 5µM EDTA; 0,2% SDS and 100µg/ml proteinase K (Sigma [39U/mg]) for 2-3 hours at 55°C. After a centrifugation step, 2 volumes isopropylalcohol were added to the supernatant to precipitate gDNA. 150µl H2O (DNase free) was added to the pellet and subsequently, gDNA was dissolved O/N at RT.
4.3.3 Polymerase Chain Reaction (PCR) for genotyping
PCR (Mullis et al., 1987; Saiki et al., 1988) was used to amplify DNA fragments and genotype mice for the presence of floxed alleles and/or transgenes with customized primers listed in Table 9.
All amplifications were performed in a total reaction volume of 25μl, containing a minimum of 50ng template DNA, 5-25pmol of each primer, 25μM dNTPs Mix, 1U of RedTaq DNA- polymerase and 1xRedTaq Reaction buffer. For genotyping Eppendorf MasterMix and RedTaq ReadyMix PCR kit with MgCl2 (Sigma) was used.
Material and Methods
48 Standard PCR programs started with 5-8min denaturation at 95°C, followed by 30-32 cycles consisting of denaturation at 94°C for 30sec, annealing at oligonucleotide-specific temperatures for 30-60 sec and elongation at 72°C for 30-45 sec and a final elongation step at 72°C for 5-10 min. Based on the number of specific nucleotides in the primer, the following formula was used to estimate the melting temperature of primers: Tm=2(A+T)+4(G+C). All PCR reactions carried out either in T-Gradient Thermocyler or Personal Thermocycler (Biometra).
PCR amplification products were analysed by agarose gel electrophoresis. PCR-amplified DNA fragments were applied to 2% (w/v) agarose gels (1x TAE electrophoresis buffer, 0.5mg/ml ethidium bromide) and electrophoresed at 120-200V.
Table9: Oligonucleotides used for genotyping
Mouse strain Primer Oligonucleotide (5´3´) T-Annealing [°C]
Ihh floxed
(Razzaque et al., 2005)
fllhh-for-Lanske 5´-AGC ACC TTT TTT CTC GAC TGC CTG-3´ 68 fllhh-rev-Lanske 5´-TGT TAG GCC GAG AGG GAT TTC GTG-3´ 68 K14Cre
(Hafner, et al., 2004)
SC1-for 5´-GTC CAA TTT ACT GAC CGT ACA C-3´ 59 SC3 -rev 5´-CTG TCA CTT GGT CGT GGC AGC-3´ 59 K14∆NLef1
(Niemann et al., 2002)
dNLef1-for 5´-TGT CCC TTG TAT CAC CAT GGA CC-3´ 49 dNLef1-for 5´-CCA AAG ATG ACT TGA TGT CGG CT -3´ 49
All primer sequences are displayed in 5´-3’ order. Primer orientation is designated “sense” when coinciding with transcriptional direction. All primers were purchased from MWG, Germany.
4.3.4 PCR anaylsis for efficiency of deletion
PCR analyses were performed to amplify DNA fragment and genotype mice for the deletion of exon1 in floxed alleles to examine the Cre activity and its specific expression in the skin of Ihh EKO mice with customised primers listed in Table 10.
All amplifications were performed in a total reaction volume of 25μl, containing a minimum of 50ng template DNA, 5-10pmol of each primer, 25μM dNTPs Mix, 1U of RedTaq DNA- polymerase and 1xRedTaq Reaction buffer. For deletion PCRs, RedTaq ReadyMix PCR kit with MgCl2 (Sigma) was used.
Material and Methods
49 Standard PCR programs started with 4 min denaturation at 95°C, followed by 30 cycles consisting of denaturation at 95°C for 30 sec, annealing at oligonucleotide-specific temperatures (68°C) for 45 sec and elongation at 72°C for 80 sec and a final elongation step at 72°C for 7 min. PCR reactions carried out either in T-Gradient Thermocyler or Personal Thermocycler (Biometra). PCR amplification products were analysed by agarose gel electrophoresis. PCR-amplified DNA fragments were applied to 1% - 3% (w/v) agarose gels (1 x TAE electrophoresis buffer, 0.5mg/ml ethidium bromide) and electrophoresed at 120-200V.
Table10: Oligonucleotides used in PCR analysis for efficiency of deletion
Mouse strain Primer Oligonucleotide (5´3´) T-Annealing [°C]
K14Cre/Ihh fl/fl
PK-Ihh-for-1-20 5´-CCG CAG ACG GCA GCA GCT CC-3´ 68 PK-Ihh-For-56-77 5´-TGC TAA CCG CGG GTC CCT TCA G-3´ 68 fllhh-rev-Lanske 5´-TGT TAG GCC GAG AGG GAT TTC GTG-3´ 68
All primer sequences are displayed in 5´-3’ order. Primer orientation is designated “sense” when coinciding with transcriptional direction. All primers were purchased from MWG, Germany.
4.3.5 DNA sequencing
Genomic DNA was sequenced for Ihh exon1 deletion using an ABI Big dye terminator sequencing Kit (Applied Biosystems) according to the manufacturer’s instructions. The fluorescently labelled DNA was analysed with an ABI Prism3730 DNA analyser (Applied Biosystems).
4.4 Protein biochemical methods
4.4.1 Protein extraction from skin and skin tumours
Skin or tumour tissue were lysed in 1-3ml of 1x Ripa lysis buffer supplemented with Complete Mini protease inhibitor cocktail (Roch) (10ml 1x Ripa buffer 1 tablet of Complete Mini
Material and Methods
50 protease inhibitor). Skin and tumour lysates were generated by homogenising the tissue by a mixer mill (Qiagen) for 3-5 min at 30Hz. Lysates were incubated for 30 min on ice followed by 30 min centrifugation at 13.500rpm, 4°C. The supernatants containing protein were transferred into new eppendorf tubes and after addition of DTT stored at -80°C and -20°C.
4.4.2 Protein quantification by Biuret protein assay
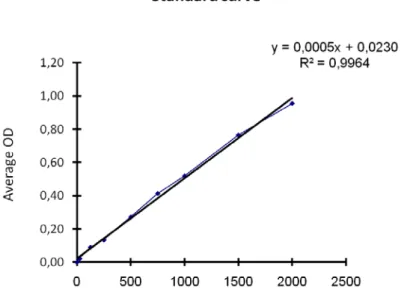
The protein concentration of the lysates was quantified by the bicinchoninic acid (BCA) method using the Pierce BCA Protein Assay Kit (Pierce Biotechnology, Rockford USA) according to the manufacturer’s instructions. This method is based on a two step detection system. In alkaline environment proteins form complexes with Cu2+ ions there by reducing them to Cu1+ ions (biuret method). Subsequently the reduced Cu1+ ions form a soluble purple complex with bicinchoninic acid (BCA) that has a maximal absorbance at 562nm. For the quantification of the protein concentration, samples were diluted 1:10. Applying the protocol, 10μl of the diluted sample as well as 10μl of eight BSA samples with known concentrations (0, 25, 125, 250, 500, 750, 1000, 1500 up to 2000μg/ml) for the standard curve were incubated with 200μl supplied BCA-working solution and incubated for 30 min at 37°C in 96 well plates (TPP, Trasadingen, CH). The absorbance of the reaction product was measured by an Immuno Reader NJ-2000 (InterMed Inc., Cambridge USA) at 578nm. Each lysate was quantified as triplicates. The standard curve was made by plotting the absorbance of the BSA standards against their concentration (Fig. 9). The resulting equation of the standard curve was then used to calculate the unknown protein concentrations of the analysed samples.