https://doi.org/10.1007/s00392-020-01684-z ORIGINAL PAPER
Obstructive sleep apnoea but not central sleep apnoea is associated with left ventricular remodelling after acute myocardial infarction
Christoph Fisser1 · Kristina Götz1 · Andrea Hetzenecker2 · Kurt Debl1 · Florian Zeman3 · Okka W. Hamer4 · Florian Poschenrieder4 · Claudia Fellner4 · Stefan Stadler1 · Lars S. Maier1 · Michael Pfeifer2 · Stefan Buchner1,5 · Michael Arzt1
Received: 27 January 2020 / Accepted: 2 June 2020
© The Author(s) 2020
Abstract
Obejctive Obstructive sleep apnoea (OSA) increases left ventricular transmural pressure more than central sleep apnoea (CSA) owing to negative intrathoracic pressure swings. We tested the hypothesis that the severity of OSA, and not CSA, is therefore associated with spheric cardiac remodelling after acute myocardial infarction.
Methods This sub-analysis of a prospective observational study included 24 patients with acute myocardial infarction who underwent primary percutaneous coronary intervention. Spheric remodelling, calculated according to the sphericity index, was assessed by cardiac magnetic resonance imaging at baseline and 12 weeks after acute myocardial infarction. OSA and CSA [apnoea-hypopnoea index (AHI) ≥ 5/hour] were diagnosed by polysomnography.
Results Within 12 weeks after acute myocardial infarction, patients with OSA exhibited a significant increase in systolic sphericity index compared to patients without sleep-disordered breathing (no SDB) and patients with CSA (OSA vs. CSA vs. no SDB: 0.05 ± 0.04 vs. 0.01 ± 0.04 vs. − 0.03 ± 0.03, p = 0.002). In contrast to CSA, the severity of OSA was associ- ated with an increase in systolic sphericity index after accounting for TIMI-flow before percutaneous coronary intervention, infarct size, pain-to-balloon-time and systolic blood pressure [OSA: B (95% CI) 0.443 (0.021; 0.816), p = 0.040; CSA: 0.193 (− 0.134; 0.300), p = 0.385].
Conclusion In contrast to CSA and no SDB, OSA is associated with spheric cardiac remodelling within the first 12 weeks after acute myocardial infarction. Data suggest that OSA-related negative intrathoracic pressure swings may contribute to this remodelling after acute myocardial infaction.
Electronic supplementary material The online version of this article (https ://doi.org/10.1007/s0039 2-020-01684 -z) contains supplementary material, which is available to authorized users.
* Christoph Fisser Christoph.Fisser@ukr.de
1 Department of Internal Medicine II, University Medical Centre Regensburg, Franz-Josef-Strauß-Allee 11, 93053 Regensburg, Germany
2 Department of Pneumology, Donaustauf Hospital, Donaustauf, Germany
3 Centre for Clinical Studies, University Medical Centre Regensburg, Regensburg, Germany
4 Department of Radiology, University Medical Centre Regensburg, Regensburg, Germany
5 Department of Internal Medicine, Cham Hospital, Cham, Germany
Graphic abstract
Keywords Myocardial infarction · Sleep apnoea · Sphericity · Cardiac remodelling · Wall thickness · Aneurysm · Cardiac magnetic resonance
Introduction
Over recent decades, patient survival after ST-elevation myocardial infarction (STEMI) has improved tremen- dously due to innovative therapeutic advances in the treatment and management of this condition [1]. However, postinfarction heart failure resulting from left ventricular remodelling processes remains a major predictor of prog- nosis [2].
Most cardiac aneurysms after STEMI affect the anterior wall of the left ventricle and are a strong predictor for heart failure and surval after myocardial infarction [3].
Infarct expansion—thinning and dilatation of the left ven- tricle after myocardial infarction—transforms the helical structure of the apex into a more spherical shape [4–6].
Spheric cardiac remodelling can be measured by the sphe- ricity index [7] and is characterised by a decline in left ventricular ejection fraction, and a decrease in 10-year survival after myocardial infarction [5, 8].
Sleep-disordered breathing (SDB) manifests in two distinct types, obstructive and central sleep apnoea (OSA and CSA, respectively) [9]. The hallmark of OSA is breathing efforts against the occluded pharynx, leading to negative inspiratory pressure swings [10] and to a signifi- cantly increased left ventricular transmural wall pressure.
Tkacova et al. demonstrated in a sample of patients with chronic heart failure and reduced ventricular ejection frac- tion that treatment of severe OSA reduces left ventricular transmural wall pressure [11].
CSA is characterised by periods of hyperventilation, fol- lowed by a reduction in pCO2 below the apnoea threshold and leads to intermittent hypoxaemia without inspiratory efforts and negative intrathoracic pressure. Therefore, in contrast to OSA, CSA may result in a smaller effect on afterload [12] and a slightly increased stroke volume [13].
The effects of OSA on left ventricular wall pressure, espe- cially in patients with heart failure [14], may promote spheric cardiac remodelling during the vulnerable early phase after myocardial infarction to a greater extent than the effects of CSA. However, an association between SDB, classified into CSA and OSA, and spheric cardiac remodelling has not yet been reported. Therefore, we tested the hypothesis that in patients with acute myocardial infarction, the severity of OSA, but not CSA, is independently associated with spheric remod- elling, assessed by cardiac magnetic resonance (CMR).
Methods
A sub-analysis of a prospective observational study [15–18] in patients with acute myocardial infarction was conducted at the University Medical Centre Regensburg (Regensburg, Germany). Details of the study design have been published previously [15–18].
Patients
The inclusion criteria for this sub-analysis were as follows:
patients aged 18–80 years with acute myocardial infarction and percutaneous coronary intervention, who were treated at the University Medical Centre Regensburg (Regensburg, Germany) within 24 h of symptom onset. Key exclusion criteria included previous myocardial infarction or previ- ous myocardial revascularisation, indication for surgical myocardial revascularisation, cardiogenic shock, implan- tation of a cardiac device, or other contraindications for CMR, known treated SDB, and impractical patient follow- up (e.g., distant place of residence, language barrier).
Between March 2009 and March 2012, 252 consecutive patients who underwent percutaneous coronary interven- tion to treat acute myocardial infarction were screened.
74 patients were eligible for the prospective observational study [16]. 50 patients were excluded from this sub-analy- sis owing to missing CMR (n = 7), missing polysomnogra- phy (n = 1), or myocardial infarction other than left ante- rior descending (n = 42). The final sub-analysis included 24 patients, who could be divided into three cohorts (no SDB, OSA and CSA).
Study design
The study protocol was reviewed and approved by the local institutional ethics committee (Regensburg, 08-151) and the research was conducted according to the Declaration of Helsinki and Good Clinical Practice. All patients signed written informed consent prior to enrolment.
Eligible patients underwent an overnight in-laboratory sleep study (polysomnography − PSG) 3–5 days after per- cutaneous coronary intervention [15–18].
Clinical management and medication were at the dis- cretion of the responsible physician according to current best practice. Patients were divided into two groups based on the following specifications: without SDB (AHI < 5 events per hour) and with SDB (AHI ≥ 5 events per hour).
Patients with SDB were additionally separated into a CSA cohort (more central than obstructive episodes) and an OSA cohort (more obstructive than central episodes).
None of the patients received positive airway pressure
therapy within the first 12 weeks after acute myocardial infarction.
Polysomnography (PSG)
All patients underwent PSG using standard polysomno- graphic techniques (Alice System; Respironics, Pittsburgh, PA, USA) [15–18]. The sleep laboratory is located on the cardiology ward at the University Medical Centre Regens- burg, to which participants with acute myocardial infarction were admitted. The median time to PSG after acute myocar- dial infarction was 3 days. Respiratory efforts were measured by means of respiratory inductance plethysmography, and airflow was measured with a nasal pressure cannula. Sleep stages, arousals, apnoeas, and hypopnoeas were determined according to the criteria of the American Academy of Sleep Medicine [9] by an experienced sleep technician blinded to the clinical data. Apnoea was defined as cessation of inspira- tory airflow for ≥ 10 s. Hypopnoea definition A was used (≥ 30% reduction in airflow and ≥ 4% desaturation) [9]. In addition, hypopnoeas were classified as obstructive if there was out-of-phase motion of the ribcage and abdomen, or if airflow limitation was present. In order to accurately distin- guish between obstructive and central hypopnoeas without using an oesophageal balloon, we applied additional criteria, such as flattening, snoring, paradoxical effort movements, arousal position relative to hypopnoeas and associated sleep stage (rapid eye movement (REM)/non-REM) [19]. Apnoea- hypopnoea index (AHI) was defined as the number of cen- tral (cAHI) or obstructive (oAHI) apnoea and hypopnoea episodes per hour of sleep [20]. CSA was defined as cAHI/
AHI > 50% and OSA as cAHI/AHI ≤ 50%.
CMR acquisition protocol
Details of the CMR acquisition protocol have been published previously [15–18]. CMR was performed using a clinical 1.5-T scanner (Avanto; Siemens Healthcare Sector, Erlan- gen, Germany) with a 32-channel phased-array receiver coil.
Cine images in standard short axis planes, two chamber and four chamber views (slice thickness 8 mm, inter-slice gap 2 mm, repetition time 60.06 s, echo time 1.16 s, flip angle 60 °, field of view 300 × 300 mm, matrix size 134 × 192 pixels, readout pixel bandwidth 930 Hz per pixel) was performed using acquisition of steady-state free preces- sion. Delayed enhancement images were obtained using a segmented inversion recovery steady-state free precession technique (slice thickness 8.0 mm, inter-slice gap 2 mm, repetition time 1 RR interval, echo time 1.48 ms, flip angle 60 °, field of view 360 × 360 mm, matrix size 128 × 256) and acquired 10–15 min after injection of gadolinium.
CMR image analysis
Details of CMR image analysis have been published previ- ously [15–18]. Wall thickness and cardiac volumes were evalu- ated at baseline and 12 weeks after the myocardial infarction.
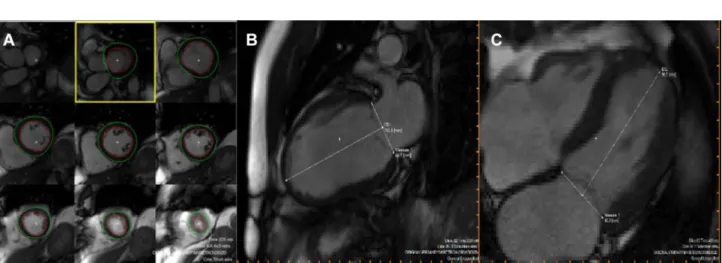
Planimetric studies were conducted in the serial short axis slices. The basal and apical layers of myocardial muscle were determined visually. The epi- and endocardial textures in all other layers were marked semi-automatically. Wall thickness and thickening was automatically assessed by the AHA 17 segment model [21]. By definition, eight segments relate to the left anterior descending artery (basal anterior, basal antero- spetal, mid-anterior, mid-anteroseptal, apical anterior, apical septal, apical lateral and apical). Variation owing to different coronary artery supply is possible. To evaluate left ventricular size, the distance between the apex and the mitral valve area in 2- and 4-chamber-view was measured manually in systole and diastole.
To assess wall thickness the sum of the related segments was computed and the arithmetic mean was calculated (Fig. 1).
The difference between baseline and follow-up readings was calculated. Quality control of measurements was overseen by two experienced cardiologists.
Sphericity index
The sphericity index is an approved index used to describe the degree of left ventricular geometric abnormality in anterior wall myocardial infarction [7, 22]. It quantifies the extent of cardiac remodelling after myocardial infarction according to the following formula [22]:
SphericityIndex= LVvolume
4 3 ∗ 𝜋 ∗
(LVlength
2
)3
An upper limit of 0.29 in diastole is considered non- pathologic [7]. Calculation was performed at baseline and at 12-weeks follow-up.
Recordings of 24‑h blood pressure
Blood pressure measurement was conducted with the non- invasive portable SpaceLabsTM90207 (OSI Systems Inc) device. Patients were advised to keep calm during the meas- urements. Average values for blood pressure were analyzed for each hour and for the 24-h period.
Statistical analysis
Unless otherwise indicated, descriptive data are expressed as means ± SD or as frequencies and percentages of each category. The groups of patients with no SDB, CSA and OSA were compared using one-way analysis of variance (ANOVA) for continuous variables, the Chi-square test for categorical variables and the Kruskal–Wallis Test for ordinal and skewed variables. Bonferroni test was used for post- hoc analysis. Linear regression models were calculated to assess the predictive value of CSA and OSA with respect to sphericity index. One multiple linear regression model was adjusted for infarct size, TIMI flow pre-percutaneous coronary intervention and pain-to-balloon-time, and one model was adjusted for the demographic variables age, sex and BMI. Scatter plots with regression lines were used to visualise the relationship between variables. All reported p values are two-sided, with 0.05 considered the threshold for statistical significance. Data entry and data analysis were performed with the software package SPSS 25.0 (Chicago, EUA).
Fig. 1 Example of magnetic resonance imaging of the left ventricle: a Planimetry, b, c size of left ventricle
Results
Patient characteristics
The characteristics of the patients at baseline were well bal- anced among groups (Table 1). The median age among all the patients was 49 ± 10, 57 ± 8 and 54 ± 8 years (no SDB, CSA, OSA, respectively), and 88% of the patients were male. The prevalence of hypertension, diabetes, smoking status, hypercholesterinaemia was similar in the trial groups.
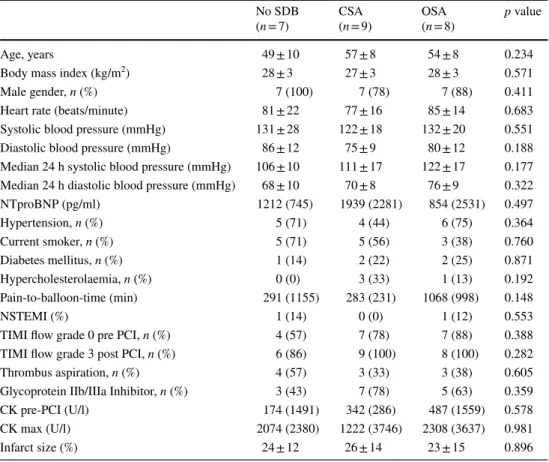
All patients received standard pharmacological therapy after acute myocardial infarction. Mean 24-h blood pressure in systole and diastole did not differ significantly between the CSA and the OSA groups (Table S1). However, a stronger correlation with mean 24-h systolic and diastolic blood pres- sure was seen in obstructive than central AHI (Figs. 2a, b).
Sleep characteristics
By definition, AHI was significantly lower in the no SDB group compared to the CSA and OSA groups (no SDB:
4 ± 2; CSA: 32 ± 22; OSA: 21 ± 7/h, p = 0.004) and the ratio of cAHI/AHI was > 50% in the CSA group and < 50% in the OSA group. The three groups were similar with respect to mean oxygen saturation, minimal oxygen saturation and time below SpO2 < 90% (Table 2).
Sphericity index
At baseline, sphericity index was similar across the three groups. Conversely, at 12-weeks, systolic and diastolic sphe- ricity index in the OSA group was significantly higher than in the no SDB group (0.21 ± 0.05 vs. 0.31 ± 0.07, p < 0.05;
0.31 ± 0.04 vs. 0.38 ± 0.05, p < 0.05; Table 3). Within 12 weeks after acute myocardial infarction, systolic spheric- ity index increased significantly in the OSA group compared to those without SDB, while patients with CSA exhibited a non-significant increase in systolic sphericity index (no SDB: − 0.03 ± 0.03; CSA: 0.01 ± 0.04; OSA: 0.05 ± 0.04, p = 0.002; Fig. 3). Similar results were observed in diastole (Fig. 3).
In an unadjusted linear regression model, an increase in obstructive AHI was significantly associated with
Table 1 Baseline characteristics
Data are expressed as n (%), or mean ± standard deviation, or median [interquartile range]
SDB sleep-disordered breathing, CSA central sleep apnoea, OSA, obstructive sleep apnoea, ACE angioten- sin-converting enzyme, ADP adenosine diphosphate, CK creatinine kinase, PCI percutaneous coronary intervention, NT-proBNP N-terminal probrain natriuretic peptide, TIMI thrombolysis in myocardial infarc- tion
No SDB
(n = 7) CSA
(n = 9) OSA
(n = 8) p value
Age, years 49 ± 10 57 ± 8 54 ± 8 0.234
Body mass index (kg/m2) 28 ± 3 27 ± 3 28 ± 3 0.571
Male gender, n (%) 7 (100) 7 (78) 7 (88) 0.411
Heart rate (beats/minute) 81 ± 22 77 ± 16 85 ± 14 0.683
Systolic blood pressure (mmHg) 131 ± 28 122 ± 18 132 ± 20 0.551
Diastolic blood pressure (mmHg) 86 ± 12 75 ± 9 80 ± 12 0.188
Median 24 h systolic blood pressure (mmHg) 106 ± 10 111 ± 17 122 ± 17 0.177 Median 24 h diastolic blood pressure (mmHg) 68 ± 10 70 ± 8 76 ± 9 0.322
NTproBNP (pg/ml) 1212 (745) 1939 (2281) 854 (2531) 0.497
Hypertension, n (%) 5 (71) 4 (44) 6 (75) 0.364
Current smoker, n (%) 5 (71) 5 (56) 3 (38) 0.760
Diabetes mellitus, n (%) 1 (14) 2 (22) 2 (25) 0.871
Hypercholesterolaemia, n (%) 0 (0) 3 (33) 1 (13) 0.192
Pain-to-balloon-time (min) 291 (1155) 283 (231) 1068 (998) 0.148
NSTEMI (%) 1 (14) 0 (0) 1 (12) 0.553
TIMI flow grade 0 pre PCI, n (%) 4 (57) 7 (78) 7 (88) 0.388
TIMI flow grade 3 post PCI, n (%) 6 (86) 9 (100) 8 (100) 0.282
Thrombus aspiration, n (%) 4 (57) 3 (33) 3 (38) 0.605
Glycoprotein IIb/IIIa Inhibitor, n (%) 3 (43) 7 (78) 5 (63) 0.359
CK pre-PCI (U/l) 174 (1491) 342 (286) 487 (1559) 0.578
CK max (U/l) 2074 (2380) 1222 (3746) 2308 (3637) 0.981
Infarct size (%) 24 ± 12 26 ± 14 23 ± 15 0.896
Fig. 2 a Scatter plot—mean baseline 24-h systolic blood pressure and obstructive/central apnoea-hypopnoea index. b Scatter plot—mean base- line 24-h diastolic blood pressure and obstructive/central apnoea-hypopnoea index
Table 2 Nocturnal respiration and hypoxaemia
Data are expressed as mean ± standard deviation; or median [interquartile range]
SDB sleep-disordered breathing, CSA central sleep apnoea, OSA obstructive sleep apnoea, cAHI central apnoea-hypopnoea index, oAHI obstructive apnoea-hypopnoea index, SpO2 oxygen saturation
*OSA vs. CSA p < 0.001, significant p values (p < 0.05) marked in bold No SDB
(n = 7) CSA
(n = 9) OSA
(n = 8) p value
Apnoea-hypopnoea index (episodes/h) 4 ± 2 32 ± 22 21 ± 7 0.004
cAHI/AHI (%) 51 ± 18 71 ± 12 22 ± 14 < 0.001*
AI/AHI (%) 32 ± 20 80 ± 12 42 ± 20 < 0.001*
Mean oxygen saturation (%) 92 ± 3 93 ± 2 94 ± 2 0.390
Minimal oxygen saturation (%) 86 ± 3 87 ± 4 85 ± 6 0.600
Table 3 Sphericity index
Data are expressed as mean ± standard deviation
SDB sleep-disordered breathing, CSA central sleep apnoea, OSA obstructive sleep apnoea, SI sphericity index
*pairwise comparison OSA vs. no SDB p < 0.05, significant p values (p < 0.05) marked in bold No SDB
(n = 7) CSA
(n = 9) OSA
(n = 8) p value
(ANOVA)
SI systolic baseline 0.24 ± 0.05 0.30 ± 0.08 0.26 ± 0.08 0.203
SI systolic follow-up 0.21 ± 0.05 0.31 ± 0.07 0.31 ± 0.07* 0.008
Delta SI systolic − 0.03 ± 0.03 0.01 ± 0.04 0.05 ± 0.04* 0.002
p value baseline—follow-up 0.090 0.673 0.004
SI diastolic baseline 0.32 ± 0.06 0.38 ± 0.07 0.33 ± 0.06 0.137
SI diastolic follow-up 0.31 ± 0.04 0.40 ± 0.07 0.38 ± 0.05* 0.013
Delta SI diastolic − 0.02 ± 0.05 0.02 ± 0.05 0.05 ± 0.04* 0.021
p value baseline—follow-up 0.325 0.366 0.005
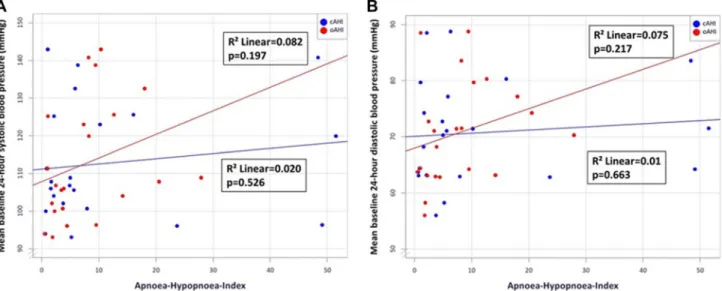
an increase in systolic sphericity index after 12-weeks follow-up, whereas an increase in central AHI was not (R2 = 0.231, p = 0.024; R2 = 0.012, p = 0.627; Fig. 4).
These findings were robust in a multiple regression model accounting for age, sex and BMI (p = 0.046; p = 0.492), or adjusting for TIMI flow pre-percutaneous coronary intervention, infarct size, pain-to-ballon-time and systolic blood pressure (p = 0.040; p = 0.385; Table 4). Consider- ing only apneas, the results were similar (Table 4).
Cardiac volumes
At baseline and follow-up, cardiac volumes were simi- lar between the three groups (Table S2). Changes in left ventricular end-systolic and end-diastolic index from base- line to 12-weeks follow-up were significantly higher in the OSA group compared to the no SDB group (− 17 ± 15%
vs. 11 ± 11%, p = 0.002; − 1 ± 13% vs. 15 ± 18%, p = 0.016, respectively). In contrast, the CSA group showed no sta- tistically significant differences compared to the no SDB group (− 6 ± 15% vs. − 17 ± 15%, p = 0.395; 2 ± 15% vs.
− 1 ± 13%, p = 0.467; Table 5). No significant differences were observed between groups for left ventricular mass index, stroke volume index or cardiac index (Table 5).
Wall thickness and left ventricular aneurysm
Reduction in wall thickness was similar between groups in end-systole (no SDB: − 0.06 ± 0.19; CSA: − 0.04 ± 0.25;
OSA: − 0.12 ± 0.20 p = 0.794) and end-diastole (no SDB:
− 0.18 ± 0.18; CSA: − 0.08 ± 0.13; OSA: − 0.28 ± 0.37;
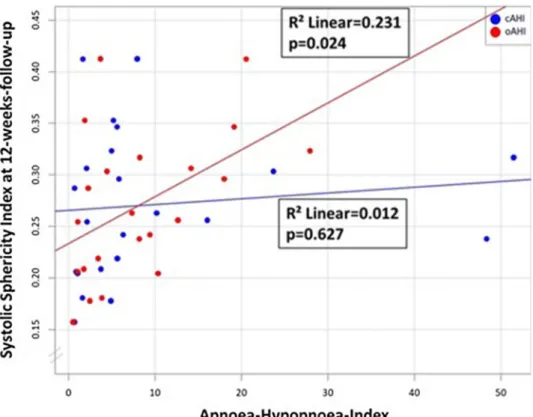
p = 0.362). Correlation between obstructive AHI and change in wall thickness in the infarcted area was not significant (Fig. 5a; R2 = 0.201 p = 0.054). Central AHI was not cor- related with a change in wall thickness (Fig. 5b; R2 = 0.002 p = 0.851). The frequency of left ventricular aneurysm was similar across groups [no SDB: 3 (43%); CSA: 6 (67%);
OSA: 4 (50%); p = 0.645].
Fig. 3 Bar chart of change in sphericity index from baseline to 12-weeks follow-up in systole and diastole. SDB sleep-disordered breathing, CSA central sleep apnoea, OSA obstructive sleep apnoea
Fig. 4 Scatter plot—spheric- ity index (systolic) 12 weeks after myocardial infarction and obstructive/central apnoea- hypopnoea index
Table 4 Regression analysis—
obstructive/central respiratory events and systolic sphericity index [× 102] 12 weeks after myocardial infarction
oAHI obstructive apnoea-hypopnoea-index, cAHI central apnoea-hypopnoea-index, oAI obstructive apnoea-index, cAI central apnoea-index, PCI percutaneous coronary intervention, TIMI thrombolysis in myocardial infarction
Significant p values (p < 0.05) marked in bold
Univariate analysis Multiple analysis Adjusted for age, sex and
BMI Adjusted for TIMI flow pre-PCI,
infarct size, pain-to-ballon-time, systolic blood pressure
B (95% CI) p value B (95% CI) p value B (95% CI) p value
oAHI 0.481
(0.068; 0.841) 0.024 0.459
(0.010; 0.858) 0.046 0.443 (0.021; 0.816) 0.040 cAHI 0.110
(− 0.179; 0.290) 0.627 0.187
(− 0.190; 0.379) 0.492 0.193 (− 0.134; 0.300) 0.385
oAI 1.460
(− 0.020; 2.940) 0.053 1.509
(− 0.258; 3.276) 0.089 1.991 (0.641; 3.340) 0.007 cAI 0.061 (− 0.174; 0.296) 0.594 0.102
(− 0.183; 0.388) 0.460 0.101 (− 0.129; 0.332) 0.366
Table 5 Percentage change in cardiac volumes
Data are expressed as mean percentage change from baseline ± standard deviation
SDB sleep-disordered breathing, CSA central sleep apnoea, OSA obstructive sleep apnoea, LV left ventricu- lar
Indexed to body surface area an = 1 in OSA missing, significant p values (p < 0.05) marked in bold, *pair- wise comparison OSA vs. no SDB p < 0.05
No SDB
(n = 7) CSA
(n = 9) OSA
(n = 8) p value
(ANOVA)
LV mass index − 17 ± 14 − 19 ± 15 − 14 ± 12 0.700
LV end-systolic volume index − 17 ± 15 − 6 ± 15 11 ± 11* 0.002
LV end-diastolic volume index − 1 ± 13 2 ± 15 15 ± 18* 0.019
Stroke volume index − 1 ± 18 13 ± 20 24 ± 31 0.163
Cardiac indexa − 9 ± 13 4 ± 26 11 ± 32 0.344
Fig. 5 a Scatter plot—change in wall thickness in systole in infarcted area 12 weeks after myocardial infarction and obstructive apnoea- hypopnoea index. b Scatter plot—change in wall thickness in systole
in infarcted area 12 weeks after myocardial infarction and central apnoea-hypopnoea index
Discussion
This study provides unique insights into the association between SDB and spheric cardiac remodelling after acute myocardial infarction: firstly, in contrast to the no SDB and CSA groups, patients with OSA exhibited a significant increase in systolic and diastolic sphericity index within 12 weeks after acute myocardial infarction. Secondly, the number of obstructive apnoeas and hypopnoeas was posi- tively correlated with systolic sphericity index, whereas the number of central apnoeas and hypopnoeas was not. Data were robust after multiple regression analysis accounting for demographics and risk factors for spheric remodelling after acute myocardial infarction. Thirdly, no significant association between wall thickness, formation of cardiac aneurysm and SDB was observed.
To our best knowledge, an association between SDB in general and post-infarction spheric cardiac remodelling, measured by sphericity index, has not previously been described. After STEMI, up to 66% of patients are affected by OSA [23] and 12% by CSA [24]. Previous analyses in patients with acute myocardial infarction have revealed that the increase in systolic and diastolic left ventricular volumes is more pronounced in patients with SDB com- pared to those without. In patients with SDB no differ- ences between OSA and CSA were observed [15]. Left ventricular function is diminished in both CSA and OSA patients after STEMI compared to patients without SDB [25–27] and an improvement in AHI over time is asso- ciated with an improvement in left ventricular function [24]. In OSA patients without acute myocardial infarction, higher AHI values are associated with increased cardiac wall thickness [28]. Data from patients with CSA are lack- ing. Thus, previous research has identified negative post- STEMI remodelling of the left ventricle in SDB. However, spheric remodelling, which has additional prognostic value [8], has not been specifically addressed.
Effect size and potential clinical impact
The sphericity index can be used to detect cardiac remod- elling with 100% sensitivity and 90% specificity and is more accurate than left ventricular volumes and ejection fraction [22]. A threshold of 0.29 in diastolic sphericity index is associated with a higher probability of developing heart failure [7, 29]. In the current analysis, this pathologic threshold was considerably exceeded at baseline, indicat- ing clinically relevant spheric cardiac remodelling after myocardial infarction. Mannaerts et al. used 3D echocar- diography to detect a sphericity index of 0.32 in patients with cardiac remodelling after STEMI compared to 0.22
in patients without cardiac remodelling, which is in line with our findings using CMR [22].
A more spherical left ventricle, assessed by ventricu- lography, is associated with reduced capacity and dimin- ished ejection fraction. In addition, sphericity index is an independent predictor of survival in patients with coronary artery disease [30]. Survival after myocardial infarction is lower in patients with a higher sphericity index, which is used as a surrogate marker for congestive heart failure [8]. In this context, it is notable that the sphericity index increased considerably in our OSA cohort, which reflects potential detrimental effects on cardiac remodelling in this specific group of patients.
Pathophysiology
The main pathophysiological differences between the CSA and OSA patients are negative intrathoracic pressure swings in the OSA group due to breathing efforts against the occluded pharynx, elevated blood pressure in the OSA cohort and arousals [31].
Data indicate that OSA-associated negative intratho- racic pressure swings contribute to increased left ventricu- lar transmural pressure. In OSA patients with congestive heart failure, continuous positive airway pressure increases intrathoracic pressure [14], reduces left ventricular volume and left ventricular transmural pressure, impedes cardio- vascular complications and improves cardiac function [11, 32–34]. Similar data in patients with CSA are lacking.
Moreover, the analysis evaluating the association between obstructive apnoeas and sphericity index showed higher numeric beta coefficients (effect size) compared to the anal- ysis with obstructive apneas and hypopneas. This finding may underline, that in particular obstructive apnoeas and to a lower extend hypopnoeas may contribute to the intratho- racic negative pressure changes and might affect cardiac remodeling.
In addition, arousals from sleep may contribute to increased afterload and thus spheric cardiac remodeling. The association between the frequency of arousals may differ between obstructive and central respiratory events, because arousals occur in OSA to terminate apnoeas and activate pharyngeal muscles in order to re-open the occluded upper airways, while in CSA the association between arousals and respiratory events is modest [35]. In the present study we found a similar association between central and obstructive respiratory events with arousals from sleep (Figure S1a, b).
Activation of the sympathetic nervous system seems to be lower in CSA patients with congestive heart failure com- pared to those with OSA [36]. Several studies have revealed elevated blood pressure in OSA patients [37, 38]. This results in higher cardiac afterload and may lead to increased cardiac remodelling and a consequent deterioration in left
ventricular mechanics [39]. In contrast, CSA has a rela- tively weak influence on blood pressure [12]. Our study also observed that higher blood pressures are more strongly associated with the severity of OSA, rather than CSA.
Thus, the increased left ventricular transmural pressure (negative intrathoracic pressure swings plus increased arte- rial blood pressure) in OSA patients, but not in CSA patients, may promote spheric cardiac remodelling and thinning of the left ventricular wall in the region of the myocardial infarction. Accordingly, in the present analysis, sphericity index is correlated with the quantity of obstructive apnoeas and hypopnoeas, but not central apnoeas and hypopnoeas.
These results are robust, even after accounting for potentially confounding clinical factors such as age, sex and BMI.
The prevalence of sleep apnoea after myocardial infarc- tion is high (approximately 54%) [40]. Within 12 weeks after myocardial infarction, the recovery of cardiac function is associated with a reduction in sleep apnoea, whereas sever- ity of sleep apnoea is not changed in patients with persis- tent limited cardiac function [40]. Therefore, sleep apnoea should be re-evaluated when cardiac function changes.
Limitations
The results from this sub-analysis must be interpreted in the light of several limitations. The sample size is rela- tively small, since only patients with infarcted left anterior descending artery were included. Furthermore, cardiac aneu- rysm is a rare event. However, the selected sample is appro- priate considering that sphericity index was first evaluated in patients with anterior wall myocardial infarction. A direct causal relationship cannot be inferred due to the observa- tional nature of the study design. Neither intrathoracic pres- sures nor oesophageal pressures were recorded to quantify the postulated negative intrathorathic pressure swings during obstructive apneas [31]. Larger, prospective, randomised tri- als are now required to verify these findings. Further data will be generated by the interventional TEAM-ASV I study (NCT02093377, adaptive servoventilation versus control in patients with acute myocardial infarction and sleep-disor- dered breathing).
Conclusion
In contrast to CSA and no SDB, OSA is associated with spheric cardiac remodelling within the first 12 weeks after acute myocardial infarction. Data suggest that OSA-related negative intrathoracic pressure swings may contribute to spheric cardiac remodelling after acute myocardial infarc- tion. Findings add an argument that differentiation of OSA and CSA is needed in patients with acute myocardial infarction.
Acknowledgements Open Access funding provided by Projekt DEAL.
The authors thank Astrid Brandl-Novak, Astrid Braune, Ruth Luigart and Katja Ziczinski for their excellent assistance.
Authors contributions SB and MA were responsible for conceiving and designing the study and its hypotheses, acquiring study funding, collecting, analysing and interpreting the data, and writing and revising the manuscript prior to submission. CF and KG were involved in the collection, analysis and interpretion of data, and were responsible for drafting and revising the manuscript prior to submission. AH, KD, SS, OWH, FP and CF were involved in the colletion and interpretation of data and critical revision of the manuscript prior to submission. FZ was involved in data analysis and critical revision of the manuscript prior to submission. LSM and MP were involved in the interpretation of data and critical revision of the manuscript prior to submission.
Funding The study was funded by Resmed (Martinsried, Germany), Philips Respironics (Murrysville, PA, USA), and the Faculty of Medi- cine of the University of Regensburg, Germany.
Compliance with ethical standards
Conflict of interest Michael Arzt receives grant support from Resmed (Martinsried, Germany), ResMed Foundation (La Jolla, CA, USA) and Philips Respironics (Murrysville, PA, USA). Michael Arzt has previ- ously received lecture fees from Philips Respironics (Murrysville, PA, USA) and Resmed (Martinsried, Germany). Christoph Fisser, Kristina Götz, Andrea Hetzenecker, Kurt Debl, Andreas Luchner, Florian Ze- man, Stefan Stadler, Okka W Hamer, Florian Poschenrieder, Claudia Fellner, Lars S Maier, Michael Pfeifer and Stefan Buchner have no conflicts of interest to declare.
Open Access This article is licensed under a Creative Commons Attri- bution 4.0 International License, which permits use, sharing, adapta- tion, distribution and reproduction in any medium or format, as long as you give appropriate credit to the original author(s) and the source, provide a link to the Creative Commons licence, and indicate if changes were made. The images or other third party material in this article are included in the article’s Creative Commons licence, unless indicated otherwise in a credit line to the material. If material is not included in the article’s Creative Commons licence and your intended use is not permitted by statutory regulation or exceeds the permitted use, you will need to obtain permission directly from the copyright holder. To view a copy of this licence, visit http://creat iveco mmons .org/licen ses/by/4.0/.
References
1. Ibanez B, James S, Agewall S, Antunes MJ, Bucciarelli-Ducci C, Bueno H, Caforio ALP, Crea F, Goudevenos JA, Halvorsen S, Hindricks G, Kastrati A, Lenzen MJ, Prescott E, Roffi M, Valgimigli M, Varenhorst C, Vranckx P, Widimský P (2018) 2017 ESC Guidelines for the management of acute myocardial infarction in patients presenting with ST-segment elevation: the task force for the management of acute myocardial infarction in patients presenting with ST-segment elevation of the European society of cardiology (ESC). Eur Heart J 39:119–177. https ://doi.
org/10.1093/eurhe artj/ehx39 3
2. Mills NL, Everson CT, Hockmuth DR (1993) Technical advances in the treatment of left ventricular aneurysm. Ann Thorac Surg 55:792–800
3. Nicolosi AC, Spotnitz HM (1988) Quantitative analysis of regional systolic function with left ventricular aneurysm. Circu- lation 78:856–862
4. Di Donato M, Dabic P, Castelvecchio S, Santambrogio C, Branko- vic J, Collarini L, Joussef T, Frigiola A, Buckberg G, Menicanti L (2006) Left ventricular geometry in normal and post-anterior myocardial infarction patients: sphericity index and ‘new’ conicity index comparisons. Eur J Cardiothorac Surg 29(Suppl 1):S225–
S230. https ://doi.org/10.1016/j.ejcts .2006.03.002
5. Fan H, Zheng Z, Feng W, Zhang Y, Jin L, Li P, Hu S (2010) Api- cal conicity ratio: a new index on left ventricular apical geometry after myocardial infarction. J Thorac Cardiovasc Surg 140(1402–
7):e1–3. https ://doi.org/10.1016/j.jtcvs .2010.02.017
6. Shen WF, Tribouilloy C, Mirode A, Dufosse H, Lesbre JP (1992) Left ventricular aneurysm and prognosis in patients with first acute transmural anterior myocardial infarction and isolated left anterior descending artery disease. Eur Heart J 13:39–44 7. Lamas GA, Vaughan DE, Parisi AF, Pfeffer MA (1989) Effects
of left ventricular shape and captopril therapy on exercise capac- ity after anterior wall acute myocardial infarction. Am J Cardiol 63:1167–1173
8. Wong SP, French JK, Lydon A-M, Manda SOM, Gao W, Ashton NG, White HD (2004) Relation of left ventricular sphericity to 10-year survival after acute myocardial infarction. Am J Cardiol 94:1270–1275. https ://doi.org/10.1016/j.amjca rd.2004.07.110 9. Berry RB, Budhiraja R, Gottlieb DJ, Gozal D, Iber C, Kapur VK,
Marcus CL, Mehra R, Parthasarathy S, Quan SF, Redline S, Strohl KP, Davidson WSL, Tangredi MM (2012) Rules for scoring res- piratory events in sleep: update of the 2007 AASM manual for the scoring of sleep and associated events. Deliberations of the sleep apnea definitions task force of the American academy of sleep medicine. J Clin Sleep Med 8:597–619. https ://doi.org/10.5664/
jcsm.2172
10. Rutherford R, Xie A, Malone S, Liu PP, Douglas Bradley T, Holloway R (1991) Obstructive sleep apnoea in patients with dilated cardiomyopathy: effects of continuous positive airway pressure. Lancet 338:1480–1484. https ://doi.org/10.1016/0140- 6736(91)92299 -H
11. Tkacova R, Rankin F, Fitzgerald FS, Floras JS, Bradley TD (1998) Effects of continuous positive airway pressure on obstructive sleep apnea and left ventricular afterload in patients with heart failure.
Circulation 98:2269–2275
12. Bradley TD, Floras JS (2003) Sleep apnea and heart failure: part II: central sleep apnea. Circulation 107:1822–1826. https ://doi.
org/10.1161/01.CIR.00000 61758 .05044 .64
13. Yumino D, Kasai T, Kimmerly D, Amirthalingam V, Floras JS, Bradley TD (2013) Differing effects of obstructive and central sleep apneas on stroke volume in patients with heart failure. Am J Respir Crit Care Med 187:433–438. https ://doi.org/10.1164/
rccm.20120 5-0894O C
14. Naughton MT, Rahman MA, Hara K, Floras JS, Bradley TD (1995) Effect of continuous positive airway pressure on intratho- racic and left ventricular transmural pressures in patients with congestive heart failure. Circulation 91:1725–1731
15. Buchner S, Satzl A, Debl K, Hetzenecker A, Luchner A, Husser O, Hamer OW, Poschenrieder F, Fellner C, Zeman F, Riegger GA, Pfeifer M, Arzt M (2014) Impact of sleep-disordered breathing on myocardial salvage and infarct size in patients with acute myocar- dial infarction. Eur Heart J 35:192–199. https ://doi.org/10.1093/
eurhe artj/eht45 0
16. Buchner S, Eglseer M, Debl K, Hetzenecker A, Luchner A, Husser O, Stroszczynski C, Hamer OW, Fellner C, Zeman F, Pfeifer M, Arzt M (2015) Sleep disordered breathing and enlargement of the right heart after myocardial infarction. Eur Respir J 45:680–690.
https ://doi.org/10.1183/09031 936.00057 014
17. Greimel T, Buchner S, Arzt M (2013) Recovery of left ventricular function and sleep apnoea after acute myocardial infarction. Eur Respir J 42:293–294. https ://doi.org/10.1183/09031 936.00000 313 18. Fisser C, Marcinek A, Hetzenecker A, Debl K, Luchner A, Sterz
U, Priefert J, Zeman F, Kohler M, Maier LS, Buchner S, Arzt M (2017) Association of sleep-disordered breathing and disturbed cardiac repolarization in patients with ST-segment elevation myo- cardial infarction. Sleep Med 33:61–67. https ://doi.org/10.1016/j.
sleep .2017.01.007
19. Randerath WJ, Treml M, Priegnitz C, Stieglitz S, Hagmeyer L, Morgenstern C (2013) Evaluation of a noninvasive algorithm for differentiation of obstructive and central hypopneas. Sleep 36:363–368. https ://doi.org/10.5665/sleep .2450
20. Arzt M, Oldenburg O, Graml A, Erdmann E, Teschler H, Weg- scheider K, Suling A, Woehrle H (2017) Phenotyping of sleep- disordered breathing in patients with chronic heart failure with reduced ejection fraction-the schlaHF registry. J Am Heart Assoc. https ://doi.org/10.1161/JAHA.116.00589 9
21. Cerqueira MD (2002) Standardized myocardial segmentation and nomenclature for tomographic imaging of the heart: a state- ment for healthcare professionals from the cardiac imaging committee of the council on clinical cardiology of the Ameri- can heart association. Circulation 105:539–542. https ://doi.
org/10.1161/hc040 2.10297 5
22. Mannaerts HFJ, van der Heide JA, Kamp O, Stoel MG, Twisk J, Visser CA (2004) Early identification of left ventricular remodelling after myocardial infarction, assessed by transtho- racic 3D echocardiography. Eur Heart J 25:680–687. https ://doi.
org/10.1016/j.ehj.2004.02.030
23. Lee C-H, Khoo S-M, Tai B-C, Chong EY, Lau C, Than Y, Shi D-X, Lee L-C, Kailasam A, Low AF, Teo S-G, Tan H-C (2009) Obstructive sleep apnea in patients admitted for acute myocar- dial infarction. Prevalence, predictors, and effect on microvas- cular perfusion. Chest 135:1488–1495. https ://doi.org/10.1378/
chest .08-2336
24. Tan L-L, Ting J, Balakrishnan I, Seneviratna A, Gong L, Chan MY, Tai ES, Richards AM, Tai B-C, Ling L-H, Lee C-H (2018) Sleep apnea evolution and left ventricular recovery after percu- taneous coronary intervention for myocardial infarction. J Clin Sleep Med 14:1773–1781. https ://doi.org/10.5664/jcsm.7394 25. Gessner V, Bitter T, Horstkotte D, Oldenburg O, Fox H (2017)
Impact of sleep-disordered breathing in patients with acute myocardial infarction: a retrospective analysis. J Sleep Res 26:657–664. https ://doi.org/10.1111/jsr.12540
26. Riedel O, Ohlmeier C, Enders D, Elsässer A, Vizcaya D, Michel A, Eberhard S, Schlothauer N, Berg J, Garbe E (2018) The con- tribution of comorbidities to mortality in hospitalized patients with heart failure. Clin Res Cardiol 107:487–497. https ://doi.
org/10.1007/s0039 2-018-1210-x
27. Omran H, Bitter T, Horstkotte D, Oldenburg O, Fox H (2018) Characteristics and circadian distribution of cardiac arrhythmias in patients with heart failure and sleep-disordered breathing.
Clin Res Cardiol 107:965–974. https ://doi.org/10.1007/s0039 2-018-1269-4
28. Koga S, Ikeda S, Nakata T, Yasunaga T, Maemura K (2012) Effects of nasal continuous positive airway pressure on left ventricular concentric hypertrophy in obstructive sleep apnea syndrome. Intern Med 51:2863–2868
29. Kono T, Sabbah HN, Stein PD, Brymer JF, Khaja F (1991) Left ventricular shape as a determinant of functional mitral regurgitation in patients with severe heart failure secondary to either coronary artery disease or idiopathic dilated cardiomyo- pathy. Am J Cardiol 68:355–359. https ://doi.org/10.1016/0002- 9149(91)90831 -5
30. Gomez-Doblas JJ, Schor J, Vignola P, Weinberg D, Traad E, Carrillo R, Williams D, Lamas GA (2001) Left ventricular
geometry and operative mortality in patients undergoing mitral valve replacement. Clin Cardiol 24:717–722. https ://doi.
org/10.1002/clc.49602 41106
31. Arzt M, Bradley TD (2006) Treatment of sleep apnea in heart failure. Am J Respir Crit Care Med 173:1300–1308. https ://doi.
org/10.1164/rccm.20051 1-1745P P
32. Albert NM, Lewis C (2008) Recognizing and managing asymp- tomatic left ventricular dysfunction after myocardial infarction.
Crit Care Nurse 28:20–37 (quiz 38)
33. Liu X, Feng L, Cao G, Huang H, Xu Q, Yu J, Zhang S, Zhou M (2014) Cardiac structure and function improvements in cor- onary artery disease combined with severe obstructive sleep apnea/hypopnea syndrome patients via noninvasive positive pressure ventilation therapy. Coron Artery Dis 25:516–520.
https ://doi.org/10.1097/MCA.00000 00000 00012 9
34. Malone S, Liu PP, Holloway R, Rutherford R, Xie A, Bradley TD (1991) Obstructive sleep apnoea in patients with dilated cardio- myopathy: Effects of continuous positive airway pressure. Lancet 338:1480–1484. https ://doi.org/10.1016/0140-6736(91)92299 -h 35. Ruttanaumpawan P, Logan AG, Floras JS, Bradley TD (2009)
Effect of continuous positive airway pressure on sleep structure in heart failure patients with central sleep apnea. Sleep 32:91–98 36. Spicuzza L, Bernardi L, Calciati A, Di Maria GU (2003) Auto- nomic modulation of heart rate during obstructive versus central
apneas in patients with sleep-disordered breathing. Am J Respir Crit Care Med 167:902–910. https ://doi.org/10.1164/rccm.20020 1-006OC
37. Kasai T, Bradley TD (2011) Obstructive sleep apnea and heart failure: Pathophysiologic and therapeutic implications. J Am Coll Cardiol 57:119–127. https ://doi.org/10.1016/j.jacc.2010.08.627 38. Peppard PE, Young T, Palta M, Skatrud J (2000) Prospective study
of the association between sleep-disordered breathing and hyper- tension. N Engl J Med 342:1378–1384. https ://doi.org/10.1056/
NEJM2 00005 11342 1901
39. Koshino Y, Villarraga HR, Orban M, Bruce CJ, Pressman GS, Leinveber P, Saleh HK, Konecny T, Kara T, Somers VK, Lopez- Jimenez F (2010) Changes in left and right ventricular mechanics during the Mueller maneuver in healthy adults: a possible mecha- nism for abnormal cardiac function in patients with obstructive sleep apnea. Circ Cardiovasc Imaging 3:282–289. https ://doi.
org/10.1161/CIRCI MAGIN G.109.90156 1
40. Buchner S, Greimel T, Hetzenecker A, Luchner A, Hamer OW, Debl K, Poschenrieder F, Fellner C, Riegger GAJ, Pfeifer M, Arzt M (2012) Natural course of sleep-disordered breathing after acute myocardial infarction. Eur Respir J 40:1173–1179. https ://doi.
org/10.1183/09031 936.00172 211