(A)PS a;
POLICY RESEARCH WORKING PAPER 2971
Short but not Sweet
New Evidence on Short Duration Morbidities from India
Jishnu Das
Carolina Sdnchez-Pdramo
The World Bank
Development Research Group Public Services
February 2003
Public Disclosure AuthorizedPublic Disclosure AuthorizedPublic Disclosure AuthorizedPublic Disclosure Authorized
POLIcy RESEARCH WORKING PAPER 2971
Abstract
India spends 6 percent of its GDP on health-three times classification of disease and are medically expected to the amount spent by Indonesia and twice that last less than two weeks. The authors show that short
of China-and spending on non-chronic morbidities is duration morbidities are important in terms of three times that of chroniic illnesses. It is normally prevalence, practitioner visits, and household health assumed that the high spending on non-chronic illnesses expenditure: Individuals report a short duration
reflects the prevalence of morbidities with high morbidity in one out of every five weeks. Moreover, one case-fatality or case-disability ratios. But there is little out of every three weeks reported with a short duration data that can be used to separate out spending by type of morbidity results in a doctor visit, and each week sick illness. Das and Sanchez-Paranio address this issue with a with such a morbidity increases health expenditure by 25 unique dataset where 1,621 individuals in Delhi were percent. Further, the absolute spending on short duration observed for 16 weeks through detailed weekly morhidities is similar across poor and rich income interviews on morbidity and health-seeking behavior. households. The authors discuss the implications of these
The authors' findings are surprising and contrary to findings In understanding household health behavior in the normal view of health spending. They define a new an urban context, with special emphasis on the role of class of illnesses as "short duration morbidities" if they information in health-seeking behavior.
are classified as non-chronic in the international
This paper-a product of Public Services, Development Research Group-is part of a larger effort in the group to understand health expenditures. Copies of the paper are available free from the World Bank, 1818 H Street NW, Washington, DC 20433. Please contact Hedy Sladovich, room MC3-3 11, telephone 202-473-7698, fax 202-522-1154, email address hsladovich@worldbatnk.org. Policy Research Working Papers are also posted on the Web at http://
econ.worldbank.org. The authors may be contacted at jdasl@worldbank.org or csanchezparamo@worldbank.org.
February 2003. (44 pages)
The Policy Research Working Paper Series disseninates the findiigs of ivork in progress to encourage the exchange of ideas about developnieit issues. An objective of the series is to get the findings ouit quickly, even if the presentations are less than fully polished. The papers carry the naoies of the authors and should be cited accordingly. The findings, interpretatiols. and conclusions expressed in this paper are entirely those of the authors. They do not necessarily represent the vieiv of the World Bank, its Executive Directors, or the counitries they represent.
Short but not Sweet:
New Evidence on Short Duration Morbidities from India.*
Jishnu Das TheWorld Bank jdas1l)worldbank.org Carolina Sfinchez-PAramo
TheWorld Bank
csanchezparamo@worldbank.org
'This study is part of an ongoing investigation on Morbidity and Illness Behavior in India, conducted by the Institute for Socio-Economic Research on Development and Democracy, Delhi, India, with funds from the Johns Hopkins University. Jishnu Das and Carolina SAnchez-PAramo also acknowledge financial support from the MacArthur Foundation and the Fundaci6n ICO respectively. The authors would like to thank Renu Addlakha, Abhijit Bancrjee, David Cutler, R. K. Das, Saumya Das, Veena Das, Jeff Hammer, Caroline Hoxby, Larry Katz, Michael Kremer, and Jeff Williamson for usefiil comments.
1 Introduction
India spends 6 per cent of its GDP on health, three times the amount spent by Indonesia or Philippines and twice the amount spent by China (World Bank, 1993). Based on existing ,urveys'
, 60 per cent of this expenditure is on primary care, otit of which households contriblute more than 80 per cent. Moreover, spending on non-chronic morbidity is three times that on chronic illnesses (Shariff, 1999).
It is normally assumed that the large proportion of expenditure devoted to non-chronic illnesses reflects the prevalence of morbidities with high case-fatality ratios (e.g. tuberculosis) or with high probability of leading to permanent disability (e.g. leprosy). However, existing data does not allow us to discern the pattern of spending, either by categories of chronicity, or by categories of severity. As a result, morbidities that do not exhibit high case-fatality or case-disability ratios have not received much attention in the literature2 . This may not be a matter for concern if such illnesses have little impact on the overall disease burden or on health expenditure. However, if individual behavior is based on self rather than clinical assessment of the severity of the illness, such morbidities could account for a large proportion of doctor visits and health expenditure. Limited survey data arising frorn small scale studies suggest that this is actually the case (Phadke, 1992;
Kumar, 1993).
In this paper we use unique data collected for 1,621 individuals in Delhi to provide a more detailed description of the patterns of morbidity and health seeking in the hidian urban context.
The focus of our exposition will be on a special class of illnesses, referred to as 'Short Duration Morbidities', that satisfy two criteria. First, they are classified as non-chroniic in the International Classification of Disease. Second, since this group still includes diseases like tuberculosis, through consultations with doctors3 wve select only those illnesses that are medically expected to last less than two weeks (e.g. 'viral fever' or 'minor allergies'). It is important to note that our construction of a short duration morbidity is based on the report of the individual and not the actual underlying sickness. Thus such a morbidity is likely to be an illness that the individual (and the practitioners treating the individual) believe to be non-chronic and of short duration. While the distinction between the underlyiing morbidity and the actual report is an importanit one, for now our reference
l National Sample Survey (1973-74), (Sarvekshana,1980), and an all-bidia survey conduicted by the National Council of Applied Economic Rcsearch, NCAER (Sharriff, 1999).
2 For example, it has been argued that the high frequency of self-reported symptoms in Indonesia indicates " many minor healtlh probleins that do not need expensive medical care or affect labor supply" (Gertler and Gruber, 1999).
3 S. Das, Harvard Medical School and Massachusetts General Hospital; A. l'aneja, Holy Family Hospital (Delhi);
K. Taneja, Holy Family Hospital (Delhi).
to a 'short duration morbidity' should be interpreted as the report of a short duration morbidity, and we return to the distinction between these two in Section 6 below.
We find that a large proportion of reported illnesses in our sample correspond to Short Duration Morbidities, and moreover such reported imorbidities account for a significant share of practitioner visits and health expenditure. In particular, 95 per cent of all non-chronic episodes and 90 per cent of all episodes reported during the sample period are Short Duration Morbidities, and these episodes account for 80 per cent of all practitioner visits and 57 per cent of private health expenditure.
Moreover poor individuals visit a practitioner more often and spend a larger share of their income on Short Duration Morbidities than the rich. This is specially surprising once we recognize that if health is a normal good and agents have access to the same information set, the gradient between health expenditure (as well as quality of health care sought) and income should increase with a decrease in the severity of the illness (on this, see Section 6 below). Our results on the frequency of visits and health expenditure by the poor hence argues for a more nuanced view of the health environment in Low Income Countries, where poor health outcomes are usually tnderstood to be a consequence of both the lack of access to health practitioners and the lack of economic
resources on the part of individuals.
The second part of our study then examines the incidence of Short Duration Morbidities (SDMs henceforth) using the longitudinal nature of our survey. Our interest in this section is to disaggregate further the impact of short duration morbidities on households- is it the case that there is a class of individuals/households that are particularly susceptible to such illnesses? Alternatively, is it the case that the bulk of doctor visits and expenditure are driven by a particular kind of morbidity or set of individual/hotusehold attributes?
Our findings show that SDMs tend to cluster at the level of the individual; that is, some individuals experience a large number of SDMs, while others report just one or Ino episodes at all.
Furthermore, while a significant part of this clustering can be explained by individual demographic characteristics, the commumity that the individual lives in plays an equally important role. While we do not offer an explanation at this stage of why this may be so, we hypothesize that community characteristics may be a proxy for the quality of the existing medical system.
This paper is the first step in a project on morbidity and health seeking behavior in India. As such, it has two objectives. Our first goal is to provide a detailed description of the morbidity profile of the area (with special emphasis on SDMs), and to present a thorough investigation of
the health environment we are dealing with. In doing so we discover a set of novel elements that lead us to rethink several (economic) issues related to health. Our second objective is to lay out a broad research agenda motivated by this findings. For this purpose, at the end of the paper we speculate on the way in which our results could potentially affect our understanding of the relationship between key economic and health variables, such as health seeking and labor market behavior.
The remainder of our paper is structured as follows. Section 2 and 3 provide an introduction to the institutional set up and the data. Section 4 establishes the importance of SDMs in our sample using three related measures: prevalence of, practitioner visits induced by, and expenditure associated with such morbidities. In Section 5, we show that SDMs tend to cluster at the individual level, even after controlling for observables, and that this phenomenon is directly correlated with expenditure clusters. Section 6 discusses the implications of the findings presented in the paper for the standard model of health seeking-behavior with well-informed, utility-maximizing individuals and Section 8 concludes.
2 Institutional Setup
Medical care in India is provided by both the public and the private sector. Government provision of health is based on a territorial model, with the urban sector catered to through the use of Government dispensaries (at the first tier) and hospitals. A consistent problem with government health services has been the lack of monitoring and proper incentives in the sector, resulting in crowed and poorly staffed facilities and tremeildous variation in the quality of services provided (Kamat, 1995). As a result households overwhelmingly use private sources of health care. Doctor visits in our saniple show a similar pattern, with the private sector accounting for more than 70%
of all visits.
Such ample use of the private sector, together with the lack of health insurance (less than 1 per cent of the population is insured), irnplies that 75 per cent of all health expenditures are met from out-of-pocket sources, with 46 per cent of this expenditure incurred on primary outpatient care.
This amount accounts for a high fraction of total household expenditure, varying from 2.9 per cent (Gujarat) to 7.2 per cent (Uttar Pradesh). Across expenditure quintiles, the proportion of income spent on health care increases sharply for the lower quintiles, as does the fraction of expenditure oIn primary as opposed to hospital care (Bermran, 1998; World Bank, 1997).
Combined with the low use of government resources is the lack of de facto regulation of phar- macies and practitioners. Poor pharmaceutical regulation implies that it is possible to buy most
medications over-the-counter (Kamat and Nichter, 1998; Saradamma et al., 2000). Similarly, the lack of regulation of practitioners has led to a proliferation of care-givers with varying qualifica- tions. Statistics based on the formal sector report only 0.7 doctors/1000 population (this includes public and private sector doctors), but once the informal sector4 is accounted for, this increases to between 2.5/1000 and 4/1000, a level comparable to that of Germany arid the US. The high density of pharmacies and practitioners is evident in the patterns of self-medication and the structure of the health market for our sample. For every household in our sample, there are at least 80 doctors and 5 pharmacies within a 15 minute walking distance, thus affording easy access to both health care providers and medicines.
3 Data
3.1 Methodology and Summary Statistics
Our study uses a 16 week panel of 1,621 individuals living in seven different localities in Delhi (In- dia). Five of these localities were initially chosen through informal contacts, while the remaining two were chosen using a health questionnaire administered in 6 schools of Delhi. In this question- naire households were asked, among other questions, if they would like to participate in a longer survey. Households which answered positively then served as an entry into these two communities5 In all seven localities households were chosen randomly. In particular, in each neighborhood a street was chosen at random, and every fourth household located on that street was asked to participate in the survey. Refusal rates were less than 4 per cent in all localities.
The survey methodology incorporates two innovations. First, the recall period for the survey was shortened from one month (as in the LSMS) to one week, enabling us to collect extremely accurate information on doctor visits, expenditure and medication. Hence, during the four month survey period, each household was samipled weekly (i.e. the interviewer visited each household on the same day each week) to collect quantitative as well as narrative information. Second, information was collected separately on chronic and non-chronic conditions. Chronic conditions were identified through initial interviews, and these were individually followed each week (for instance, someone reporting diabetes would be asked about the diabetes each week). Apart from chronic conditions, a general question ("Were you sick last week") was used to screen for other illnesses, and conditional on a positive response, questions were asked about the morbidity and resulting actions.
' The informal sector includes all medical practitioners who are not registered with any certifying authority (Non-Registered Medical Practitioners).
S B, Kheda, J. Puri, Noida, S. Vihar and K. Nagar were chosen through research contacts. P. Nagar and South Delhi were chosen through the administration of a general health questionnaire in different schools in Delhi.
4
In each week, the information from the previous week was summarized in a 'feedback form', and this was used by surveyors to follow up and link morbidities across weeks in the survey period.
In addition to the weekly questionnaires, basic demographic, facility and expenditure data was also collected for all households6 .
Given the structure of the data on morbidity in the sample, and since some illness episodes may last for more than a week, we use two different morbidity measures throughout the paper: sick- weeks and full episodes. To illustrate, consider the following hypothetical set of responses obtained over a three week period:
Week Were you sick? What illness did you have?
1 yes stoinachache
2 yes headache
3 yes headache
The information reported by this individual will be coded in two different ways. First we will record two full episodes, based on the observation that the individual reports one illness in week 1, and a different illness in weeks 2 and 3. Second we will also record three sick-weeks, corresponding to the number of weeks that the individual reports an illness episode. The main rationale for simultaneously using these two measures is that the latter is more efficient when dealing with within-episode dynamics (e.g. timing of doctor visits), while the former provides a better measure of the severity of the illness (e.g. in terms of duration and expenditure associated with the episode).
Following this definition, Table 2 shows that there were 3,324 full episodes (5,630 sick weeks) during the period of the survey with an average duration of 7.59 days7 .
3.2 Sample Characteristics
Summary statistics for all individuals (households) in the sample are presented in Table L.A (Table 11.B). Individuals in our sample tend to be young (with a median age of 22), poorly educated (50 per cent of all individuals are either illiterate or have less than primary education) and live in nuclear households with an average of 5.4 members per household. Regarding the labor force status of the individuals in the sample, about 50 per cent of those above 15 are employed, resulting in 1.5 income
6 The data was collected dulring the months of August-December of 2000 in the first four localities (wave 1), and during the months of January-April, 2001 in the last three localities (wave .2). While there is no period duirinlg the year when morbidity is expected to be higher than average, the nature of the morbidity profile does exhibit some seasonality. For instance, the monsoons occur during the summer months, increasing the risk of gastroenteritis, cholera, and malaria, while rain is scarce in the winter months, leading to numerous respiratory problems associated with high pollution levels.
7 Information on episode duration is missing for 221 SDM episodes out of total of 3,545 (6 per cent). Ninety per cent of these episodes were recorded for a maximum of 1-2 weeks.
earners per household, although only a third of them are in the formal sector (public and private)8
Table L.A also presents summary statistics by income groups9 . Per capita income among rich households (using the square root of the number of household ierribers as a deflator to account for potential scale economies) is more than three times that among poor households (Table 1.B).
Since both household size and the number of employed adults per household are similar across incomie groups, this variation in income levels is rmainly due to differences in the earning capacity of employed adults. As expected, average age and education are higher for the rich, who also enjoy better access to infrastructure facilities and sanitation systems such as flush toilets and piped water. Employment rates are not substantially different across income groups, but the composition of employment does vary with a higher incidence of public sector employment among the middle and upper income groups.
Anticipating the results of the paper, one of the issues that we will be concerned about is whether the sample that we have drawn is particularly biased towards high morbidity and/or health expenditures, compared to a representative sample of Delhi. Appendix I explores this issue is some detail through comparisons of our sample with that of the (Delhi) National Family Health (1993) and National Sample Survey (2000). The differences that emerge point towards a slightly younger population (with a one year difference in the mean age) and a greater density of households in the upper income groups for our sample. As the Appendix indicates, these differences do not appear to be large, and (assuming a positive relationship between income and health), should actually bias our results towards less morbidity than what is representative for Delhi as a whole.
4 How Important are Short Duration Morbidities?
4.1 Prevalence, Doctor Visits and Expenditures
One out of every five observations in the sample corresponds to a SDM report, with more than 75 per cent of all individuals and 95 per cent of households experiencing at least one SDM episode
8 The skewness of the age distribution towards younger groups (35 per cent of all individuiaLs are helow 15) implies that a large fraction of the sample has never been married (5( per cent) and that there are a substantial number of individuals of school-going age in the sample. For this reason we report the individual's actual education level for those above the age of 15, and the individual's mother's educationi level for those ages 0 to 15.
9 Followilg Filmer and Pritchett (???) household per capita income was contructed using information on the household assets to correct for problems associated with measurement error in reported income/consumption, the presence of outliers and differences in tastes across houselholds. In particular log per capita consumption expenditure (corrected to account for economies of scale in consumption at the household level) was regressed on a number of assets and indicator variables for access to different types of infrstructure and facilities. The coefficients from this regression were then used to predict consuimption expendituire for each household. This measure correlates strongly with reported household income, while mitigating the problems mentioned above.
during the 16 weeks of the survey. This translates into every household having one sick member every week or alternatively, that 20 per cent of all weeks are spent sick with an short duration morbidity among the individuals in our sample. The bulk of SDM episodes are either respira- tory (colds/coughs/allergies), musculo-skeletal (sprains/strains/minor injuries) or gastrointestinal (acidity or diarrhea) and last just over 7 days on average (Table 2). Moreover the report of a short duration morbidity is negatively correlated with income - 18 per cent of all weekly reports by the rich correspond to a SDM compared to 22 per cent for the poor, and 71 per cernt of rich individuals
report having been ever sick with a SDM compared to 82 per cent for the poor.
In itself, these results may not be surprising- given the short recall period and the frequency of visits, it is entirely likely that a number of 'minor' morbidities (such as a headache from work) are reported and these reports are uncorrelated to subsequent actions. However, a surprising finding is that the reports of such morbidities have real consequences, both in terms of doctor visits and health expenditure.
We find that individuals in the lowest income group make 0.12 weekly practitioner visits for SDM reports'o (i.e., one member of a household visits a doctor with a SDM every fortnight), while these numbers are 0.08 and 0.06 respectively for those in the middle and highest income groups (Table 3). Although poor people may be sick more often and thus visit the doctor more, when we condition on the occurrence of an SDM episode (contact rate), we find that the poor still visit a practitioner more often per sick-week than the rich" . In particular, 1 out of every 2.5 SDM weekly reports corresponds to a practitioner visit for the poor, while this number drops to only 1 out of every 3.3 for the rich. Similarly, the poor visit a practitioner in 1 out of every 2 SDM (full) episodes, while the rich do so in 1 out of every 2.7. The inverse relationship between income and health service use that we observe in the sample is further characterized by the following three observations:
1. This relationship is not a characteristic of the (observable) epidemiological profile across income groups. The relationship continues to hold even after we condition on type of illness (e.g. fever or respiratory conditions), duration of illness (e.g. illness that last less than 7 days) and interactions between the type and duration of illness (e.g. fevers that last less than 7 days).
2. Interestingly though, the higher number of visits by the poor does not correspond to greater use of overall health resources by the poor: recall froim our previous discussion that due to the 10 Where the term practitioner refers to government facilities, trained biomedical doctors, homeopaths, indigenous practioners, and untrained practitioners, but not pharmacies.
The difference is significant for a 99% confidence interval.
lack of pharmaceutical regulation, almost all medicines can be purchased over-the-counter, and as a consequence the pharmacy miay be used as a substitute for a practitioner visit12 Graph 2 shows that the incidence of self-medication is high and varies considerably across income groups with the rich self-medicating for SDM episodes (50 per cent of the time) far
more than the poor (30 per cent).
3. A third possibility is that this relationship arises due to differences in the use of public/private providers across income groups. Given the density of public providers and the very low cost, it could be that these visits are largely accounted for by the public sector, and thus have no associated expenditures for the poor. Although the poor do use public health resources more than the rich, higher contacts rates for the poor cannot be explained by high use of these resources. In fact approximately 70 per cent of the visits mnade by this group are to the private sector, with more than 45 per cent to private doctors in the formal sector alone. The high number of visits to the private sector impact directly on expenditure, as detailed below.
Expenditure on SDMs represents a high share of overall spending and tends to be regressive in nature. Individuals in the sample spend an average of Rs.25.5 on SDMs each month, which accounts for 46 per cent of total rrontlhly expenditure on health (Table 4.A). This translates into an alnual per capita expenditure on SDMs of Rs.306. The bulk of expenditure is accounted for by medication (65 per cent)13 , followed by consultation fees and diagnostic tests (20 and 4 per cent, respectively). Itansportation costs are almost niegligible (2 per cent) witlh most people visiting practitioners located near their homes.
When we examine differences in expendittire on SDMs hy income groups, it becomes apparent that the poor spend relatively more than the rich on these episodes. In particular, poor individuals spend an average of RIs.24.5 per month on SDMs, or 75 per cent of their monthly health expenses, compared to Rs.26.0 (37 per cent) for the middle income group and Rs.27.1 (40 per cent) for the rich. In this respect it is important to notice that high expenditure oII SDMs by the poor is not driven by abnormally high expenditiures on the part of a few individuals compared to other income groups: Graph 2 shows that the distribution of expenditure on SDMs is fairly similar across the three income groups.
12 Medication (and advice) obtained in this malner is recorded in oiur data as 'self-medication'. Self-medication
refers to both genuine self-medication (85 per cent of all self-medication events) and chemist prescription ('chemist as doctor', 15 per ceiit). Genuine self-medication mainly results from the use of an old prescription (37 per cent), prior knowledlge (combined with a positive experience) of the medicine (31 per cent) or advice hy a family nmemnber (20 per cent).
13 Because a large fraction of practioners also dlispense me(licines (60 per cent), the cost of these may sometimes reflect consultation fees as well.
If we examine instead SDM expenditure at the household level, the numbers are equally striking.
Poor households spend on average roughly the same amount on SDMs as rich households (Rs.130- 140/month), while they report much lower health and overall expenditure levels than the rich.
This implies that poor families are spending a significantly larger fraction of their health and overall budgets on SDMs than rich ones. Specifically expenditure on SDMs represents 70 per cent of total health expenditure and 3.3 per cent of total expenditure in poor households, whereas these numbers are 40 and 1 per cent respectively in rich households. The results oii SDM expenditure are particularly stark when compared to other human capital investments: the median monthly expenditure on SDMs represents 85 per cent of the median outlay oII education for the average household in the sample, while this number is 200 per cent and 10 per cent for the poor and rich households respectively- a striking difference.
Further, the expenditure on short duration morbidities arises due to the high spending on a number of exceptionally severe episodes combined with the frequent occurrence of small outlays on such morbidities throughout the survey period. To elaborate further on this point it is instructive to decompose the expenditure on SDMs by individuals into two separate components- expenditure that is driven by the incidence of an episode, and expenditure that is driven by the duration of an episode. In addition to providing more detail on the structure of spending, this exercise also addresses the concern that the large number of SDM reports we find is a product of our methodology- under this hypothesis, 'real' expenditure is driven by a few, severe episodes, with the bulk of SDM reports resulting in very little spending.
We thus estimate the following model:
Y= + /Xi + yEpi + dduri + -i
ei iid -N(O, ai)
where yi is the per capita log of expenditure on SDMI4 , Xi is a matrix of demographic variables including gender, age, income and education, Epi is the number of SDM episodes reported by each individual during the sampling period, duri is the average duration of a SDM episode, and Ei is an individual specific error term.We find that the coefficients on both the number of full SDM episodes and average duration of the episode (-y and 6 above) are positive and significant (not reported), suggesting that expenditure on SDMs is indeed driven by both the duration of the illness and the
4 A formal test establishes the normality of the distribution of log expenditure
absolute number of reported episodes. 15
The evidence presented so far shows that SDMs are integral to the health status of the in- dividuals in our sample: they contribute significantly to the morbidity burden and account for a large proportion of doctor visits and expenditure. Moreover, SDMs impact differentially on income groups, with the poor spending significantly higher shares of income and their overall health budget than the rich. These results are especially surprising if we think of SDM's as illnesses that are fairly frequent and are associated with a list of common medicines that cani be used to alleviate symptoms or provide relief. The different mix of actions across income groups- with the rich using chemists to purchase their own medicine and the poor visiting doctors for their treatment- has important consequences for expenditures and seems to poilnt towards systematic differences in the information available to different incoiiie groups.
Before exploring this topic in greater detail below, it is instructive to fiurther decompose the incidence of SDMs in our sample. Is it tile case that SDMs impact certain individuals/households more than others? In the next section we concentrate on these questions through an examination of the temporal dimensioii of illness making use of the longitudinal nature of our survey.
5 SDMs: Incidence Patterns
There are 1,621 individuals in our sample, out of whom 76 per cent ever report a SDM. Since a total of 3,545 full SDM episodes are recorded, the number of episodes per capita is 2.20, and the number of episodes per sick individual is 2.87. However, the experience of a large number of sick individuals differs substantially from this average morbidity profile'. In particular, some individuals suffer a large niumber of SDMs, while others only report a single episode. A useful typology to facilitate this analysis is the division of individuials into three types:
* Type I : Individuals who report no SDM episodes
* Type II: Individuals who report one or two episodes
* Type III: Individuals who report more thani two episodes
The choice of two SDM episodes as the cut-off value between Type II and Type III is motivated by two observations. First, more than 60 per cent of all individuals in the sample suffer two or
15 This finding is also iniportant because it provides an argminent for using self-reported morbidity as the variable of interest when the actions we are trying to explain are related to the perception of the illness rather than to an inderlying clinical conrlition even thouglh the 'self-report' may measure the 'true' clinical morhidity with error (see Johansson, 1991 or Dow et al. 1997).
fewer SDM episodes, and (ii) the average number of SDM episodes per individual is 2.19 Moreover it is important to notice that under this classification, even a Type II ildividual could spend a substantial portion of her time sick during the survey period. The distribution of subjects across types is then as follows: 26 per cent are Type I, 38 per cent are Type II and 36 per cent are Type III..
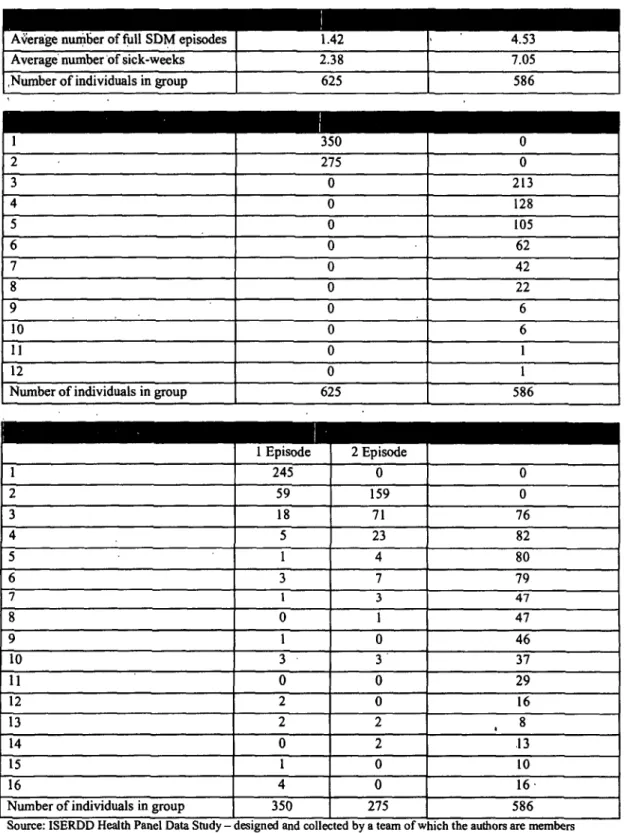
Within this particular classification, morbidity profiles are quite different across types. Type II individuals experience 1.42 SDM episodes and spend 2.38 weeks sick on average, compared to 4.53 and 7.03 respectively for Type III individuals (Table 5). Further Type II individuals use 1.28 different diagnostic categories, and this increases to 3 diagnostic categories for the Type III subjects. Thus, it appears that there are three broad categorizations of individuals: those who report no illness at all., those who report one or two episodes that are different in nature, and those who seem to be affected by a combination of different illnesses, some of which recur over time.
Given its important implications in terms of both health status and expenditure, the question thern arises as to what explains the differences in the incid.ence of SDMs at the individual level.
To what extent is this polarizatioii a result of demographic and infrastructure characteristics as opposed to randormt incidence patterns? The exercise below shows that while demographics are important in understanding the origin of SDM incidence, other factors that may constitute the 'health-environment' and the 'health-market' play an equally significant role.
In order to check for (observable) differences across the three types, sample proportions by type are presented in Table 6. Individuals of Type III suffer from chronic illnesses more than those of Type I and II, and have a greater share of women and young children. As a result, a larger fraction of individuals in this group are out of the labor force or in the informal sector. Finally, we also find differences across the households where individuals from different groups live. In particular, Type III individuials are overrepresented among the poor and in certain areas, and they tend to inhabit households where in-house piped water and flush toilets are less common (Table 6.B).
To disentanigle the effect and relative irmportance of these different factors, we then model the occurrence of a SDM episode as a Poisson distribution so that the probability that individual i experiences a certain number y of SDM episodes is:
Pr(yJIs)=e- p for Vy = 0,1, 2...N and
pi = E(yi4xi) = exp(xiB)
where xi represents a set of individuial ils characteristics. For the purpose of the estimation we construct four groups of individual characteristics (demographic characteristics, household income, access to water and sanitation, and area of residence), and introduce them sequentially into the model. Table 7 presents the results from the four models generated by this exercise.
The first model containing the demographic characteristics of the individual confirms to a large extent the impressions we had derived from the sample proportions. Women and those who suffer frorn a chronic condition appear to be mnore likely to experience a higli number of SDM episodes, and so do married individuals, younig children and those who are out of the labor force. Education, measured as having completed at least primary school, does not seem to have a strong effect on morbidity however. These results are fairly robust to different model specifications, especially the results concerning gender. marital status and age.
Model 2 incorporates income and Model 3 introduces inforiiiation about household sanitation infrastructure and access to (clean) water. While income is negatively and significantly correlated with the ntmber of reported SDM episodes in Model 2, this correlation disappears once we introduce the facilities variables. To explore this point Table 8 presents data on sanitation infrastructuire and access to water by income levels, making it clear that both the presence of a flilsh toilet and running water in the houselhold are strongly correlated with income helnce makinlg these two sets of variables highly multicollinear6 .
Finally Model 4 includes area-of-residence indicators together with the demographic and income variables. Because potentially we could aLso encounter a multicollinearity problem between area of residence and income if neighborhoods in the survey were very homogenous. Table 8 also presents the distribution of incomrie in all seven localities. We feel that there is substantial variation in income both within and across areas to justify the conclusion of both income and area variables in the regression, and although the effect of income disappears once we control for area of residence it is important to notice that the locality-specific effects are not a direct reflection of the locality's average income level (e.g. Noida. the second poorest community, enters the regression with a significant negative coefficient, larger in magnlitude than those of other 'better-off' localities).
The full model then presents a world in which SDM clustering is mainly a function of the individual's gender, age and marital status, as well as of her labor force status and area of residence.
While the interpretation of the demographic variables is fairly straight forward, the question arises as to what exactly are the community indicators capturing. Based on our knowledge of these areas
The hypothesis that both infrastricttire indicators are not significantly differ ent from zero when a niodel inciliding these indicators as well as income is estimated cannot he rejected at the 5 per cent confidence level.
and on some preliminary evidence regarding health practitioners and their practices generated by a practitioner survey that is currently being administered in these same localities, we would like to argue here that to a large extent these indicators are capturing the effects of the 'health environment', or.more precisely the 'health market', in which different individuals operate'7 _ an issue that we explore in more detail in the next section usiIng qualitative information (narratives and case studies) collected during the survey period.
This concludes our documeiitation of the importance of SDMs, both in terms of the population's morbidity profile and the expenditure they generate. Two key features emerge from our discussion:
(i) SDMs are extremely important in terms of prevalence, as well as doctor visits and expenditure and, (ii) the incidence of SDMs is affected both by demographic characteristics of the sample as well as 'environmental' factors captured by commtnity fixed effects.
6 Discussion
The picture of morbidity and health seeking behavior that we have constructed so far is very different from what is normally encountered. For instance, approximately 40 per cent of our sample would have reported 'yes' to the question "Did you have at least one SDM episode in the last month?"' 8 which is more than 300 per cent higher than that reported by the National Center for Applied Economic Research (NCAER) for all India (400 versus 122). Siunilarly, expenditures on SDMs alone are 250 per cent higher than that reported by the NCAER survey for all India, and more than 150%
higher than all medical expenditures reported by the Nation Sample Survey (NSS) in Delhi. Our discussion focuses on two aspects of these findings. First, we exanine if the exceptional use of health resources for SDMs is a facet of our sample rather than of the health environment in Delhi.
Second (if the picture of health behavior that we have constructed is in some sense 'representative' of the population of Delhi) we discuss what the implications of these findings are for the economics of health care in the urban context for a low-income country.
To an extent, doubts about the nature of our sample are mitigated by the close fit between the observable characteristics of our sample with that of the NSS (Figure 3) in Delhi (particularly the kernel densities of health expenditure based on the budget questionnaire) and this leads us to think that the differences that have emerged are largely due to the two characteristics specific to our dataset (the separation of chronic and acute reports, and the short recall period) that have not been replicated thus far by other surveys.
17 By the term 'health environment' we imply both failures of the medical system represented by poor doctor practices as well as patient behavior, such as inability to comply with medical regimes.
18 The qnestion reproduces the format of the NCAER survey, which uses a monthly recall questionnaire.
Preliminary evidence that this is indeed the case1 9 follows from a simple counter-factual exercise where we ask what morbidity profile would arise from our data if we imposed the restrictions inherent in other available surveys2 0 . Although this exercise is fraught with difficulties since we cannot identify the behavioral changes that result from a change in the recall period2l , we find that the accounting of explicit restrictions in themselves yields significant insights.
For this purpose we consider two types of restrictions frequently imposed in those question- naires: (i) the number of episodes that can be reported by each individual is restricted to one (all questionnaires except NSS), and (ii) an illness is usually recorded only if it resulted in the loss of work (NCAER, SLC). When these restrictions are applied to our dataset the number of SDM reports decreases sharply2 2 . Only 75 per cent of the SDM episodes reported in our survey would have been recorded had we restricted ourselves to one episode per individual per month, while this number would have beeil around 10-15 per cent had we recorded exclusively those episodes that caused the individual to lose at least one day of work. Finally the adoption of both criteria simultaneously would have resulted in less than 8 per cent of the SDM episodes being recorded.
While this does provide some evidence that the nature of questions used in standard health surveys severely underestimates the incidence of SDMs, our suspicion is that the length of the recall period has an equally important role. Subsequent waves of data for the sarme sample that were collected on a monthly recall basis will allow us to examine this issue with greater clarity in the near future. If we then propose that the differences in our data arise not from the nature of the sample, but from differences in the methodology, what are the implications of these findings for our understanding of the health environment?
6.0.1 Implications for the Economics of Urban Health
Consider a standard model, as in Gertler and Van Gaag (1992), where ildividuals choose from a number of options to maximize their utility. Following the Gertler-Van Gaag specification, let there by n options. i = 1, 2,, ,,n, and let each option be indexed by two attributes, {pi, qi} where p and q are respectively the price and quality of attribute i. Further, let an individuals utility be given by Uj(Cj, H,w, I) where Cj = Yj- is the consumption net of expenditure on health care, H is
'9 This section is based on Jishnu Das & Carolina Sanchez "Self-Reported Morbidity Questionnaires: Reporting Issues and Design Issues", 2002 mimeo.
20 For India we consider the following surveys: NCAER, SLC - Survey of Living Conditions (World Bank) and LSMS - Living Standards Measurement Survey (World Bank).
21 This is particularly troublesome if most illnesses are 'minor' as seems to be the case in our sample.
22 Comparisons were done on a monthly basis so that numbers arising from our sample were comparable to those from the standard surveys.
the utility derived from good health, w is a state variable indicating the type of morbidity and I is the information available to individual j.
If Uj (Cj, Hfw, I) is quasiconcave in its two arguments (conditional on the illness and informa- tion) and individuals choose i to max Uj(.), the following two claims follow immediately:
Claim 1 For the same illness and the same information set, richer indrividuals will choose higher quality (and more erpensive) treatment options
Claim 2 The quality-income gradient will increase wbith a decrease in the severity of the illness, H.
The intuition for both claims follows from the quasiconcavity of U(.)- richer individuals will care more about the health costs of an illness than the poor, and will thus choose better quality options. Moreover, this difference must be greater for less severe illnesses since the loss from ill health is smaller, and hence, the marginal loss of utility from higher priced treatment options is accentuated at lower level of incomes. In other words, it is likely that a rich and a poor individual who suffer from a fracture visit high quality treatment options, but unlikely that a poor individual chooses a very high quality treatment option for a self-limiting cold relative to the rich.
The behavior across income groups in our sample however, is exactly the opposite of what would be predicted by this theory with poor individuals spending inordinately high amounts on 'minor' morbidities compared to the rich. Given the general formulatioii above, and noting that the claims hold once we condition on w and I, there could be two different broad hypothesis for this behavior.
The first hypothesis is that even within SDMs, the epidemiological profiles that we observe are very different for the rich and the poor- the results we obtain do not condition on the illness, w.
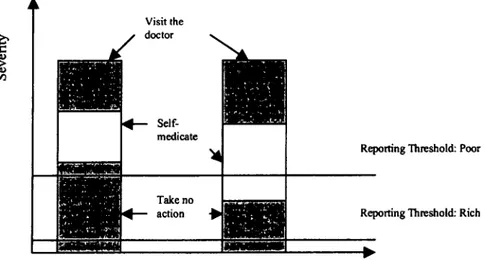
The inherent problem of not observing the underlying sickness (often referred to as the problem of 'differing reporting thresholds') is shown in the figure below: Due to the nature of the disease profiles and the reporting thresholds, the rich are observed to self-medicate more and visit doctors less than the poor, but once we condition on the illness, the gradient between incomne and quality is restored.
To an extent the problem of differing thresholds cannot be addressed due to the intrinsic nature of the problem: while it may be possible to say that one individual has a compound fracture (more severe) and another has a simple fracture (less severe), it is more difficult to claim that one person's headache is more or less severe than others. Given that over 50 per cent of the symptoms and diagnosis in our profile represent exactly those cases where the severity must be
Visit the
i> doctor
Self-_
medicate
Reporting Threshold: Poor
_ Take no _
action + Reporting Threshold: Rich_
Income
Figure 1: Reporting Thresholds and Income
self reported (pain, anxiety and weakness are three major categories), the problem of different reporting thresholds must remain, to some degree, unresolved.
However, we note that the relationships that we observe regarding quality and income remain robust to observable differences in morbidities: lower income groups choose higher quality choices (doctors vs. self-medication) even if we conditioii on the type of illness, the duration of the illness, and the interaction between the type and duration of the illness. Thus, we can say with some confidence that poorer individuals who suffer from a headache for a week or less visit the doctor more than rich people suffering from a headache for a week or less, but this still leaves open the question of whether the poor persons headache is more or less painful than that of the rich.
A second hypothesis is that there are systeimatic differences in the information available to individuals in different income groups. Qualitative evidence collected during the survey indicate that there are two broad type of differences in information among individuals in our survey. First, individuals in hligher income groups may be more informed about the type of illness they have (diagnosis), and second, they may have more information about the mapping between illness and medication (treatment).
A possible reformulation of the problem of diagnosis is to think of this as a problem of labeling whereby observed differences in the treatment and reporting across income groups are inherently linked to the construction of the category of short duration as opposed to chronic inorbidities. As an example, consider the case of an individual with diabetes. The report of this illness may take
one of two forms: either, the person may be aware of her diabetic condition, and when asked about her health incorporates this illness into her health report. Alternatively, if the person is not aware that she is diabetic, she may report the illness o7ny when symptoms occur- as a result, she may report 'boils' or 'loss of sensation' as two tunconnected illness episodes, each lasting a short while as two different episodes. In this case, while the first report would be coded as 'chronic', the second would be coded as a 'short duration morbidity'. Thus, what we construe to be a short duration morbidity in high incorne groups may be 'truly' such illnesses, but are a comibiniation of chronic and other morbidities in lower income groups. This problem is potentially important since only 10% of the poor, but 40% of the rich, report chronic conditions in our sample.2 3
One way to probe this hypothesis further is to consider a group that we would ex-ante expect to be less prone to chronic illnesses than the entire population so that conditioning reporting anld behavior oni this particular group would allow us to examine differentials across income groups independent of the assumptions required in the construction of SDMs. One natural way to construct this group is to rely on the sharp differentials in the incidence of chroinic illnesses by age2 4 anid the results of conditioning reporting and health-seeking on the sample restricted to individuals less than 30 years are presented in Tables 2a, 3b and 4c..
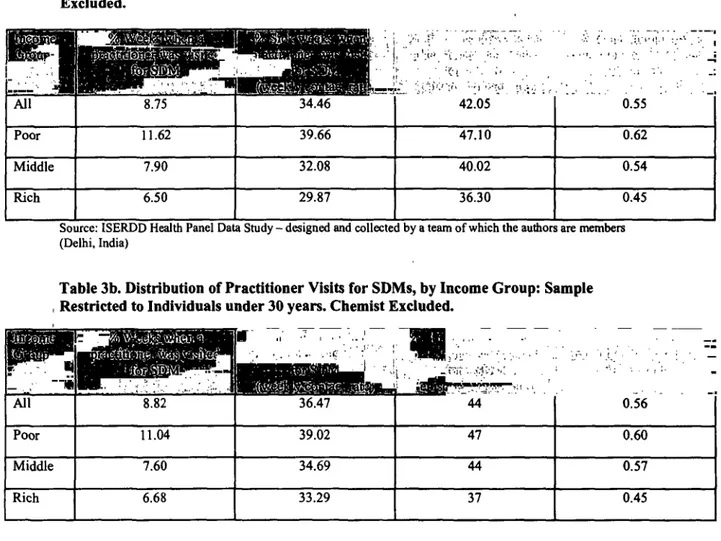
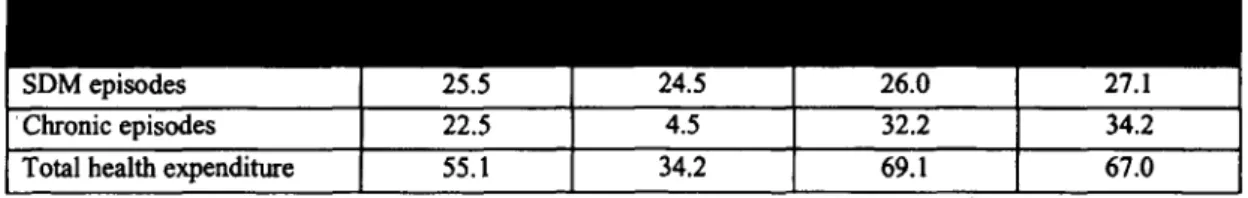
First, as expected, (Table 2a) there is a sharp increase (between 5 anid 7 times) in reported chronic illnesses with age, although the lower reporting of chronic illnesses among the poor remains in the restricted sample. Second, Table 3b shows that the pattern of doctor visits in the full sample remains unchanged when we examine only individuals under 30. The probability of visiting a practitioner is higher among the poor (11% of all weeks) compared to the rich (6.7%o of all weeks) and further, higher visit proportions among the poor are retained wheni we conditioni onl the occurrence of an SDM report (39% for the poor compared to 33% for the rich) or an SDM episode (47% for the poor compared to 37% for the rich). As witlh the entire sample, the high rates of doctor visits among the poor directly translates into higher proportional expenditure as well. Table 4c shows absolute and proportional expenditure on SDMs and other morbidities disaggregated by age and inlcome groups. While the spending on SDMs as a proportion of total health spending is nlow
23 For example, J., with tundiagnosed tuberciulosis, reports episodes like 'fever', 'headache' and 'body-ache' for 12 weeks of the survey, visits the same practitioner 5 times, hut is not asked to undertake a single diagnostic test. Every week that she reports a new illness she makes no connection to her previous episode, which she regards as 'cured'.
Further, each week she takes a number of medicines, ranging fiom antibiotics to steroids and pain-killers, and over the 16 weeks, she spends Rs.400, representing 2.5 per cent of the houisehold income. After the visit by the project doctor and a subsequent chest X-ray, which she paid for on her own, a lesion detected in her right Ilng was diagnosed as tuberculosis. She was then advised to visit the government TB clinic, where fiee treatment and medication are provided under the DOTS program.
21 For instance, mortality due to chronic illnesses such as cancers and diabetes in the US increase by almost 50 times between the ages of 35 and 80 (National Center for Health Statistics, 2002).