The CEEC10's Real Convergence Prospects
Martin Wagner, Jaroslava Hlouskova
20 Reihe Transformationsökonomie Transition Economics Series
The CEEC10's Real Convergence Prospects
Martin Wagner, Jaroslava Hlouskova April 2001
20 Reihe Transformationsökonomie Transition Economics Series
Institut für Höhere Studien (IHS), Wien
Contact:
Martin Wagner
Department of Economics University of Bern Gesellschaftsstrasse 49 CH-3012 Bern
(: +41/31/631 47 78 fax: +41/31/631 39 92
email: martin.wagner@vwi.unibe.ch Jaroslava Hlouskova
(: +43/1/599 91-142 fax: +43/1/599 91-163 email: hlouskov@ihs.ac.at
Founded in 1963 by two prominent Austrians living in exile – the sociologist Paul F. Lazarsfeld and the economist Oskar Morgenstern – with the financial support from the Ford Foundation, the Austrian Federal Ministry of Education and the City of Vienna, the Institute for Advanced Studies (IHS) is the first institution for postgraduate education and research in economics and the social sciences in Austria. The Transition Economics Series presents research done at the Department of Transition Economics and aims to share “work in progress” in a timely way before formal publication. As usual, authors bear full responsibility for the content of their contributions.
Das Institut für Höhere Studien (IHS) wurde im Jahr 1963 von zwei prominenten Exilösterreichern – dem Soziologen Paul F. Lazarsfeld und dem Ökonomen Oskar Morgenstern – mit Hilfe der Ford- Stiftung, des Österreichischen Bundesministeriums für Unterricht und der Stadt Wien gegründet und ist somit die erste nachuniversitäre Lehr- und Forschungsstätte für die Sozial- und Wirtschafts- wissenschaften in Österreich. Die Reihe Transformationsökonomie bietet Einblick in die Forschungsarbeit der Abteilung für Transformationsökonomie und verfolgt das Ziel, abteilungsinterne Diskussionsbeiträge einer breiteren fachinternen Öffentlichkeit zugänglich zu machen. Die inhaltliche Verantwortung für die veröffentlichten Beiträge liegt bei den Autoren und Autorinnen.
Abstract
The Central and Eastern European countries' prospects of becoming EU members depend heavily on, among other things, their per capita GDP levels. The growth prospects of these economies cannot be directly assessed, as the economic growth process in the transition countries is shown to not yet be described adequately by neoclassical growth theory. Thus, an indirect approach is taken, which maps the Western European growth experience on 10 Central and Eastern European countries (CEEC10). This indirect approach is used to project growth rates of the CEEC10 and the time required to close the income gaps to the European Union (EU). The sensitivity of the results is analyzed by presenting a wide variety of economically meaningful scenarios. Finally, possible beneficial effects of EU membership or pre-accession aids are studied. The effects on the reduction of the times to converge are computed.
Keywords
Transition economies, growth and convergence, EU accession
JEL Classifications
F02, F43, O11, O19
Comments
Financial support from the Austrian Ministry of Economic Affairs is gratefully acknowledged by the authors. The authors would furthermore like to thank H. Hutter and B. Meininger for their help with TeX and data issues and A. Wörgötter for valuable comments.
Preliminary Version: Please do not quote without permission.
Contents
1 Introduction 1
2 The Structural Stock of Transition 5
3 An Indirect Approach to Assess Convergence Prospects 18
4 Conclusions 31
5 Appendix 33
References 43
Sincethe collapseofthe SovietUnion andtheinduced majorsystemictrans-
formation from centrally planned to market based economies, for nearly all
the Central and Eastern European countries membership within the Euro-
pean Union is one, if not the, primary goal. However, the prospects of be-
coming a member of the EU depend strongly on the economic performance
of the respective applicantcountry. 1
Thus, anassessment ofpossibletiming
of EUmembershipof theindividualcountriesrequires anassessmentoftheir
economic development. One primary indicator of economic development is
(the evolution of) real per capita GDP. Of course also other economic and
politicalcriteria have to be fullled beforemembership can beachieved. As
all potential entrants, also the Eastern European applicant countries have
to meet legal standards and have to achieve satisfactory levels of political
developments. Criteriahave been formulatedat the Copenhagen summit.
In this paper we solelyfocus oneconomic growth and onrelative percapita
GDP levels of the Eastern European countries relative to the European
Union, which is a very important economic criterion for the timing of po-
tential entrance in the EU. The group of countries we investigate consits of
Bulgaria (BGR), Czech Republic (CZE), Estonia (EST), Hungary (HUN),
Latvia(LVA),Lithuania(LTU),Poland(POL),Romania(ROM),SlovakRe-
public (SVK) and Slovenia (SVN). This group of countries is, as indicated
above, labeled CEEC10 throughout the paper. Compared to many other
quantitative studies on transitioncountries, we restrict our attention to the
smaller group of countries that have expressed their willingness to join the
EU. Several studies include up to 26 countries, where usually also the non-
Baltic republicsof the former SovietUnion are included, sometimes alsothe
People'sRepublicofChinaand Vietnam(seee.g. deMeloetal,1997 orBerg
et al,1999).
ForalltheseEasternEuropeancountrieslistedabovetheroughpictureofthe
last decade is the following: The initialperiod of transitionis characterized
by drastic falls in output, high ination and rising unemployment (see e.g.
Kornai, 1994, Fischer, Sahay and Vegh, 1998a, Berg et al., 1999 or Fischer
and Sahay,2000). The most drasticexample is areal GDP growth of about
-40 % in Latvia in 1992. For most countries in the sample, with the excep-
tion ofBulgariaandRomania,outputstartedtogrowsustainedlyin1994 or
1995. Ination rates also soared up and some countries experienced hyper-
1
At the time being there are 13 applicant countries: The ten Central and Eastern
Europeancountries analyzedin thiscontribution,listedbelow,and additionallyCyprus,
MaltaandTurkey.
inations. Again with the exception of Bulgaria and Romania, by the end
of the 1990ies inationhas been brought down toone-digitor low two-digit
numbers. Thus, amongthese countries stabilization policy has been, grosso
modo, successfuland growth isnow experienced widely.
Economic growth in these countries depends on two sets of factors, see e.g.
Fischer et al. (1998b): On factors in relation totransition, which again can
be separated in initial conditions and reform policy, on the one hand, and
on the determinants of long-rungrowth as described by neoclassical growth
theory on the other hand. DeMelo et al. (1997) nd that initialconditions
do matter, but that the adverse eect of unfavorable initial conditions can
beovercome by strict commitmentto reform policy.
The further along acountryis onitstransitionprocess, the more important
will the standard neoclassical determinants of economic growth become. If
the growth process isdescribed adequatelyby the neoclassicaldeterminants
of growth (along the lines of Ramsey, 1928, Solow, 1956 or Cass, 1965),
then some clear predictions concerning the long-runco-movement of macro-
economicaggregatesfollow,likee.g. apositivecorrelationbetweentheinvest-
ment share and output growth. An assessment of possible ways to project
the future evolution of GDP growth in this countries requires rst an un-
derstanding of the experience so far. In section 2 we therefore investigate
the relationships between some macro-economic variables like GDP, invest-
ment and government consumption, which gure (of course) prominently
in the growth literature. The possible emergence of the standard correla-
tions between these variables,likee.g. the already abovementionedpositive
correlation between the investmentshare and growth, ora negative correla-
tion between initialGDP and subsequent growth, willindicate whether the
standard neoclassicalgrowth modelcan directly be appliedtoassess growth
prospects.
3
It turnsout, not too unexpected, that especiallyduringthe rst
part ofthe transitionperiodthese standardcorrelations cannotbeobserved.
I.e. during this period,the systemic collapseputs these countries toofar o
froma(balanced)neoclassicalgrowthpath,astoobservestandardbehavior.
During the later years of the sample, some emergence of expected relation-
ships, for instance a positive correlation between the investment share and
growth, can be observed. For both cases, whether the sample is split after
1993orforthefullsample,surprisinglyalwaysapositivecorrelationbetween
initialGDPandtheaverageGDPgrowthrateisobserved. Thus, upto1998,
2
Thedetailednumbersaregivenintable1insection2.
3
This negativecorrelationbetweeninitial GDPand average growthis usuallylabeled
unconditional-convergenceinthegrowthliterature. Ifitapplies,oneobservesatendency
ofnarrowingincomedierencesbetweenthecountries. Foramoredetaileddiscussionsee
thefollowingsections.
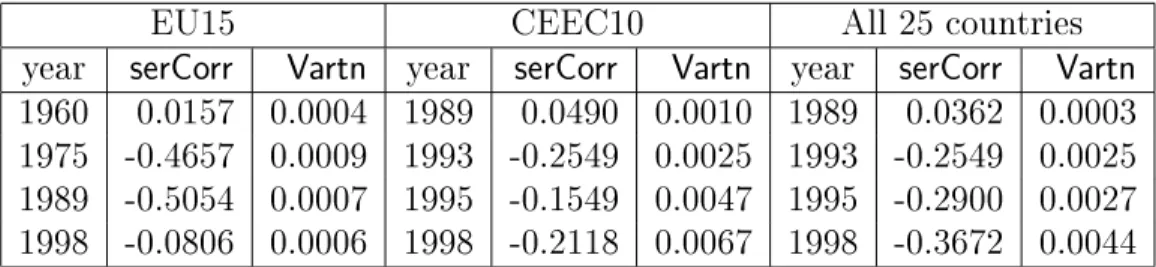
To gain further understanding about the evolution of the incomes 4
of the
CEEC10 since the beginning of transition we also apply simple methods of
distribution dynamics.
5
The positive correlation between GDP in1993 and
the average growth rate since then indicates that countries in a favorable
position in1993 have been able to take advantage of this. This may be the
case becauseof earlyreformthat putsthe respective countries inafavorable
situation or it could also be due to a longer lasting eect of positive initial
conditions.
An implication of the above observation is that growth projections cannot
be based directly on estimated growth equations for the CEEC10 group, as
applying theseequationswould implyto projectdivergentbehaviorbetween
the countries.
6
Thishowever, isnot the mostlikelyscenariotooccur: Given
that allthesecountries arepreparingthemselvesforEUmembership,similar
experiences with previous enlargements lead us to conclude that it is very
likely to observe a narrowing of income gaps, both between these countries
and with respect tothe European Union. Ben-David (1996) shows that al-
ready the prospect of EU membership has a positive eect onthe potential
entrants'economic performance. Given the currentexperienceof the macro-
economic evolution inthe CEEC10, an alternative approachto base growth
projections upon has to be found. The approach followed in this paper, is
to generate growth projections forthe CEEC10 onthe historically observed
growth process in the current EU member states since 1960. This means
that in a rst step, growth or convergence equations are estimated for the
European Union. Theseequationsare then used tocompute impliedgrowth
rates for the Central and Eastern European countries by insertingvalues of
the variables as observed in the CEEC countries oras specied in scenarios
to be described later.
Section3thereforestartswithaninvestigationofthegrowthandconvergence
behaviorobserved intheEuropean Union. A varietyofspecications ofcon-
vergence equations isestimated forthe EU14countries (by which wedenote
the EU15 excluding Luxemburg), which then serve as the basis for project-
ing the income prospects of the CEEC10. This approach has initiallybeen
4
ThetermincomeisusedassloppynotationforrealpercapitaGDP.
5
Wefollowtheline ofargumentdevelopedbyQuahinaseriesofpapersto assessthe
distributiondynamics,i.e. theevolutionofthejointdistributionofGDPsovertime. Due
tothesmallamountofobservationsweareconnedtoestimatetransitionprobabilitiesof
discretestateMarkovchains,seesection2.
6
Anextensivesummaryofempirical,regressionbasedgrowthliteratureiscontainedin
BarroandSala-i-Martin(1995)andinBarro(1997). Amethodologicallybroadersummary
isgivenin DurlaufandQuah(1998).
and Vegh(1998b)ourpaperrests onamoresophisticatedeconometricinves-
tigation,with a variety ofequations estimated by panel methods(compared
to pure cross-section regressions in Fischer et al., 1998a). The variety of
specications allows ustoassess therobustness of the results. Notethat the
equationsare estimatedfortheEU only,not foralargersampleofcountries,
and growth projections are only based on this approach for countries that
are applying forEU membership. Webelievethat forthe group ofcountries
investigated, this approach constitutes a feasible computationalexercise, as
already the lastdecade has witnessed a substantialamountof economic and
systemic convergence of the Eastern European transition countries to the
EU. Reforms in the CEEC10 are undertaken with reference to the institu-
tionalarrangementswithintheEU.The EUisthe mainforeigninvestor and
tradingpartnerofthesecountries. Thesestrengthened linkagesimplyloosely
speaking convergence inthe economic structure of the countries involved.
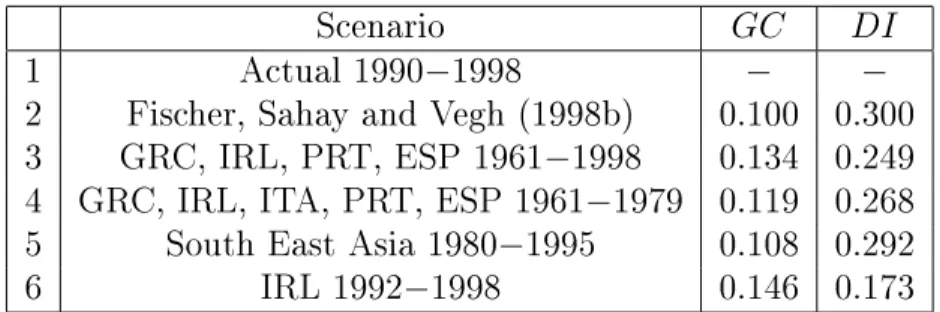
Based on the array of growth projections, derived from the dierent equa-
tionsandscenarios(seesection3),thenumbersofyearsittakesthecountries
of theCEEC10grouptoreachacertainlevelofaverage EUincomearecom-
puted.
7
Computing convergence times is of course more illustrative than
just presenting growth rate projections. All convergence time computations
are based on an assumed real per capita GDP growth in the EU15 of 2 %
per year. It turns out that, with the exceptions of Slovenia and the Czech
Republic, most of the countries still have more than 20 or 30 years to go,
depending on the scenario assumed, until they reach the specied relative
levelsof average European Union real per capita GDP.
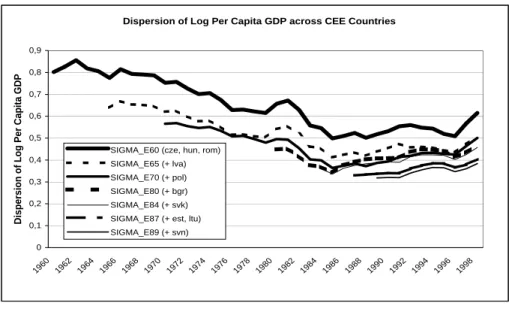
Theorganizationofthepaperisasfollows: Insection2theexperienceinthe
CEEC10between1989 and1998 issummarizedand someinvestigationsinto
the distributionofpercapitaGDPsare presented. Insection3theequations
estimated for the EU are presented and discussed.
8
In this section also the
scenarios and the results basedon these scenarios are reported. In section4
some conclusions are drawn. In the appendix some additional gures and
tables related tosection 3are collected.
7
An exampleis70 %of theEU25averagerealpercapitaGDP,where withEU25we
denote all15 currentEU memberstatesandthe CEEC10investigatedtogether. This is
aninterestingrelativelevel,asthisisthepercentagethatPortugalandSpainhad,relative
to theEU12,whentheyenteredtheEUconsistingof10countriesbeforein1986.
8
Inaseparateappendix,availablefromtheauthorsuponrequest,someinvestigations
concerningthedynamicsofthedistributionofincomesintheEU15andforall25countries
togetherarecollected.
BGR 26.2 238.5 59.6 51.1 72.8 62.7 121.0 949.0 22.2
CZE 9.2 46.2 16.8 17.9 10.9 9.8 9.6 6.5 11.0
EST 304.0 954.0 36.0 42.0 29.0 14.6 12.5 4.4
HUN 25.7 25.4 21.6 21.3 19.5 25.5 21.2 18.5 13.4
LTU 383.0 1163.0 189.0 45.1 35.7 13.1 8.4 2.4
LVA 262.0 959.0 35.0 26.3 23.1 13.1 7.0 2.8
POL 480.1 55.3 38.5 30.5 28.4 27.9 18.7 14.0 12.0
ROM 13.6 195.0 200.1 227.4 138.9 35.2 45.3 147.0 45.9
SVK 6.6 34.6 11.2 15.4 13.8 9.7 4.5 6.6 5.1
SVN 490.8 94.9 208.2 37.1 22.6 15.2 11.1 8.8 7.3
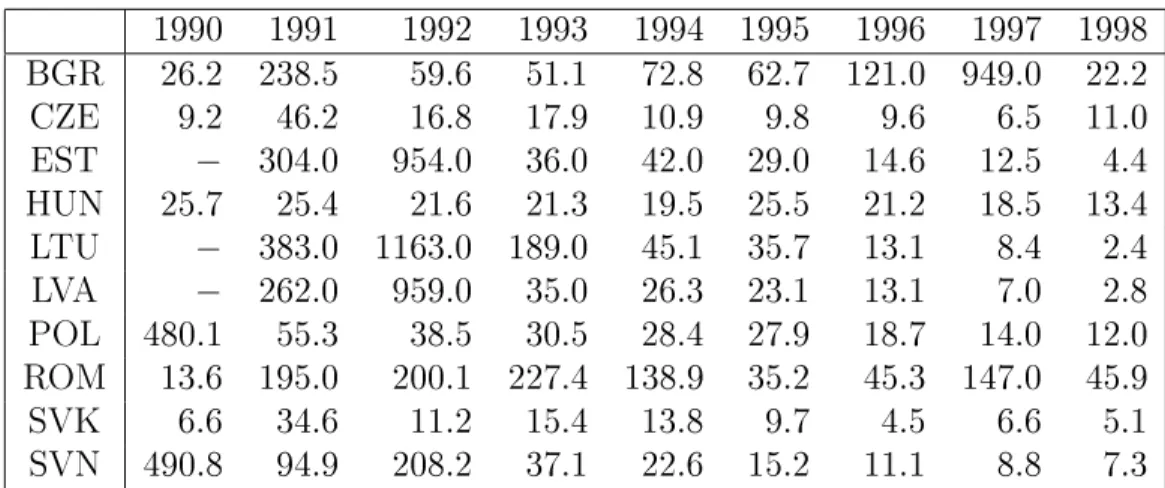
Table 1: Annual inationrate inthe CEEC10. Source: WIIW, OECD.
2 The Structural Shock of Transition
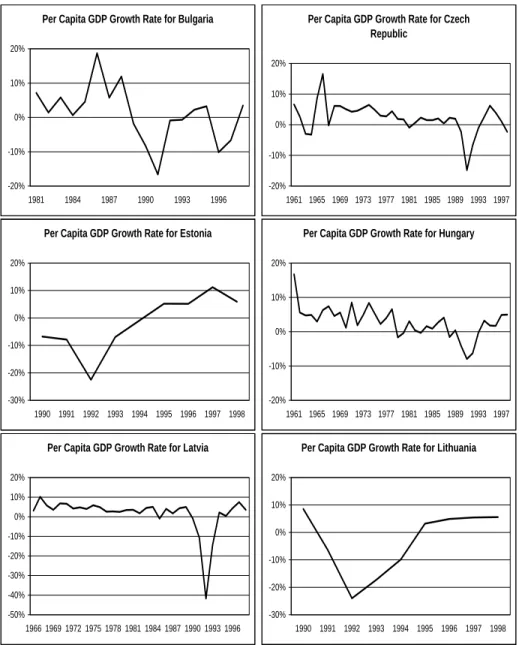
In gures1 and 2the growth ratesof real percapitaGDP are displayed for
theCEEC10forallyearswheredatafortherespectivecountryareavailable.
9
These guresforcefully show the dramaticimpactof the breakdown of com-
munism and central planning. The most dramatic picture is, as mentioned
already intheintroduction,the onefor Latvia,withthe dramaticfallof real
percapitaGDPbyabout40%from1991to1992. Concerningthetworeform
laggards, Romania and Bulgaria, one sees that the limited amount of eco-
nomic reform in these countries has not been suÆcient toachieve sustained
growth. On the contrarythe Baltic republics,severelyhitby the disintegra-
tionoftheSovietUnion,havebeenabletoachievesustainedgrowthsincethe
mid1990ies. Thus, thesepictures conrmthe wellknown factthatthe tran-
sition phase can be split in an early phase of contraction and a subsequent
phase of stabilization and eventual growth.
In the early phase of transition ination rates soared up, see table 1.
Since themid1990iesinationhas been undercontrol,withthe exceptionof
Bulgaria and Romania. Many countries have achieved single-digit ination
rates in the mean time.
For an assessment of the growth prospects of the CEEC10 it is interesting
toanalyze thegrowth experienceup tonow. As pointed oute.g. byFischer,
Sahay and Vegh (1998a, 1998b)growth in transitiondepends ontwo sets of
factors. The rst set consists of the eects of the transition process itself.
This includes initialconditions and reform policy. Consensus in the litera-
9
The longest series are available for the Czech Republic and Romania back to 1961.
All seriesusedinthis paperend in1998.
Per Capita GDP Growth Rate for Bulgaria
-20%
-10%
0%
10%
20%
1981 1984 1987 1990 1993 1996
Per Capita GDP Growth Rate for Czech Republic
-20%
-10%
0%
10%
20%
1961 1965 1969 1973 1977 1981 1985 1989 1993 1997
Per Capita GDP Growth Rate for Estonia
-30%
-20%
-10%
0%
10%
20%
1990 1991 1992 1993 1994 1995 1996 1997 1998
Per Capita GDP Growth Rate for Hungary
-20%
-10%
0%
10%
20%
1961 1965 1969 1973 1977 1981 1985 1989 1993 1997
Per Capita GDP Growth Rate for Latvia
-50%
-40%
-30%
-20%
-10%
0%
10%
20%
1966 1969 1972 1975 1978 1981 1984 1987 1990 1993 1996
Per Capita GDP Growth Rate for Lithuania
-30%
-20%
-10%
0%
10%
20%
1990 1991 1992 1993 1994 1995 1996 1997 1998
Figure 1: Growth rates of real percapita GDP for BGR, CZE, EST, HUN,
LVA and LTU; for all years when data are available. Source: World Bank,
own calculations.
Per Capita GDP Growth Rate for Poland
-20%
-10%
0%
10%
20%
1971 1974 1977 1980 1983 1986 1989 1992 1995 1998
Per Capita GDP Growth Rate for Romania
-20%
-10%
0%
10%
20%
1961 1965 1969 1973 1977 1981 1985 1989 1993 1997
Per Capita GDP Growth Rate for Slovak Republic
-20%
-10%
0%
10%
20%
1985 1987 1989 1991 1993 1995 1997
Per Capita GDP Growth Rate for Slovenia
-20%
-10%
0%
10%
20%
1990 1991 1992 1993 1994 1995 1996 1997 1998
Figure2: Continuation: GrowthratesofrealpercapitaGDPforPOL,ROM,
SVK and SVN; for all years when data are available. Source: World Bank,
own calculations.
transition, but that theirimportanceis decliningrapidly (see e.g. deMelo et
al., 1997, Havrylyshyn, Ivorski and van Rooden, 1998 or Berg etal., 1999).
Especiallyitisfoundthatcountrieswithadverseinitialconditionscannever-
theless achieve a positive outcome by strong commitmentto -and therefore
a large extent of - reform. The second set of factors relevant for growth
prospects of transition economies are the standard forces driving long-run
economic growth asdescribed by the (one-sector)neoclassicalgrowth model
dating back to Ramsey (1928), Solow (1956) and Cass (1965). The further
time proceeds, the more relevant will the neoclassical growth determinants
be. Thus,unless agreat backlashisobservedinthesecountries,mediumrun
growth projectionsmaybebased aroundthe neoclassical growth framework
(with possibly allowing fortransitional eects).
Empirical research on economic growth has witnessed an enormous amount
of interestduringthelast10to15years. Oneofthe reasonsforthisrenewed
interest is the general current interest of the profession on growth theory,
another reason is the formulation and empirical investigation of dierent
notions of convergence within this framework. In essence, the neoclassical
growth modelin itsstandard formulation impliesthat alleconomies charac-
terized by the same underlying parameters (concerning e.g. the production
function) end up in the same steady state, regardless of the initialposition.
It furthermore implies a negative correlation between initial GDP and the
average growth rate. This phenomenon is usually labeled as -convergence,
ithasinitiallybeendened inSala-i-Martin(1990)andhasbeenpopularized
by a series of papers by Barro (1991) and Barro and Sala-i-Martin(1992a,
1992b).
10
For economies described by dierent parameters,the steady state
values may dier. This leads to the concept of conditional -convergence,
where a negative cross-section correlation between GDP growth and initial
GDPisobserved aftercontrollingforcrosscountrydierencesinparameters.
Thus, convergence implies,conditional orunconditional,atendency fornar-
rowing income gaps within agroup of countries.
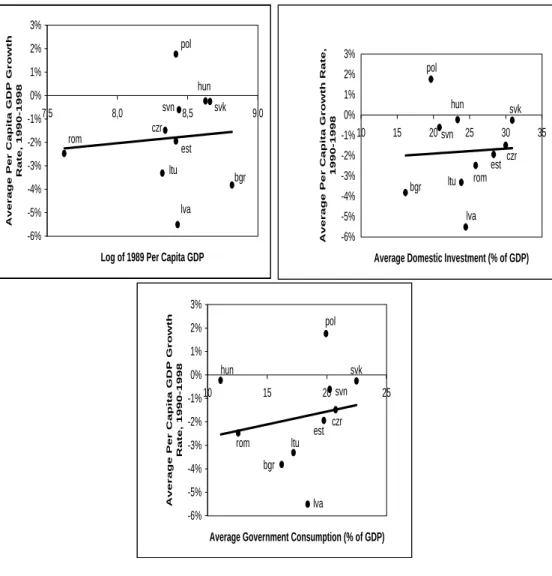
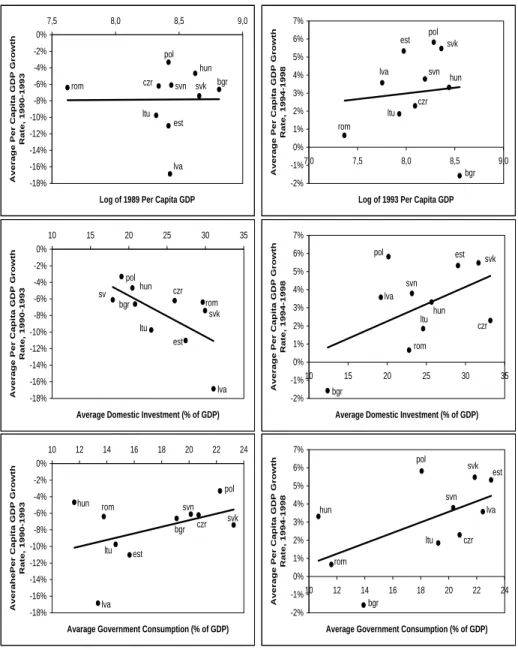
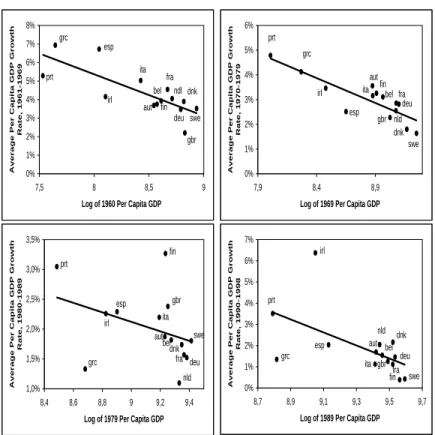
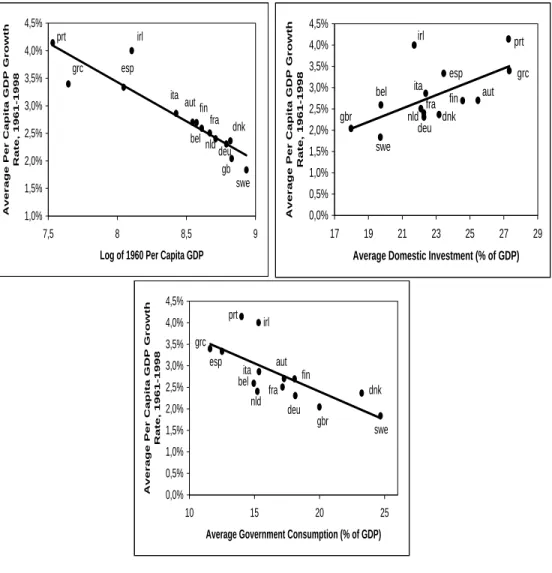
Ingures3and4the(unconditional)correlationbetweentheaveragegrowth
rate of real percapita GDPand (the logof) initialreal percapita GDP, the
averageshareofinvestmentofGDPandtheaverageshareofpublicconsump-
tion of GDP are shown. In gure 3 this is done for the whole period 1989
to 1998 and in gure 4 the correlations are displayed over the sub-periods
1989 to 1993 and 1994 to 1998.
11
Growth theory predicts a positive corre-
10
AlreadyBaumol(1986)andDeLong(1988)investigatelong-runconvergencebetween
incomesofdierentcountries.
11
The timing convention in this paper is thefollowing: The initial year is alwaysthe
year prior to the period overwhich averages are computed, e.g. for the period 1994 to