Research Collection
Report
Analysis of climatic variables in different urban sites of
Singapore and evaluation of strategies to improve the outdoor thermal environment
Author(s):
Acero, Juan Angel; Koh, Elliot J.Y.; Tan, Yon Sun Publication Date:
2020-09-28 Permanent Link:
https://doi.org/10.3929/ethz-b-000442926
Rights / License:
In Copyright - Non-Commercial Use Permitted
This page was generated automatically upon download from the ETH Zurich Research Collection. For more information please consult the Terms of use.
DELIVERABLE TECHNICAL REPORT
Version 28/09/2020
D2.1.2 – Analysis of climatic variables in different urban sites of Singapore and evaluation of strategies to improve the
outdoor thermal environment
Project ID NRF2019VSG-UCD-001
Project Title
Cooling Singapore 1.5:
Virtual Singapore Urban Climate Design
Deliverable ID D2.1.2– Strategy evaluation/validation report
Authors Juan A. Acero, Elliot J.Y. Koh, Yon Sun Tan
DOI (ETH Collection) 10.3929/ethz-b-000442926
Date of Report 28/09/2020
Version Date Modifications Reviewed by
1 16/09/2020 Original Winston Chow (20.09.2020)
Leslie Norford (20.09.2020) Yuliya Dzyuban (25.09.2020)
Abstract
This report presents the outcome of outdoor thermal comfort campaigns carried out in two different areas of Singapore (commercial and residential/park areas). The aim was to quantify the impact of different urban elements and strategies on the local climate variables and outdoor thermal comfort. In each area, sensors were deployed simultaneously in 4-5 sites to measure air temperature, wind speed and direction, relative humidity, and globe temperature. Evaluation of thermal comfort was done by means of the Physiological Equivalent Temperature heat stress index (PET). Continuous measurements were carried for 4 - 7 months at each site during years 2019 and 2020.
The results revealed seasonal OTC differences that justify the necessity of evaluating OTC and its strategies throughout the year. Analysis of vegetation elements has shown a benefit in PET of 7-8°C during the midday/afternoon period. Also shadow from high-rise buildings can produce a decrease of 12°C. Orientation of streets, as well as type of development, have a significant effect on duration, intensity and timing of the diurnal PET peak. Inside each area, during night-time, sites in low-rise developments showed a lower air temperature (1.2-1.5°C) than high-rise areas in agreement with higher sky view factor and higher heat release. On the contrary, during the morning, high-rise street canyons presented a delay in the warming phase that turned into lower air temperature (~0.5°C) compared to low-rise developments. Finally, semi-outdoor spaces (e.g. elevated podiums) can register in the afternoon period up to 13-15°C (PET) lower than close by high-rise developments and 8-9°C (PET) lower than open urban areas, depending on the climatic season.
Results provided grounded insights to OTC levels in different urban typologies that can influence decision-making in the context of improving OTC through adequate urban design.
Table of Content
1 Introduction ... 1
1.1 Objectives ... 2
2 Methods ... 2
2.1 Measurement campaigns ... 2
2.2 Description of the areas and sites of measurements ... 4
3.2.1 Duxton Park area ... 4
3.2.2 CBD area ... 8
2.3 Analysis of climate variables and OTC ... 11
3 Quantitative analysis of the sites in Duxton Park ... 12
3.1 Climate variables ... 12
3.1.1. Mean values during the campaign ... 12
3.1.2. Seasonal mean values and differences ... 20
3.2 Thermal comfort ... 24
3.2.1 Mean values during the campaign ... 24
3.2.2 Seasonal mean values and their differences ... 26
4 Quantitative analysis of the sites in the CBD area ... 28
4.1 Climate variables ... 28
4.1.1. Mean values in the wet NE Monsoon period ... 28
4.1.2. Mean values in the dry NE Monsoon period ... 33
4.1.3. Comparison of semi-outdoor and outdoor mean values in the dry NE Monsoon period ... 39
4.1.4. Mean values in the dry Inter-Monsoon period ... 40
4.2 Thermal comfort ... 47
4.2.1 Mean values and differences in the NE-Monsoon period ... 47
4.2.2 Seasonal mean values and their differences ... 49
5 Comparison between Duxton Park area and Asia Square ... 52
5.1 Climate variables ... 52
5.2 Thermal comfort ... 53
6 Comparison between Duxton Park, Asia Square and RobinsonRd ... 55
6.1 Climate variables ... 55
6.2 Thermal comfort ... 56
7 Influence of cloudiness on climate variables and thermal comfort ... 58
8 Evaluation of urban design / features (thermal comfort strategies) ... 61
8.1 Vegetation ... 61
8.1.1 Tall palm trees ... 61
8.1.2 Tree canopy ... 62
8.2 Shadowing of High-rise building ... 64
9 Conclusions ... 67
9.1 Qualitative results of the comparison of simultaneous measuring periods ... 67
9.2 Quantitative results for OTC strategies... 69
10 References ... 71
1 Introduction
The city-state of Singapore is facing a rapid-increase in population during the last decade (12.3%
between 2010 and 2019) (Statistics Dept., 2019). The increase of urbanized areas in this small country (i.e. 710 km2) can lead to an increase of both Urban Heat Island (UHI) phenomena and thermal discomfort in outdoor urban spaces.
In a tropical city like Singapore, that is already subject to high temperatures and high relative humidity throughout the year, an increase of outdoor thermal discomfort within the city can generate new health, social, economic, and environmental problems.
Nowadays, Singapore is the greenest city in Asia. It is rich in green infrastructures and green spaces for recreation purposes designed to i) preserve the environment without compromising the urban development, ii) improve the quality and the placement of living urban environment, and iii) reduce the urban heat stress. Nevertheless, one of the sustainable government strategies to face the future potential overheating of the city is to maintain and further extend the implementation of urban greenery (i.e. network of green spaces, green infrastructures, and parks), especially in new residential towns.
Selection of the most effective green strategies to improve the outdoor thermal comfort is extremely important to maximize the liveability of the residents and the attractiveness of the new developments.
Climate variables and outdoor thermal comfort (OTC) inside the urban area are influenced by the interaction between the urban elements and the prevailing weather conditions (air temperature, humidity, wind speed and solar radiation). In this context, the evaluation of the impact of urban geometry and urban design on OTC also becomes a relevant topic for Singapore and the future urban developments. Building height can provide local shadow while adequate urban porosity and street orientation can improve natural outdoor ventilation.
Many studies have already analysed strategies and measures to improve urban thermal comfort focusing on vegetation (Acero et al., 2019; Lobaccaro & Acero, 2015; Ng, Chen, Wang, & Yuan, 2012;
Tan, Wong, Jusuf, & Chiam, 2015; Zölch, Rahman, Pfleiderer, Wagner, & Pauleit, 2019), and urban design and ventilation (Ali-Toudert & Mayer, 2006; Hong & Lin, 2015; Ignatius, Wong, & Jusuf, 2015;
Krüger, Minella, & Rasia, 2011; Ng, 2009; Sharmin, Steemers, & Matzarakis, 2017; Yang, Wong, & Li, 2016). The impact of these can be assessed by means of measurements and/or modelling (Chow, Pope, Martin, & Brazel, 2011; Gulyás, Unger, & Matzarakis, 2006; Yang et al., 2016). Reliable results are obtained from the former but the costs in terms of time and resources are significant since a representative amount of measurements is required.
The work presented in this report is embedded in the Cooling Singapore project (www.coolingsingapore.sg) focusing on the design of solutions to address the urban heat challenge in Singapore. These could be exported and used as a reference in other parts of the world, more specifically in similar hot and humid climates. Based on measurement campaigns, this report shows the results of the investigation on Outdoor Thermal Comfort (OTC) levels in Singapore (Section 4, 5, 6,
7), and the analysis of some strategies with a high potential to generate positive impacts on the local microclimate (Section 8, 9). These strategies could lead to the development of climate-responsive design guidelines.
1.1 Objectives
The main objective of this report is to describe the methodology, results and conclusions obtained from several measurement campaigns carried out in Singapore during nearly one year.
Based on monitoring microclimate conditions, an analysis and validation of OTC strategies related to urban design in different type of urban developments has been undertaken. Street geometry, building morphology, and vegetation influence have been evaluated with respect to OTC.
2 Methods
2.1 Measurement campaigns
Two long-term meteorological campaigns have been carried out in two different urban areas of Singapore. A description of these areas can be found in Section 3.2.
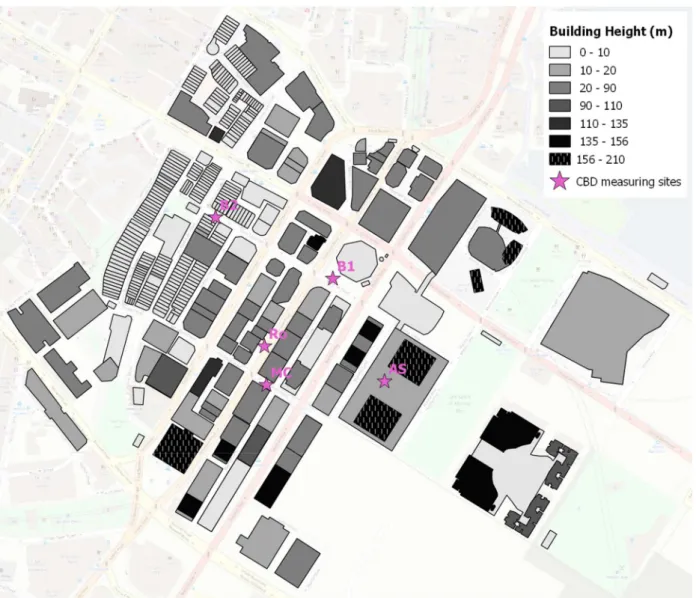
Meteorological sensors were deployed between 4.5 and 7.5 months in each area where several sets of instruments measured simultaneously the microclimate conditions at specific sites (Section 3.2). In each site 2 sensors were deployed (Figure 1):
a) Weather Transmitter (WXT520) from Vaisala to measure the wind speed, direction, precipitation, atmospheric pressure, temperature and relative humidity, and
b) Black globe radiant temperature (150 mm diameter) from Scientific Campbell to measure globe temperature.
a) b)
Fig. 1. a) WXT520 Weather Transmitter from Vaisala, b) Black globe Radiant Temperature Sensor 04K Thermistor from Scientific Campbell
At each site, the meteorological sensors were mounted on a reinforced metallic arm and attached to the selected lamp post (Figure 2). All the sensors were between 2.2 and 2.4 m above the ground level.
The metallic arm extended up to 1.2 m away from the lamppost to avoid wind obstructions by the lamp post itself. In the case of lamp posts being close to the limit between the road and walkway, the metallic arm was oriented 0.6 m away from road kerb/edge to avoid any influence of the sensor on the traffic of vehicles and pedestrians, following government agencies’ requirements. A mount clamp ensured the fixation of the metallic arm to the lamp post (covered with suitable proofed tape so as to avoid damaging or scrapping the lamppost). Total weight of the sensors plus the metallic arm was below 4 kg.
Fig. 2. Visual description of the sensors deployed in each site
Additionally, a waterproof white enclosure was used to protect the data logger (Scientific Campbell CR300) and the necessary battery (15 Amph) to power all devices in each site. This enclosure was installed at a lower level (0.5 m above ground level), attached to the lamppost. Weight of the latter was around 10 kg. Communication cables between the sensors and the data logger were bound to the lamp- post with the help of cable ties for aesthetics and security. Figure 2 shows a description of meteorological sensors and equipment deployed in each of the sites
Although the batteries were able to supply power during more than two weeks, all sensors and data loggers were checked and measurements were downloaded every seven days.
2.2 Description of the areas and sites of measurements
3.2.1 Duxton Park area
Four sites have been selected to monitor the microclimate conditions at different locations of Duxton Park over 4.5 months. These aimed to evaluate the impact of different vegetation composition, street designs, urban development, and building height asymmetry on the local climate variables and the pedestrian’s OTC.
The Duxton Park area is of particular interest because of its location and nature. Being located close to the Commercial Business District (CDB) high-rise developed area of Singapore, it is mostly used by residents and office worker commuters. It is a short and narrow corridor that offers an alternative route to the Chinatown district compared to the more heavy trafficked nearby streets. This pedestrian, green corridor presents over a small distance different vegetation species with different influence (sun and humidity exposure) in the very near sites. Also, the area combines different urban typologies (Figure 3). Different street canyon aspect ratios (the ratio between the street width and the aside averaged building height) and building height asymmetry (e.g. Pinnacle high rise building versus shop-houses) can be found. The selection of the measuring sites aims to analyse the effect of these urban features in the OTC.
A description of the specific sites where the sensors were located:
ID Site Description Picture
D1 Pinnacle1
Asymmetrical street canyon (Highrise towers on one side, and lowrise development on the other). NW street orientation. Shadow of highrise building in the afternoon, and trees in the morning.
SVF=0.42
D2 Pinnacle2
Asymmetrical street canyon (Highrise towers on one side, and lowrise development on the other). NW street orientation. Shadow of highrise building in the afternoon. Influence of nearby low height trees and bushes.
SVF = 0.62
D3 Duxton3
Lowrise development area. Buildings on both sides of the canyon are not higher than 10 meters. Ground mostly covered with grass. NNW street orientation. Most relevant shadow provided by some tall palm trees (high transmisivity) before noon. Site with the highest sky view factor.
SVF=0.75
D4 Duxton4
Lowrise development area. Buildings on both sides of the canyon are not heigher than 10 meters. Ground is mostly covered with grass or loamy.
NNW street orientation. Site in under a tree canopy and direct sun radiation basically only occurs during the morning. Site with the lowest sky view factor.
SVF=0.24
The four sites in Duxton Park area were measuring simultaneously between 4th July and 23th October 2019. On this last day, Pinnacle1 (D1) was removed and only the rest, Pinnacle2 (D2), Duxton3 (D3) and Duxton (D4) remained until 11th November 2019.
3.2.2 CBD area
This area is inside the high-rise Commercial and Business District (CBD) of Singapore, around Shenton Way and Robinson Rd., and between BoonTat Str. and McCallum Str. (Figure 4). It is of particular interest due to its location, type of urban development and the activities (i.e. business and commercial) that are carried out. It is located in the heart of Singapore’s financial activities and is currently mostly used by office worker commuters. The measurement points were selected in correspondence with the frequent ways commuters use when accessing their jobs, moving for lunch and/or recess. The area includes different street canyon aspect ratios, street orientation (NE-SW and NW-SE), and building height asymmetry (e.g. Telok Ayer Market low-rise building versus nearby towers). Additionally, this area includes some new building designs with semi-outdoor spaces that can be interesting from an OTC perspective. All measuring sites were exposed to different sun radiation and wind conditions. In this report they are compared with respect to OTC.
Fig. 4 Location of the selected sites for the measurement campaign in CBD Area
Sensors were mounted in five locations for around 7.5 months. Figure 5 represents the sites in the CBD.
A description of the specific sites where the sensor were located:
ID Site Description Lamp post code
B1 BoonTat711t
Asymmetrical street canyon (Highrise towers on one side, and Telok Ayer Market (lowrise development) on the other). Street with NW-SE orientation.
Shadow in the afternoon due to highrise building. Sites with unsual high SVF due to lowe-rise development in opne side and openness
MC McCallum
Highrise development with street aspect ratio ~2.5 (low sky view factor), and NW-SE orientation. Shadow of highrise building in the afternoon.
Ro RobinsonRd.
Highrise development with street aspect ratio ~2.5 (low sky view factor), and NE-SW orientation. Only a short period (~2 hours) of solar radiation around midday/afternoon
B2 BoonTatSt
Lowrise development with street aspect ratio ~1 (high sky view factor), and NW-SE orientation. Shadow during the afternoon. Farest site from the shore line
AS AsiaSquare
Inside a semi-outdoor space in an highrise development. No direct solar radiation at anytime of the day.
The five measuring sites in CBD area were deployed at different moments. AsiaSquare was deployed on the 3rd of August 2019. Thus, simultaneous measurements in AsiaSquare and the four sites in Duxton Park area (Section 3.2.1) were taken during close to three months (August to October). The RobinsonRd site was deployed on the 26th October 2019, and during 16 days (until 11th November 2019) measurements with Pinnacle2, Duxton3, Duxton4 and AsiaSquare happened at the same time.
Finally, McCallum, BoonTatSt and BoonTat711 were deployed on the 15th of November and from this day onwards simultaneous measurements were recorded together with AsiaSquare and RobinsonRd.
However, measurements in AsiaSquare stopped on the 21st Novemebr 2019 (due to permission constraints), but were resumed on the 14th of March 2020. Also sensors in McCallum were damaged by construction works close to the measurement site and the sensors had to be dismantled on the 22nd of January 2020, and were not installed again. The four remaining sensors in the CBD area (AsiaSquare, RobisonRd, BoonTatSt and BoonTat711) ended the campaign on the 1st July 2020.
2.3 Analysis of climate variables and OTC
The analysis of the measurement campaigns has focused on air temperature (Ta), vapour pressure (e), wind speed (WS) and mean radiant temperature (Tmrt). The Physiological Equivalent Temperature heat stress index (PET) was used to asses the thermal comfort levels in the different measuring sites.
Vapour pressure (e) was derived from (1) using the registered relative humidity (RH) and Ta values and the saturated vapour pressure (ew) for a given Ta (2).
∗ /100 (1)
6.1078 ∗ 10 . . (2)
On the other hand, Tmrt was derived from the measured globe temperature. This temperature at equilibrium results from a balance between the heat gained and lost by radiation and through convention (ASHRAE, 2001). Globe measurements were performed using a 150 mm black globe sensor as described in Section 3.1. Thus, Tmrt was calculated using (3):
273.15 . ∈ . . / 273.15 (3)
where Tg is the globe temperature [ºC], WS is the wind speed [ms-1], Ta is the air temperature [ºC], D is the globe diameter [m] and ε is the globe emissivity. In our case ε = 0.95 (for black globe).
At each site, 10-min mean climatic values were calculated from 1-min records stored in the data logger.
These 10-min values were used to calculate PET, together with the standarized data for human metabolic heat rate and other personal parameters (i.e. age: 35, height: 1.75; metabolic rate: 80w/m2;
clothing: 0.9; weight: 75 kg; sex: man).
With the aim of analyzing the impact of different urban features and meteorological conditions, diurnal cycles for different temporal periods (e.g. climatic seasons) and quantitative average values were calculated for different periods of the day: Morning (7:10 to 10:00), Midday/Afternoon (11:10 to 16:00);
Evening (17:10pm to 19:00); After_Sunset (20:10 to 23:00); Night (00:10 to 6:00)
3 Quantitative analysis of the sites in Duxton Park
The following Section presents an analysis of the measurements carried out in four sites in Duxton Park area (Pinnacle1, Pinnacle2, Duxton3, Duxton4). It includes an evaluation of the mean climate values measured simultaneously during between 4th July and 23rd October 2019, as well as the difference between seasons (SW-Monsoon vs Inter-Monsoon). Finally, an analysis of OTC levels is presented.
3.1 Climate variables
3.1.1. Mean values during the campaign
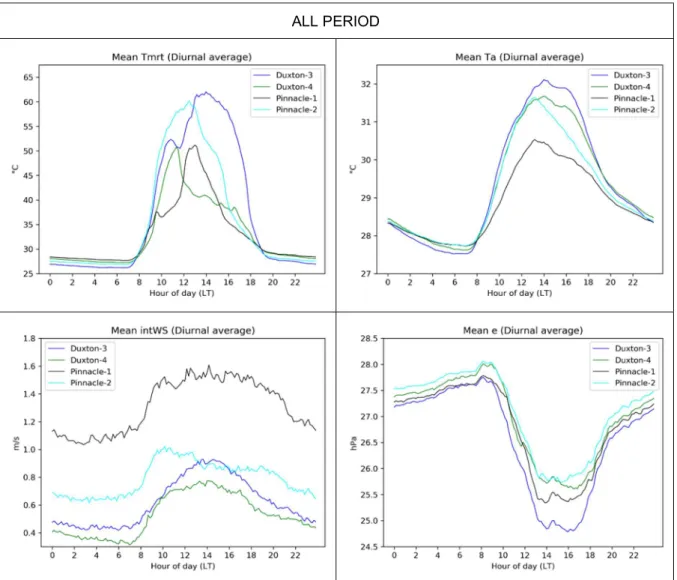
Table 1 presents the mean climatic values in different periods of the day (morning, midday/afternoon, evening, after sunset and night) when all sites in Duxton Park area were recording simultaneously (4th July to 23rd October 2019).
3.1.1.1 Mean radiant Temperature
During the morning and evening mean Tmrt values do not show large differences between the four sites.
These reach 2.3°C in the morning and 6°C in the evening. As expected, the highest Tmrt occur during the midday/afternoon period. Duxton3 reached a mean value of 57.9°C significantly higher than Duxton4 and Pinnacle1 (∆Tmrt = 16.1°C and 14.3°C respectively). After sunset and during the night, the lack of solar radiation reduce Tmrt values to 27.5°C and 26.5°C respectively in Duxton3, with small differences with the rest of the sites (∆Tmrt up to +1.5°C in Pinnacle1). Lowest Tmrt values in Duxton3 after sunset and during the night agree with a higher sky view factor (SVF) that allows the release of heat accumulated during daytime, and thus the cooling of nearby urban surfaces.
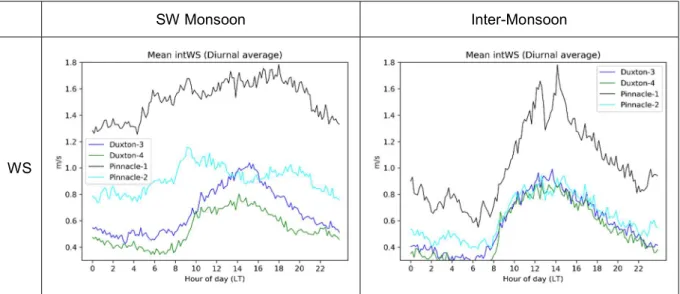
Additionally, the analysis of the 10-min diurnal profile of the Tmrt (Figure 5) show the influence of different urban features/elements. Although Pinnacle2 and Duxton3 have high mean Tmrt values, the peak occurs with ~1.5 hour difference (at 12:30 for Pinnacle2 and 14:00 for Duxton3). The reason for this is the effect of the high-rise building that produces shadow in Pinnacle2 and reduces the amount of direct solar irradiance at the site. This is more evident on a clear sky day (Section 9.2) where a sharp decrease in Tmrt values due to building shadowing occurs. In the case of mean Tmrt diurnal cycle over 4.5 months (Figure 5) the effect of the building is less marked because of the changes of solar elevation during the 4.5 months, and thus the change in Tmrt peak timing throughout this period. Additionally, during cloudy days (common in Singapore), high levels of diffuse radiation and low direct radiation also contribute to smooth the drop in Tmrt values due to building shadowing.
Table 1 Mean values of wind speed (WS), air temperature (Ta), vapour pressure (e) and mean radiant temperature (Tmrt) in Duxton3 during different periods of the day, together with the differences in Duxton4, Pinnacle1 and Pinnacle2 (e.g. ∆Tmrt in Duxton4 represents Tmrt,Duxton4- Tmrt,Duxton3)
Site Variable Morning Midday/
Afternoon Evening After
Sunset Night
Duxton3
Tmrt 34.4 57.9 37.7 27.5 26.5
WS 0.5 0.9 0.7 0.6 0.4
Ta 28.5 31.7 30.6 28.9 27.8
e 27.6 25.3 25.6 26.8 27.4
Duxton4
∆Tmrt -2.3 -16.1 -5 1.1 1.1
∆WS 0 -0.2 -0.1 -0.1 0
∆Ta -0.1 -0.3 -0.2 0 0.2
∆e 0.3 0.7 0.4 0.3 0.1
Pinnacle1
∆Tmrt -2.1 -14.3 -6 1.3 1.5
∆WS 0.8 0.6 0.8 0.7 0.7
∆Ta -0.3 -1.5 -1 -0.2 0.2
∆e 0.1 0.5 0.3 0.2 0
Pinnacle2
∆Tmrt 1.3 -4.7 -6 0.4 0.7
∆WS 0.3 0 0.2 0.1 0.2
∆Ta -0.1 -0.5 -0.7 -0.2 0.2
∆e 0.3 0.8 0.6 0.4 0.3
Tmrt levels in Duxton3 are influenced by shadowing from high palm trees around ~11:15 (see Section 9.1). Similarly Duxton4 is directly exposed to solar radiation until ~11:00. At this time the tree canopy starts producing shadow in the site together with the corresponding reduction in Tmrt. Similarly to the shadow of buildings, the influence of trees in Duxton3 also varies between different seasons (SW- Monsoon vs InterMonsoon) (Section 4.1.2).
In the case of Pinnacle1, during the morning period, trees reduce with a different rate the incoming solar radiation reaching the site. This is due to different solar transmissivity of the trees and/or combination of tress at different sun elevations. Tmrt peak occurs at ~12:30 reaching 50.3°C. After this, similar to Pinnacle2, the blocking of solar radiation by the high-rise building is responsible for Tmrt decrease.
ALL PERIOD
Fig. 5 Mean diurnal cycle of wind speed (WS), air temperature (Ta), vapour pressure (e) and mean radiant temperature (Tmrt) in Duxton3, Duxton4, Pinnacle1, Pinnacle2 in Duxton Park (4th July and 23rd October 2019)
3.1.1.2 Air Temperature
Mean air temperature (Ta) presents highest value (Table 2) during midday/afternoon in Duxton3 due to higher exposure to solar radiation that warms the surrounding area. During this period of the day, highest difference occur with Pinnacle1 (∆Ta = -1.5°C) due to the cooling effect of surrounding vegetation (trees and scrubs) in this site together with a higher ventilation (Section 4.1.1.3). However, with respect to Duxton3, Duxton4 only shows slightly lower values (∆Ta = -0.3°C) because of a lower ventilation and heat stagnation in the latter.
After sunset and during the night the difference between all sites is very small. However, night mean Ta
decrease around 1°C with respect to the after-sunset period due to the continuous release of accumulated heat during the daytime.
The highest mean Ta (~32°C) occurs at Duxton3 at ~14 h. Duxton4 presents a peak at the same time but 0.5°C lower due to its location under the tree canopy. On the other hand, the diurnal cycle of Pinnacle1 and Pinnacle2 (Figure 5) is influenced by the shadowing of the high-rise building that reduces surface temperature and thus air temperature. Both sites have a peak at ~13:00h. However, the peak in Pinnacle1 is 0.8°C lower than in Pinnacle2 due to the influence of tree shadowing in the surrounding of the site. As shown in Tmrt values, this reduction of solar radiation by trees in Pinnacle1 occurs during most of the morning period.
Despite tree shadowing in Duxton4 reduces Tmrt during the afternoon period, mean Ta remains high. In the case of Duxton4 lack of ventilation and air mixing under the tree canopy causes heat trapping avoiding a reduction of Ta.
Contrary to the daytime period, around sunset (~19:00h) Duxton4 shows higher mean Ta than Duxton3 (up to 0.2°C). This pattern continues all through the night until ~7.30h (close to sunrise). These results are in agreement with the tree canopy covering Duxton4 (i.e. lower SVF). Again, higher SVF in Duxton3 facilitates urban heat release and thus enhances the night-time cooling effect. During the night Pinnacle1 and Pinnacle2 show similar values influenced by the nearby buildings.
3.1.1.2 Wind Speed
Duxton4 shows the lowest mean wind speed (WS) values during the whole day, but quite close to Duxton3 (Table 1), especially during the morning and night periods. In Pinnacle2 values are slightly higher than in Duxton3 during the whole day, and Pinnacle 1 is the site with highest mean WS in every period of the day, doubling values in Duxton3. These results can also be seen in the 10-min diurnal profile of the Wind Speed (Figure 5).
Maximum mean WS in Pinnacle1 reaches 1.6 m/s but only 0.7m/s in Duxton4, both between 13:00- 14:00 h. Night-time mean values in Duxton4 are low and can reach a minimum (0.3 m/s) close to sunrise. This site is influenced by the presence of a low tree canopy that reduces air ventilation beneath it.
Pinnacle2 has lower ventilation than Pinnacle1 although they are only 40 meters apart and the orientation of the canyon is similar. However, configuration of urban elements and opening in the high- rise buildings can cause this difference.
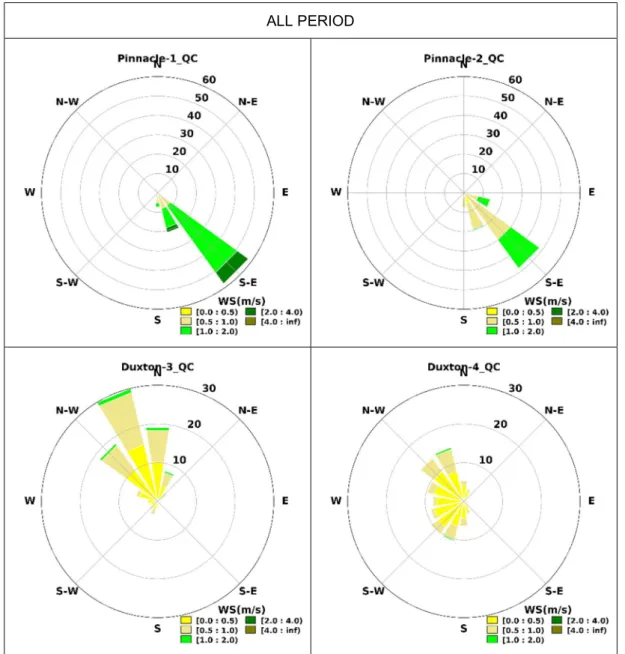
The urban arrangement that surrounds the four sites is responsible for different wind directions. Figure 6 show the wind rose for each site during the period of measurements. It is clearly shown that Pinnacle1 and Pinnacle2 are influenced by the nearby high-rise building causing the air to flow (in the SE direction) parallel to the façade. Although the four sites are aligned one after the other in the NNW direction, Duxton3 and Duxton4 (surrounded by low-rise buildings) show a different wind pattern. Duxton3 have basically opposite wind directions to Pinnacle1 and Pinnacle2, and Duxton4 does not show a predominant wind direction (similar frequency of occurrence between the NNW and the SSW direction).
Together with this flow pattern, the low wind speed indicates again, as commented in the previous paragraph, an influence of the tree canopy that increases turbulence and reduces air intensity.
In Duxton3 and Duxton4, 96.7% and 98.8% of the time respectively, WS is lower than 1 m/s. On the contrary, in Pinnacle1 only 32.2% of the time is below 1m/s. Pinnacle1 has 52.9% of the time wind speed between 1 and 2 m/s in the SE and SSE directions, and 9.4% of the time between 2 and 4 m/s.
These last WS values are only reached in Pinnacle1. Pinnacle2 maximum wind speed records are in the range of 1 to 2 m/s, occurring for 24.9% of the time, mostly in the SE direction.
ALL PERIOD
Fig. 6 Wind rose for Duxton3, Duxton4, Pinnacle1, Pinnacle2 in Duxton Park (4th July and 23rd October 2019) An analysis of the influence of wind speed in air temperature has been done for predominant wind directions, i.e. SE and SSE for Pinnacle1 and Pinnacle2, SSW-SW and NW-NNW for Duxton4, and NW-NNW-N for Duxton3. Different periods for the day (morning, midday/afternoon, evening, after sunset and night) under non-rainy conditions have been considered (Table 2, 3, 4).
Both Pinnacle 1 and Pinnacle 2 show the influence of WS in the cooling potential of the nearby vegetation (tress, scrubs). The capacity of vegetation to cool the nearby Ta is well known and has been confirmed in this report (Section 9.1). However, during daytime an increase in WS is generally reflected in an increase of Ta. Thus, the cooling effect of vegetation is specially noticed in calm situations. As wind speed increases, mixing and advection of air from hotter areas reduces the impact of vegetation in cooling the nearby air. During the night (0:00 to 6:00), after surfaces have released most of the heat accumulated during daytime, Ta difference between wind speed ranges is lower. The highest Ta
difference between wind speed ranges occurs in the evening (~1°C) in both Pinnacle1 and Pinnacle2 (Table 2).
Duxton4 shows a similar pattern to Pinnacle1 and Pinnacle2. Especially during the morning, midday and afternoon, higher wind speed shows higher Ta due to hotter air reaching the site and mixing with the cool air below the tree canopy. No significant difference between wind directions (NW-NNW vs SSW-SW) is encountered (Table 3). However, in the evening the effect of wind speed is inverted (i.e.
lower Ta with higher WS). Although difference is small, this could be related to a higher amount of vegetation and vegetated ground around Duxton4 (in comparison to Pinnacle1 and Pinnacle2). This way, less overheated surrounding surfaces around Duxton4 (higher extension of vegetated area and low rise development) can maintain the cooling potential of nearby vegetation when WS increases in the evening.
Duxton3 presents a slightly different pattern to the other three sites, in agreement with the openness and urban/vegetation elements surrounding it. Although there is no strong impact of tree shadowing, most of the nearby ground is grass (not as in Pinnacle1 and Pinnacle2). In the case of Duxton3 there is a slight increase in Ta when moving from a calm situation (<0.5 m/s) to higher WS condition (0.5-1 m/s). However, Ta decreases when further increasing WS, especially in the evening (0.3°C) (Table 4).
Depending on the site, different performance of air temperature with respect to wind speed have been encountered. In comparison to parks, the cooling effect of vegetation in urbanized areas is reduced significantly when increasing wind speed during daytime, due to mixing with surrounding hotter air. In the case of parks in low rise developments, lower overheating of the surroundings can be the reason of the benefits in Ta (small reduction) when WS increases.
Table 2 Mean air temperature values (°C) for the more frequent wind directions and specific wind speed ranges for Pinnacle1 and Pinnacle2 in Duxton Park (4th July and 23rd October 2019)
Site Wind
Speed
Morning Afternoon Evening After
sunset Night
SE SSE SE SSE SE SSE SE SSE SE SSE
Pinnacle1
<=0.5 27.9 28.0
0.5-1 28.2 28.2 29.8 30.8 29.1 28.8 28.5 28.7 28.0 28.0 1.0-2.0 28.3 28.5 30.4 30.6 29.9 29.7 28.7 28.9 28.1 28.1 2.0-4.0 28.4 28.5 30.4 30.6 30.0 30.2 28.9 29.0 28.1 28.1
Pinnacle2
<=0.5 28.3 28.3 31.3 31.3 29.4 29.3 28.6 28.7 28.0 28.0 0.5-1 28.7 28.7 31.4 32.0 30.1 29.9 29.0 28.8 28.1 28.0
1.0-2.0 28.7 31.3 30.5 29.1 28.2
2.0-4.0
Table 3 Mean air temperature values (°C) for specific wind directions and and specific wind speed ranges for Duxton4 in Duxton Park (4th July and 23rd October 2019)
Site Wind
Speed
Morning Afternoon Evening After sunset Night NW-
NNW SSW-
SW NW-
NNW SSW
-SW NW-
NNW SSW
-SW NW-
NNW SSW
-SW NW-
NNW SSW
-SW
Duxton4
<=0.5 28.3 28.7 31.6 31.6 30.5 30.6 29.0 29.0 28.0 28.1 0.5-1 28.9 29.3 31.8 31.8 30.4 30.4 29.2 29.1 28.3
1.0-2.0 32.0 32.2
2.0-4.0
Table 4 Mean air temperature values (°C) for the more frequent wind directions and specific wind speed ranges for Duxton3 in Duxton Park (4th July and 23rd October 2019)
Site Wind Speed
Morning Afternoon Evening After sunset Night
NW-NNW-N NW-NNW-N NW-NNW-N NW-NNW-N NW-NNW-N
Duxton3
<=0.5 28.4 31.7 30.8 28.8 27.8
0.5-1 28.6 32.0 31.0 29.1 28.0
1.0-2.0 28.5 31.9 30.7
2.0-4.0 3.1.1.4 Vapour pressure
As shown in Table 1, lowest mean vapour pressure (e) values are registered in Duxton3 during the midday/afternoon period (25.3 hPa). In Duxton3, highest values are reached during the morning (27.4 hPa) and night period (27.6 hPa). Other sites present less difference between periods of the day due to closer presence of vegetation. During daytime vegetation should increase evapotranspiration as the plant stomata open for photosynthesis. Since Pinnacle1, Pinnacle2 and Duxton4 are closer to vegetation, the impact of evapotranspiration in ambient e levels is expected to be higher (Figure 5).
From a general point of view, e in all sites is high as expected in Singapore (humid tropical region). The diurnal profile (Figure 5) shows that the highest values during night and first hours in the morning reach a maximum ~27.7 hPa with slight variation between sites (±0.3 hPa). After 9:00 there is a drop of the mean values reaching a minimum in the afternoon 13:00-14:00 lasting until 17:00. This diurnal cycle is in agreement with a turbulent mixing in lower atmosphere and the effect of vegetation. During the night, water vapour released by vegetation together with lower wind speed conditions (less mixing with background air), is the reason for higher e values in all sites. During daytime, as commented previously, vegetation should open their stomata for photosynthesis and increase e levels in a close distance.
However, there are other mechanisms that could reduce/minimize water loss from vegetation (e.g. low soil moisture levels) increasing stomata resistance and partial closure of these. However, in the measured sites, drop of e levels during daytime is associated with the background conditions of the urban area (less vegetated in general) and predominant climate. Higher wind speed during daytime allows advection of less humid air to reach the sites and reduce the influence of local vegetation. Still, daytime evapotranspiration can be noticed when comparing the different sites. Sites like Duxton3 with less dense vegetation close to the sensors (i.e. less sources of humidity), register during daytime the lowest e values.
3.1.2. Seasonal mean values and differences
The following results correspond to the analysis of the simultaneous measurements carried out in the four sites in Duxton Park area in two different periods of the first campaign:
a) 1st to 31st of August 2019, representative of the SW-Monsoon Season b) 1st to 23rd of October 2019, representative of the Inter-Monsoon season
In Table 5 we present the mean climatic values for the different seasons in different periods of the day (morning, midday/afternoon, evening, after sunset and night).
Table 5 Mean values of wind speed (WS), air temperature (Ta), vapour pressure (e) and mean radiant temperature (Tmrt) in Duxton3, Duxton4, Pinnacle1 and Pinnacle2 during the SW-Monsoon (1st to 31st of August 2019), as well as the difference of the previous variables in the Inter-Monsoon (1st to 23rd of October 2019) with respect to the SW-monsoon (e.g. ∆ represents values in the Inter-Monsoon minus values in the SW-Monsoon)
Site Variable
Morning Midday/
Afternoon Evening After Sunset Night
SW
Monsoon ∆ SW
Monsoon ∆ SW
Monsoon ∆ SW
Monsoon ∆ SW
Monsoon ∆
Duxton3
Tmrt 33.9 3 59.3 -2 40.2 -5.9 27.8 -0.6 26.7 -0.3
WS 0.6 -0.1 0.9 0 0.8 -0.1 0.6 -0.1 0.5 -0.1
Ta 28.6 0 32 -0.6 31.1 -1.5 29 -0.6 28 -0.4
e 27.6 -0.4 25.1 0 25.2 0.5 26.8 -0.3 27.5 -0.4
Duxton4
Tmrt 31 3.4 41.7 3.1 33.9 -2.8 28.8 -0.5 27.8 -0.3
WS 0.5 0 0.7 0.1 0.6 0 0.5 0 0.4 -0.1
Ta 28.4 0.1 31.6 -0.4 30.9 -1.4 29.1 -0.6 28.1 -0.3
e 28 -0.5 25.8 -0.1 25.7 0.4 27 -0.3 27.6 -0.4
Pinnacle1
Tmrt 31.4 2.4 45.1 -4.5 32.7 -2.7 29.1 -1.1 28.3 -0.6
WS 1.6 -0.7 1.6 -0.1 1.7 -0.5 1.5 -0.6 1.4 -0.7
Ta 28.2 0.1 30.4 -0.6 30 -1.2 28.8 -0.5 28 -0.2
e 27.8 -0.6 25.5 0.2 25.6 0.4 27 -0.4 27.5 -0.4
Pinnacle2
Tmrt 34.5 4.5 57.1 -9.8 32.9 -3.1 28.3 -1 27.4 -0.5
WS 1 -0.4 1 -0.2 1 -0.3 0.9 -0.4 0.8 -0.3
Ta 28.4 0.2 31.7 -1.2 30.4 -1.5 28.9 -0.7 28.1 -0.3
e 28 -0.5 25.9 0.1 25.9 0.3 27.2 -0.3 27.8 -0.5
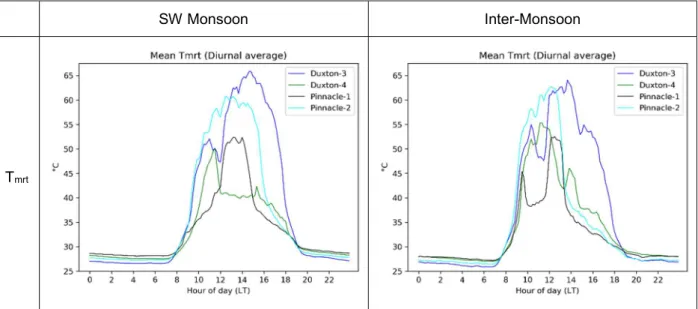
Similar to the results for the whole measuring period (Section 4.1.1), in both the SW-Monsoon and Inter- Monsoon during the morning period, mean Tmrt values are highest in Pinnacle2 followed by Duxton3, but with small differences with respect to other sites. Although Pinnacle2 and Duxton3 are highly influenced by solar radiation during the morning period, slightly higher values in Pinnacle2 could be
attributed to solar reflection in the high-rise building, as well as the overheating of the building itself in the late morning.
Also, during the midday/afternoon period, mean Tmrt values in the SW-Monsoon for Pinnacle2 and Duxton3 are quite similar but with higher difference with respect to the other sites (Duxton4 and Pinnacle1). Curiously, in Pinnacle2 during the Inter-Monsoon season mean Tmrt values are 9.8°C lower than in the SW-Monsoon. Considering that such a big difference between seasons is not present in the rest of the sites, the reduction cannot be associated with different cloud cover conditions but with elevation of the sun and the change in timing of the shadow produced by the nearby high-rise building.
This shadow also affects Pinnacle1, but Tmrt drop between seasons during the midday/afternoon is lower (4.5°C) because Pinnacle1 is already (before the shadow of the building) under the influence of vegetation that partly blocks solar radiation reaching the site. For further description of this effect see Section 9.2 where the influence of the high-rise building shadow is analysed in two specific days.
The Tmrt difference between seasons can mostly be explained by the elevation of the sun, and cloud cover at different periods of the day. During the morning period, all sites show higher mean Tmrt values in the Inter-Monsoon season that could be related to less cloudy skies at this time of the day. However, high frequency of showers occurring at midday/afternoon compared to a dry August 20191 (SW- Monsoon) could cause lower mean Tmrt values in the Inter-monsoon season. An exception to this is Duxton4 where the geometry and physiology of the different vegetation species surrounding the site allows higher solar transmissivity in the Inter-Monsoon season, and thus higher mean Tmrt is encountered. After sunset and during the night mean Tmrt differences between sites and sensors are mostly negligible.
As commented in the previous paragraph, the diurnal profile of Tmrt (Figure 7) varies between seasons and thus shows the effect of different urban features/elements. Most of Tmrt peaks have a time lag of
~30 minutes. It is especially notable in Duxton3, where its two daily Tmrt peaks occur later in the SW- Monsoon season. These peaks reach different values depending on the season (slightly highest in the SW-Monsoon). The systematic time lag in the peaks is associated with the sun elevation in each season that influences the shadow produced by vegetation (in the case of Duxton3).
Between seasons, the pattern of Tmrt diurnal cycle in Duxton3 and Pinnacle2 is maintained. However, this is not the case of Pinnacle1 and Duxton4 that show differences between seasons. Actually, Pinnacle1 shows two peaks in the Inter-Monsoon season (at 9.50 and 12:30), while only one in the SW Monsoon (at 13 h). The maximum value in the afternoon is similar (~52°C) in both seasons. Duxton4 presents the highest peak (55°C) around 11.30 in the Inter-Monsoon, which is lower in the SW-Monsoon season (49°C) also 30 minutes later (at 12.00). In this site, a secondary peak occurs around 14.00, but only in the Inter-Monsoon season, which again justifies the influence of vegetation morphology and
1 National Environmental Agency (NEA) of Singapore.
physiology with respect to the sun elevation throughout the year and the corresponding impact on solar transmissivity and local Tmrt.
The mean Ta is generally higher in the SW-Monsoon season, except in the morning that negligible differences between sites can be found. Relevant differences (1.2-1.5°C) can be found in the evening between both seasons mostly related to higher solar radiation and less precipitation2 in the SW- Monsoon that turns in higher daytime accumulated heat, and thus higher air temperature.
Similarly, higher frequency of showers during the late afternoon in the Inter-Monsson season with respect to the SW-Monsoon season justify higher mean e values specially is the evening period linked to levels soil wetness. After sunset, during the night and the morning, mean records are higher in the SW-Monsoon associated with background regional conditions and higher levels moisture in the air.
SW Monsoon Inter-Monsoon
Tmrt
Fig. 7 Mean Tmrt diurnal cycle in Duxton3, Duxton4, Pinnacle1, Pinnacle2 in Duxton Park in two different seasons:
SW-Monsoon (1st to 31st August 2019) and Inter-Monsoon (1st to 23rd October 2019)
Regarding wind speed, higher values occur in the SW-Monsoon season at all sites (Table 5). Between sites, Pinnacle1 registers the highest mean values in both seasons. Pinnacle1 is also the site with highest mean differences between the SW-Monsoon and the Inter-monsoon season, especially during the night and morning (0.7m/s). On the contrary, Duxton3 and Duxton4 show less differences due to their location in a stagnation area were low wind speed is registered throughout the year.
Between seasons, the WS diurnal profile in Duxton3 and Duxton4 shows similar evolution although Duxton4 has lower values in the SW-Monsoon (Figure 8). In the Inter-Monsoon season both sites reach a maximum of 0.8 m/s in the afternoon. On the contrary, Pinnacle1 and Pinnacle2 show different patterns in the SW-Monsoon and the Inter-Monsoon. During the SW Monsoon both sites show less WS variation throughout the day (0.5 m/s for Pinnacle1 and 0.3m/s for Pinnacle2), whereas in the Inter-
2 National Environmental Agency (NEA) of Singapore.
https://www.nea.gov.sg/media/news/advisories/index/expect-another-dry-and-warm-fortnight
Monsoon, diurnal variation is much higher, especially in Pinnacle1 (up to 1.2m/s). Similar to Duxton3 and Duxton4, in the Inter-Monsoon season all station (Duxton3, Duxton4, Pinnacle1 and Pinnacle2) show the maximum value in the afternoon around 13:00.
SW Monsoon Inter-Monsoon
WS
Fig. 8 Mean WS diurnal cycle in Duxton3, Duxton4, Pinnacle1, Pinnacle2 in Duxton Park in two different seasons:
SW-Monsoon (1st to 31st August 2019) and Inter-Monsoon (1st to 23rd October 2019)
As mentioned in the previous paragraphs, higher frequency of showers during the afternoon in the Inter- Monsson season with respect to the SW-Monsoon season justify higher mean e values, especially in the late afternoon (Table 5) linked to levels soil wetness. This can be clearly seen in the diurnal profile.
The SW-Monsoon (drier afternoon) maintain minimum e values until 16.00 while the Inter-Monsoon they increase after 13.00. These results are aligned with the mean Ta differences between seasons (higher in the SW-Monsoon) during the afternoon and evening.
SW Monsoon Inter-Monsoon
e
Fig. 9 Mean e diurnal cycle in Duxton3, Duxton4, Pinnacle1, Pinnacle2 in Duxton Park in two different seasons:
SW-Monsoon (1st to 31st August 2019) and Inter-Monsoon (1st to 23rd October 2019)
3.2 Thermal comfort
The following results present an analysis of the mean thermal comfort levels (based on PET index) throughout the day when all sites in Duxton Park area recorded simultaneously (4th July to 23rd October 2019).
3.2.1 Mean values during the campaign
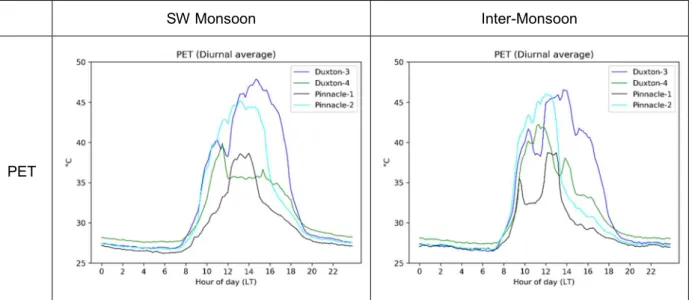
Figure 10 shows the 10-minute mean diurnal cycle of PET values in Pinnacle1, Pinnacle2, Duxton3 and Duxton4. The hourly evolution of PET throughout the day is quite different in the four sites, both in maximum levels reached and in the timing of those. However, there is a close relationship between the mean Tmrt diurnal pattern (Figure 5) and the one of PET (Figure 10). This could be expected since Tmrt
is one of the variables that has higher influence in thermal comfort, especially in the absence of high wind conditions.
Highest PET levels (maximum values and duration of them) occur in Duxton3 (an open low-rise development) in relation to high solar radiation exposure and thus high Tmrt values together with low wind speed conditions (Section 4.1.1).
Fig. 10 Mean PET diurnal cycle in Duxton3, Duxton4, Pinnacle1, Pinnacle2 in Duxton Park (4th July and 23rd October 2019)
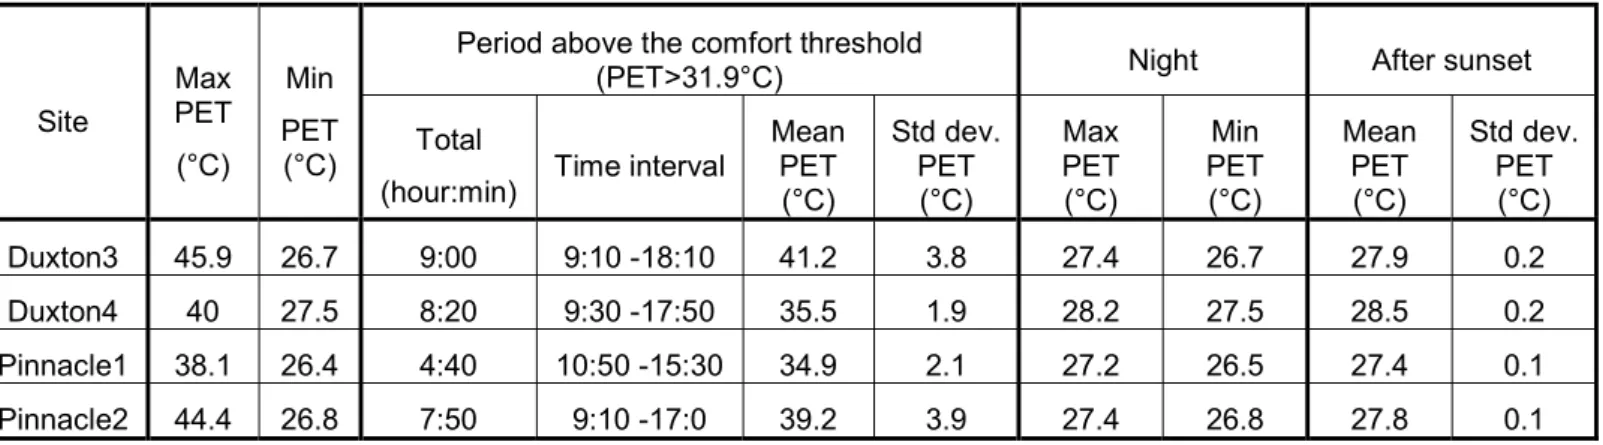
Table 6 shows an analysis of the PET peak characteristics in each site. The PET peak is considered the period when PET is above 31.9 °C, i.e. above the acceptable thermal comfort range for Singapore (Heng & Chow, 2019). Duxton3 not only has the highest maximum mean PET value (45.9°C) during the measurement campaign, but also the highest period of time with values above the acceptable
comfort range (9 hours). The best OTC (lower PET levels) is obtained in Pinnacle1 where maximum PET value reaches 38.1°C and the period above the acceptable PET range is only 4:40 hours. As described in previous sections, results in Pinnacle 1 are influenced by the shadowing of trees and buildings as well as higher wind speed.
After Duxton3, Pinnacle2 shows the second highest maximum PET value (44.4°C) and the second highest mean PET value during the peak period (39.2°C). However, although Duxton4 (under tree canopy) has a lower mean PET value during the peak period (35.5°C), both sites have similar time above the acceptable range (7:50 and 8:20 hours respectively). In the case of Duxton4, the PET peak period is characterized by low PET differences (low PET standard deviation) due to the influence of a tree canopy during most of the time. On the contrary, Pinnacle2 is under direct solar radiation during a relevant part of the day, with very high PET values that drop with the shadow of the high-rise building (Section 4.4.1 and 9.2)
After sunset (between 20:00 and 23:00) and during the night, wind speed is the main factor governing PET levels. Highest PET values are registered in Duxton4 (28.5°C after sunset and 28.2°C during the night) because of the low wind speed in this site. Lowest PET values in Pinnacle1 are associated to higher wind speeds compared to the rest of the sites.
Table 6. Representative values for the PET diurnal cycle in Duxton3, Duxton4, Pinnacle1, Pinnacle2 Duxton Park (4th July and 23rd October 2019)
Site
Max PET (°C)
Min PET (°C)
Period above the comfort threshold
(PET>31.9°C) Night After sunset
Total
(hour:min) Time interval
Mean PET (°C)
Std dev.
PET (°C)
Max PET (°C)
Min PET (°C)
Mean PET (°C)
Std dev.
PET (°C)
Duxton3 45.9 26.7 9:00 9:10 -18:10 41.2 3.8 27.4 26.7 27.9 0.2
Duxton4 40 27.5 8:20 9:30 -17:50 35.5 1.9 28.2 27.5 28.5 0.2
Pinnacle1 38.1 26.4 4:40 10:50 -15:30 34.9 2.1 27.2 26.5 27.4 0.1
Pinnacle2 44.4 26.8 7:50 9:10 -17:0 39.2 3.9 27.4 26.8 27.8 0.1
3.2.2 Seasonal mean values and their differences
Accordingly to changes in climate variables in between the SW-monsoon and the Inter-Monsoon season, the PET diurnal cycle and the shape of the PET peak also show differences. From a general perspective, a shift in the peaks’ maximum values can be related to different solar elevation between seasons that influences the shadowing of surrounding elements in the measuring sites (Figure 11). It is notable that Pinnacle1 shows two peaks in the inter-Monsoon season while only one in the SW- Monsoon. Also the pattern in Duxton4 shows clear differences. Finally, Pinnacle2, in the Inter-Monsoon, decreased PET more sharply just after noon (12:00-13:00) is mainly influenced by the shadow of the nearby high-rise building. This sharp drop in PET values in the Inter-Monsoon could also be affected by higher cloud cover (low diffuse solar radiation) during the afternoon showers in Inter-Monsoon season. In any case, the period above the thermal acceptable criteria is 1:50 h lower in the Inter- monsoon season compared to the SW-monsoon. Pinnacle2 is the site with highest difference between the two seasons regarding the period above the thermal acceptability range (Table 7).
SW Monsoon Inter-Monsoon
PET
Fig. 11 Mean PET diurnal cycle in Duxton3, Duxton4, Pinnacle1, Pinnacle2 in Duxton Park in two different seasons:
SW-Monsoon (1st to 31st August 2019) and Inter-Monsoon (1st to 23rd October 2019)
In both seasons, the maximum PET value is in Duxton3. A higher difference in the maximum PET between Duxton3 and Pinnacle2 occurs in the SW-monsoon. As shown in Section 4.1.2 this is associated with the difference in maximum Tmrt values between both sites in each season. Also, higher WS in Pinnacle2 at midday during the SW-Monsoon season, reduces PET levels and at this time of the day, and increases differences with respect to Duxton3.
As commented in previous Sections, in Duxton4 solar elevation influences the shadowing of the tree canopy and generates differences in the diurnal PET profile. In the Inter-monsoon season, Duxton4 has a higher maximum PET than the Inter-Monsoon (Table 7). Similarly, Pinnacle1 shows different hourly evolution in both seasons (timing of peaks), although the maximum PET value is the same.
Difference between minimum PET values in all sites (in both seasons) is ~1°C, mainly influence by wind speed levels.
Table 7. Representative values for the PET diurnal cycle in Duxton3, Duxton4, Pinnacle1, Pinnacle2 during the SW-Monsson (1st to 31st of August 2019), as well as the difference of the previous variables in the Inter-monsoon (1st to 23rd of October 2019) with respect to the SW-monsoon (e.g. ∆ represents values in the Inter-Monsoon minus values in the SW-Monsoon)
Site
Max PET (°C)
Min PET (°C)
Period above the comfort threshold (PET>31.9°C) Total (hour:min) Time interval Mean PET
(°C) SW
Monsoon ∆ SW
Monsoon ∆ SW
Monsoon ∆ SW
Monsoon
Inter Monsoon
SW Monsoon ∆ Duxton3 47.9 1.4 27 0.3 9:10 0:20 9:20-18:30 9:0-17:50 41.7 0.9 Duxton4 39.9 -2.3 27.7 0.2 8:30 0:50 9:40-18:10 9:20-17:0 35.4 -1.5 Pinnacle1 38.7 0 26.3 -0.4 4:50 0:10 11:10-16:0 9:10-13:50 35.4 0.9 Pinnacle2 45.2 -0.8 26.8 0 8:20 1:50 9:20-17:40 8:50-15:20 39.9 0.3
4 Quantitative analysis of the sites in the CBD area
The following chapter presents an analysis of the measurements carried out in the CBD area (RobinsonRd, McCallumSt, BoonTatSt, BoonTat711 and AsiaSquare). It includes an evaluation of the mean climate values measured simultaneously during the campaign as well as the difference between seasons (NE-Monsoon and dry Inter-Monsoon). Finally, an analysis of OTC levels is presented.
4.1 Climate variables
4.1.1. Mean values in the wet NE Monsoon period
The following results correspond to the analysis of the simultaneous measurements carried out in four sites in the CBD Area (RobinsonRd, BoonTatSt, BoonTat711 and McCallumSt) between 15th November 2019 and 13th January 2020. During most of this period AsiaSquare was dismantled and thus is not considered in the analysis.
In Table 8 we present the mean climatic values in different periods of the day (morning, midday/afternoon, evening, after sunset and night).
4.1.1.1 Mean radiant Temperature
Depending on the measurement site and the urban morphology surrounding it, highest mean Tmrt occur in the morning or the midday/afternoon period.
During the morning, mean Tmrt values are highest in BoonTat711 (partly open urban area; asymmetrical aspect ratio) due to high exposure to solar radiation. The lowest values are in RobinsonRd (8.9°C lower than in BoonTat711) due to the difference in street orientation and SVF (higher in BoonTat711). In the afternoon, BoonTatSt and BoonTat711 register similar results. At this time differences between these two stations and McCallum can reach a 3.1°C.
In BoonTat711, after sunset and during the night, lack of solar radiation reduce Tmrt values to 27.3°C and 26.4°C respectively, with negligible differences with the rest of the sites (up to ±0.3°C).
The analysis of the 10-min Tmrt diurnal profile (Figure 12) show clearly the influence of the street orientation. BoonTatSt, BoonTat711 and McCallum are NW-oriented streets, while RobinsonRd is in the NE direction. During the wet NE-Monsoon period, there is a difference of ~4 hours between the Tmrt
peak of the two orientated streets (at ~10.10 in the NW-oriented and at 14.00 in the NE-oriented street).
Additionally, the peak at RobinsonRd is lower than at the other sites which can be explained by higher cloud cover and showers during the afternoon3, and thus, lower solar incoming radiation.
3 National Environmental Agency (NEA) of Singapore.
https://www.nea.gov.sg/media/news/advisories/index/expect-another-dry-and-warm-fortnight
Table 8 Mean values of wind speed (WS), air temperature (Ta), vapour pressure (e) and mean radiant temperature (Tmrt) in BoonTat711 during different periods of the day for the wet NE- Monsoon season (15th November 2019 and 13th January 2020), together with the differences in BoonTatSt, McCallumSt and RobinsonRd (e.g. ∆Ta in RobinsonRd represents Ta,RobinsonRd- Ta,BoonTat711)
Site Variable Morning Midday/
Afternoon Evening After
Sunset Night
BoonTat711
Tmrt 36.2 34.3 28.9 27.3 26.4
WS 0.6 1 0.9 0.6 0.5
Ta 27.7 29.6 28.5 27.6 26.8
e 26.2 25.6 25.8 26.1 26.1
BoonTatSt
∆Tmrt -4.4 0.3 0.4 0.1 0.3
∆WS -0.2 -0.5 -0.5 -0.2 -0.2
∆Ta 0.1 0.6 0.4 0.3 0.3
∆e 0.4 0.4 0.4 0.4 0.4
McCallumSt
∆Tmrt -6.6 -3.1 -1.4 -0.3 0.2
∆WS 0.4 0 0 0.3 0.6
∆Ta -0.5 -0.3 -0.1 0 0.1
∆e 0.2 0.1 0.1 0.2 0.2
RobinsonRd
∆Tmrt -8.9 -1.7 -1.1 -0.3 0.2
∆WS 0.1 -0.3 -0.2 -0.1 -0.1
∆Ta -0.5 -0.2 0 0 0.1
∆e 0.1 -0.1 0 0.1 0.2
After the morning peak, Tmrt values in McCallum are ~4°C lower than in BoonTatSt and BoonTat711 (although they have the same street orientation). These results are due to a lower sky view factor in McCallum that reduces diffuse and reflected solar radiation reaching the site. Until 16:00 differences between these three sites remain mostly the same, but slowly reduces afterwards. By sunset all three sites show similar Tmrt.
Wet NE-Monsoon
Fig. 12 Mean diurnal cycle of wind speed (WS), air temperature (Ta), vapour pressure (e) and mean radiant temperature (Tmrt) in BoonTat711, BoonTatSt, McCallumSt and RobinsonRd inside the CBD area during the wet NE-Monsoon season (15th November 2019 and 13th January 2020)
4.1.1.2 Air Temperature
During the morning period, BoonTatSt and BoonTat711 have similar Ta. Also, McCallum and RobinsonRd have the same Ta, 0.5°C lower than the two BoonTat sites. Results agree with the type of urban development in each site. High-rise development and lower SVF in RobinsonRd and McCallum delay the morning warming up phase near ground due to lower incoming solar radiation. On the contrary, partly open urban areas and low-rise developments show in the morning period higher Ta, as shown in Figure 12.
Mean Ta values are highest (Table 8) during midday/afternoon in BoonTatSt (30.2°C), 0.6°C higher than BoonTat711 (second warmest site). Although both sites have a high SVF, the difference can be attributed to a higher ventilation of BoonTat711 (see Section 5.1.1.3), closer to the sea, in a partly open area. During the evening, BoonTatSt remains the hottest site (due to lack of ventilation), while the other
three sites show negligible mean Ta differences between them. The same situation occurs after sunset and during the night. In this case, BoonTatSt does not show a higher night-time cooling potential (as would be expected due to its high SVF) in comparison to the rest of the sites. Night-time heat release in BoonTatSt could be limited by the low wind intensity. Nonetheless, a continuous decrease in Ta
occurs during the night that reaches a minimum value between 6.00 and 7.00 (close to sunrise).
The Ta peak at BoonTatSt, BoonTat711 and McCallum occur between 12.30 and 14.30 (Figure 12) with a similar pattern. Although RobinsonRd’s peak also occurs in the same period (14.00), it is a sharper peak, i.e. less time with maximum values. Ta peak values are lowest in McCallum, 0.9°C lower than in BoonTatSt, influenced by higher ventilation and mixing with cooler air masses.
RobinsonRd site shows a good relation between Tmrt and Ta peak values, due to the orientation of the street where it is located. However, this is not the case for BoonTatSt, BoonTat711 and McCallum where higher incoming solar radiation levels occur during the morning period raising Tmrt values.
4.1.1.3 Wind Speed
BoonTatSt shows the lowest mean wind speed (WS) values during the whole day, while highest values occur in MacCallum (Table 8). During the night-time period mean WS values are below 0.5m/s in BoonTatSt, BoonTat711 and RobinsonRd, while McCallum reaches values above 1m/s (Figure 12).
BoonTatSt and BoonTat711 present a clear diurnal variation with higher WS values during the midday/afternoon period (Figure 12). However, at this time BoonTat711 can double the wind intensity of BoonTatSt due to the location of the former close to the coast in a more open area.
As well as the mean wind speed values are affected by the specific location and characteristics of measurement site, the street orientation is responsible for different wind directions.
Figure 13 shows the wind roses for each site during the wet NE-Monsoon period. Street orientation is clearly reflected in the wind direction measured in all sites, both high-rise and low-rise developments.
This is especially significant for the case of RobinsonRd. BoonTatSt show a slightly rotation with respect to the street orientation probably due to the influence of the lamppost in which it was mounted. Also BoonTat711 shows a wider range of wind directions which is mainly due to its location close to a street intersection.
The lowest WS recorded in BoonTatSt are from the W-WNW. 43.9% of time BoonTatSt registers these wind directions and wind speed lower than 0.5m/s. On the contrary, BoonTat711 shows lower percentage of occurrence (23%) for these wind conditions, where as 11.8% of the time wind from the sea (ESE) can register speeds higher than 1 m/s. Finally, as commented previously, the McCallum site shows a much better ventilation potential reaching 40.3% of the time wind speeds are higher than 1m/s for the W and WNW directions.
In RobinsonRd, 54.9% of the time, wind directions are in the SSW-SW-WSW, and 24.8% of the records are between 0.5 and 1 m/s. Although the period analysed in this Section corresponds to the wet NE-
Monsoon only 28% of the time wind corresponds to NNE-NE-ENE directions. The difference in the frequency of occurrence between the SW and NE directions is influenced by the NE-Monsoon conditions not being well stablished in Singapore during the last 2 weeks of November, when the transition from the Inter-Monsoon conditions took place. Also, movement of vehicles near the sensor could have affected the records (see Section 6).
NE-Monsoon (wet)
Fig. 13 Wind rose for BoonTat711, BoonTatSt, McCallum and RobinsonRd inside the CBD area during the wet NE-Monsoon season (15th November 2019 and 13th January 2020)
4.1.1.4 Vapour pressure
Table 8 and Figure 12 show that the difference between vapour pressure in the four sites is small and the diurnal profile is quite similar in all of them with constant values throughout the night (26.2±0.2 hPA) and dropping ~0.7 hPa during midday. During the evening and after sunset a slower increase is registered to reach night-time values.
BoonTatSt, BoonTat711 and McCallum sites did not have any vegetation in the surrounding. Only, RobinsonRd has a small vegetated area close by, but has to be considered negligible from the perspective of influencing ambient humidity. In this sense, mean e values recorded during the wet NE- Monsoon are even lower than in a vegetated area in the SW-Monsoon and wet Inter-Monsoon seasons (e.g. Duxton Park) where night-time values can reach ~27.5 hPa.
4.1.2. Mean values in the dry NE Monsoon period
The following results correspond to the analysis of the simultaneous measurements carried out in three sites in CBD Area (RobinsonRd, BoonTatSt and BoonTat711) between 1st February 2020 and 30th March 2020. As explained in Section 3.2.2, McCallum’s sensors were removed on mid-January and since then no records are available. AsiaSquare was deployed on the 14th March and only a comparison between the last 2 weeks of this period is shown (on Section 5.1.3).
In Table 9 we present the mean climatic values in different periods of the day (morning, midday/afternoon, evening, after sunset and night).
4.1.2.1 Mean radiant Temperature
During the morning, mean Tmrt values are highest in BoonTat711 due to by high solar radiation. The lowest mean values occur in RobinsonRd (5.2°C lower than in BoonTat711) due to the difference in street orientation and SVF (lower in RobinsonRd). However, at 10:00, Tmrt difference rises up to 27°C.
These features during the morning are similar to the ones in the wet NE-Monsoon season. However, mean absolute Tmrt values in each site are higher in the wet season.
On the contrary, during the rest of the day (especially in the midday/afternoon period), Tmrt values are lower in the wet season. During midday/afternoon period mean Tmrt values can be ~10°C higher in dry NE-Monsoon season due to less cloudy skies and higher temperatures during this time of the year.
Similarly to previous analysed results, differences between measuring sites are conditioned by the urban morphology. During the afternoon, the mean Tmrt difference between BoonTat sites and RobinsonRd reaches 7.7°C.