DISSERTATION PRESENTED FOR THE DEGREE OF DOCTOR OF NATURAL SCIENCE (DR. RER. NAT.)
CO-TUTELLE BETWEEN THE UNIVERSITY OF MONTPELLIER AND THE UNIVERSITY OF REGENSBURG
Presented by Maximilian PLEINES 06/11/2018
Under the supervision of Prof. Thomas ZEMB and Prof. Werner KUNZ
Composition of the jury :
Werner KUNZ, Prof., University of Regensburg Epameinondas LEONTIDIS, Prof., University of Cyprus Jean-Marie AUBRY, Prof., University of Lille
Thomas ZEMB, Prof., University of Montpellier Dominik HORINEK, Prof., University of Regensburg Jean-François DUFRÊCHE, Prof., University of Montpellier Jean DUHAMET, Dr., CEA/DEN Marcoule
Referee/ Ph.D. Director Referee
Referee
Examination Committee/ Ph.D. Director Examination Committee
Jury President
Invited Member/ Supervisor
Viscosity-control and prediction of
microemulsions
This work was carried out in the framework of a Co-Tutelle between the partner-universities of Montpellier (France) and Regensburg (Germany) from November 2015 to November 2018. In France, the main work was performed in the lab « Laboratoire du Tri ionique par les Systèmes Moléculaires autoassemblés » (LTSM), part of the Institut de Chimie Séaparative de Marcoule (ICSM), and in the lab « HEC » of the building G1 situated at the French commissary for atomic energy (CEA) in Marcoule. In Germany, the work was carried out at the Institute of Physical and Theoretical Chemistry at the University of Regensburg. This thesis was supervised by my Ph.D. directors Prof. Thomas Zemb and Prof. Werner Kunz as well as my supervisor Jean Duhamet. Without the support and participation of the following people, this thesis would not have been possible.
The scheme on which this whole work was possible is an “amont-aval” thesis, the first of its kind to have been approved as a project, early 2014. This “thèse-phare” has been implemented by Yves Brechet, the 10
thHigh-Commissar after Joliot-Curie, in order to give special support to PhD work that treat jointly a deep scientific open question and an important technological lock. In my case, the technological challenge was to find the best compromise between selectivity and viscosity in liquid-liquid extraction.
Gilles Bordier as former head of the department devoted to nuclear recycling identified the core problem which is the necessary replacement of phosphate-based extractants. I thank him for giving this very exciting and motivating final goal of this thesis.
Moreover, I want to thank Prof. Thomas Zemb for giving me the opportunitiy to work at the ICSM, to guide and support me with patience during the whole time of my Ph.D. in every possible way as well as to give me a certain degree of freedom to promote my abilities to work independently.
I also express my gratitude to Prof. Werner Kunz for making this Co-Tutelle possible, to encourage me in his calm manner and for his advice and expertise.
Moreover, I would like to thank Jean Duhamet for his co-supervision, especially for his moral support and help with administrative issues.
I also deeply thank Wolfgang Fieber who showed great interest and trust in my work and with whom I had incredibly productive and pleasant working sessions and discussions on my model, especially on the aqueous case.
Furthermore, I would like to express special thanks to Hélène Martin, Elisabeth Roussigne and
I also want to thank the whole team of the LTSM, with whom I have spent a great time and who supported and helped me whenever needed. Special thanks go to Sandrine who has supported me in organizing the SANS experiments. I also express my gratitude to the rest of my colleagues from the ICSM, from University of Regensburg as well as from G1 who helped me in every technical, safety or administrative question. I also thank C. Sorel and M.C. Charbonnel for providing the monoamide extractants.
Many thanks go to all my friends that have made my stays in Marcoule/Avignon as well as in Regensburg to an unforgettable time and with whom I share many fantastic and funny memories. I thank by name Michael, Markus, Robert, Mario, Alla, Carlos, Ran, Damian, Tobias, Patrick, Max - but there are many others that I did not name here individually.
Außerdem möchte ich meinen Eltern, meiner Schwester und meinem Bruder danken. Ohne ihre Unterstützung jeglicher Art wäre mein Studium und meine Promotion nie möglich gewesen.
Des Weiteren danke ich meinem Bruder für die geduldige Hilfe und Einführung in JavaScript für die interaktive Umsetzung des Programms.
Zu guter Letzt danke ich von ganzem Herzen meiner unglaublichen Frau, Sabrina. Ich danke
ihr für ihre Geduld und ihr Verständnis, ihr durchweg positives Denken, ihr Vertrauen und ihre
Liebe - auch in schweren Zeiten - und für all das, was Worte nicht ausdrücken können. DANKE.
Viscosity is a fundamental property of complex fluids that is still difficult to predict quantitatively. This macroscopic property originates from molecular as well as mesoscopic properties. The understanding and prediction of the evolution of the viscosity with changing parameters is crucial for several applications, e.g. for liquid-liquid extraction processes or the formulation of aqueous surfactant systems.
In this work, a new “minimal” thermodynamic model taking into account the relevant free energies was developed that helps to understand, control and predict the evolution of the viscosity of microemulsions in presence of solutes. The term “minimal” means in that context that this model is based on a minimal set of parameters that are all measurable and have a physical meaning, thus minimizing the number of adjustable parameters. This model that considers the chemical terms at the molecular scale, the physical terms at the mesoscale as well as the flow characteristics at the macroscale was applied on water-poor extracting microemulsions as well as on aqueous anionic surfactant systems.
Liquid-liquid extraction is the central technology in metal recycling. The extraction is always driven by oil-soluble extracting surfactants. TBP (Tributyl phosphate) is one of those widely used extractants. This molecule allows selective extraction of actinides in the framework of the nuclear fuel cycle as well as lanthanides for the life-cycle of electronic devices. Emulsification and demulsification processes in extraction devices are only efficient when the difference in viscosity between organic and aqueous phase is small. Although the processes using TBP as selective extractant are known since World-War II, economic and technical reasons motivate the research for alternative extractants. One promising approach is the use of N,N-dialkylamides which also have good extraction properties and significant advantages over TBP. The main disadvantage of N,N-dialkylamides is the viscosity of the organic phase, which increases exponentially when processes are intensified by increasing heavy metal and extractant concentration.
By combining scattering and phase behavior analysis, we show that the viscosity increase with heavy metal concentration can be rationalized by the formation of a three-dimensional living network with different topologies. The mesoscopic structure consists of a one-dimensional ionic liquid of alternating metal-nitrate chains at well-defined distances embodied in a
“bottlebrush” microstructure. The main component of the network are W/O cylinders in
equilibrium with endcaps and junction units. The corresponding microphase distribution of
endcaps, cylinders and junctions could be calculated and reasonably correlated with the
approaches for extractant systems.
Giant wormlike micelles formed by anionic surfactants in aqueous solution exhibit interesting rheological properties with high impact on industrial applications, especially in home and personal care products. Their structural and consequently their viscoelastic properties change during salt addition. Usually, the addition of a few percent of salt leads to an increase of the zero-shear viscosity by several orders of magnitude up to a viscosity peak. Further salt addition leads to a decrease in viscosity which was explained by the presence of more and more branching points that serve as stress relaxation points allowing micellar chains to slide along the micellar contour. The position and intensity of the viscosity peak changes by addition of solutes or fragrances and varies also with the type of salt added. This work further shows that this general model developed can be adjusted for the aqueous case and allows to reproduce the viscosity curve of an anionic surfactant in the presence of salt with almost perfect agreement.
Furthermore, the influence of the type of salt as well as of added fragrances was predicted
successfully and understood.
La viscosité est une propriété fondamentale des fluides complexes et qui reste encore difficile à prédire quantitativement. Cette propriété macroscopique provient de propriétés moléculaires et mésoscopiques. La compréhension et l’estimation de l'évolution de la viscosité avec des paramètres variables est importante pour plusieurs applications, entre autres pour l’extraction liquide-liquide et pour la formulation de systèmes tensioactifs aqueux.
Dans ce travail, un nouveau modèle "minimal" prenant en compte les énergies libres mises en jeu a été développé pour aider à comprendre, contrôler et prédire l'évolution de la viscosité des microémulsions en présence de solutés. Le terme « minimal » signifie dans ce contexte que ce modèle est basé sur un ensemble minimal de paramètres qui sont tous mesurables ou ont une signification physique, ce qui permet d’éviter le recours à des paramètres ajustables. Ce modèle développé dans cette thèse considère les termes chimiques à l'échelle moléculaire, les termes physiques à l'échelle mésoscopique ainsi que les caractéristiques d'écoulement à l'échelle macroscopique et a été appliqué sur des microémulsions pauvres en eau utilisées pour l’extraction des métaux notamment pour le cycle de combustible nucléaire ainsi que sur des systèmes tensioactifs anioniques aqueux.
L'extraction liquide-liquide est la technologie centrale dans le recyclage des métaux.
L'extraction est toujours conduite par des molécules de tensioactifs solubles dans l'huile. Le TBP (phosphate de tributyle) est l'un de ces agents tensioactifs d'extraction largement utilisés (extractants). Cette molécule permet l'extraction sélective des actinides dans le cadre du cycle du combustible nucléaire ainsi que des lanthanides pour le cycle de vie des dispositifs électroniques. Les procédés d'émulsification et de demulsification dans les dispositifs contacteurs ne sont efficaces que lorsque la différence de viscosité entre la phase organique et la phase aqueuse est typiquement inferieure à cinq. Même si les procédés utilisant le TBP comme extractant sélectif sont connus depuis la Seconde Guerre mondiale, des raisons économiques et techniques motivent la recherche de systèmes moléculaires d'extraction alternatifs. Une approche prometteuse est l'utilisation de N,N-dialkylamides qui ont également de bonnes propriétés d'extraction et des avantages significatifs par rapport au TBP. Le principal inconvénient des N,N-dialkylamides est la viscosité de la phase organique qui augmente de façon exponentielle lorsque les processus sont intensifiés en augmentant la concentration de métaux lourds et d'extractants.
En combinant des méthodes de la diffusion et l'analyse de l’évolution de comportements de
phase, nous montrons que l'augmentation de la viscosité avec la concentration en métaux lourds
structure mésoscopique est constituée d'un liquide ionique unidimensionnel de chaînes alternées métal-nitrate à une distance bien définie incorporée dans une microstructure
"bottlebrush". Les composants principaux du réseau sont les cylindres E/H en équilibre avec des embouts et des points de connexion. La distribution des micro-phases correspondante des embouts, des cylindres et des jonctions pourrait être calculée et corrélée raisonablement avec la viscosité pour des systèmes donnés. De plus, le modèle a été utilisé pour proposer des approches générales de formulation pour les systèmes chimiques extractants.
Les micelles géantes formés par des tensioactifs anioniques en solution aqueuse présentent des
propriétés rhéologiques intéressantes avec un impact élevé sur les applications quotidiennes
importantes en cosmétiques et détergence. Leur structure et par conséquent leurs propriétés
viscoélastiques changent lors de l'ajout de sel. Habituellement, l'addition de quelques pourcents
de sel conduit à une augmentation de la viscosité de cisaillement zéro de plusieurs ordres de
grandeur jusqu'à un pic de viscosité. L'addition de sel supplémentaire conduit à une diminution
de la viscosité que nous avons expliquée par la présence de plus en plus de points de
ramification qui servent comme points de relaxation permettant aux chaînes micellaires de
glisser le long du contour micellaire. La position et l'intensité du pic de viscosité changent par
addition de solutés ou de parfums et varieent également avec le type de sel ajouté. On montre
que le modèle peut être ajusté pour le cas aqueux et permet de reproduire la courbe de viscosité
d'un tensioactif anionique en présence de sel avec un accord presque parfait. En outre,
l'influence du type de sel ainsi que des parfums ajoutés a été prédite avec succès et comprise.
I Introduction ... 9
I.1 Goal of this thesis and approach ... 10
I.2 State of the art ... 12
I.2.1 Liquid-liquid extraction in general ... 12
I.2.2 Extraction on industrial scale: Important factors ... 15
I.2.3 Viscosity – a simple explanation ... 20
I.2.4 Extractant solutions ... 27
I.2.5 Possible reasons for viscosity increase in the reverse space ... 40
I.2.6 The system dialkylamide – uranyl... 55
II Experimental Observations ... 66
II.1 Experimental methods and chemicals ... 67
II.1.1 Chemicals and materials ... 67
II.1.2 Preparation of the organic phase ... 67
II.1.3 Determination of uranyl content by potentiometric titration... 67
II.1.4 Rheological investigations ... 68
II.1.5 Small- and Wide-Angle X-ray Scattering ... 69
II.1.6 Small-Angle Neutron Scattering ... 69
II.1.7 Methods to estimate the spontaneous packing parameter ... 71
II.2 Experimental observations leading to a mesoscopic model ... 79
II.2.1 Influence of extractant and uranyl concentration ... 79
II.2.2 Influence of temperature ... 83
II.2.3 Influence of shearing and rheological investigations ... 88
II.2.4 Influence of diluent ... 90
II.2.5 Small- and Wide-Angle X-Ray Scattering analysis ... 93
II.2.6 Small-Angle Neutron Scattering analysis ... 106
phase 114
III Development of a Minimal Model ... 117
III.1 Main idea and underlying theory... 118
III.1.1 Main principle ... 118
III.1.2 Microphase distribution ... 119
III.1.3 Modification for the presence of a second extractant ... 122
III.1.4 Towards an intuition-driving image of the organic phase in 2D – Monte-Carlo- like simulation ... 122
III.1.5 Microphase equilibrium controlling the viscosity ... 127
III.2 Implementation in a user-friendly interface ... 131
III.3 General results of the model ... 136
III.3.1 Presentation of Accordion I: ‘General model – for understanding’ ... 136
III.3.2 Variation of the packing parameter ... 139
III.3.3 Addition of a second extractant ... 143
III.3.4 Metal response ... 146
III.3.5 Bending constant ... 149
III.3.6 Concentration dependence and Onsager transition ... 151
III.4 Application of the model on the specific system ... 154
III.4.1 Presentation of Accordion II ... 154
III.4.2 Estimation of the packing parameter and fitting of the experimental values . 156 III.4.3 Diluent dependence and solvent penetration ... 158
III.5 Conclusion and remarks ... 160
III.5.1 Summary of the model and critical remarks ... 160
III.5.2 Compatibility with a COSMO approach ... 162
III.5.3 Conclusion and propositions for the solution of the viscosity problem ... 164
IV.1 Changing the extractant geometry ... 168
IV.2 Changing the diluent by additives ... 172
IV.3 Mixing two extractants ... 177
IV.4 Conclusion ... 179
V Application of the Model to Aqueous Systems ... 180
V.1 Introduction ... 181
V.2 The “salt curve” in presence of model solutes and fragrances ... 183
V.3 Adapting the model for the aqueous case ... 188
V.3.1 General theory for the calculation of the microphase distribution and viscosity ... 188
V.3.2 Evolution of the spontaneous packing parameter ... 193
V.3.3 Co-solvent effect of fragrance molecules ... 195
V.3.4 Interface softening effect ... 196
V.4 Results of the model ... 198
V.4.1 10% SLES pure in water ... 198
V.4.2 Influence of added electrolytes on the viscosity curve ... 202
V.5 Conclusion ... 209
VI General Conclusion and Outlook ... 212
VI.1 Summary and general conclusion ... 213
VI.2 Strategies for refinement ... 217
VI.3 Further applications ... 221
VI.3.1 Prediction of the cloud point ... 221
VI.3.2 Parallelism to the HLD-NAC concept ... 225
VII Annex ... 230
VII.1 List of abbreviations ... 231
Figures - short titles ... 232
Tables ... 245
VII.3 Experimental methods – chemicals and underlying theory ... 247
VII.3.1 List of chemicals used in this work ... 247
VII.3.2 X-Ray and Neutron Scattering ... 248
VII.3.3 Rheology ... 250
VII.3.4 Potentiometric titration ... 251
VII.4 Short introduction to COSMO-RS ... 253
VII.5 Phase diagram of surfactant structures according to Cates ... 255
VII.6 Supplementary information to Chapter II.2 ... 256
VII.6.1 Additional viscosity curves with variation of extractant concentration ... 256
VII.6.2 Assumptions and input values for the geometrical calculation of the spontaneous packing parameter ... 261
VII.6.3 Tables of viscosity data and distribution coefficients ... 262
VII.6.4 Additional SWAXS spectra and presentation in log-log and lin-lin ... 269
VII.6.5 Additional SANS spectra and fit results ... 272
VII.7 Supplementary information to Chapter III ... 275
VII.7.1 Hexagon definition and estimation of aggregation number per microphase . 275 VII.7.2 JavaScript code ... 278
VII.7.3 Interfacial tension measurements of different extractants ... 278
VII.8 Supplementary information to Chapter V ... 280
VII.8.1 Table with necessary input parameters ... 280
VII.8.2 Details on the estimation of packing parameter, aggregation number and volume per microphase on a hexagonal grid ... 280
VII.9 References ... 284
I INTRODUCTION
I.1 Goal of this thesis and approach
Liquid-liquid extraction is the central technology in metal recycling. An important application is the recovery of major actinides – Uranium and Plutonium – in the framework of minimization of highly radioactive waste by using Mixed Oxide Fuel (MOX) and the required closing of the nuclear fuel cycle by use of fast neutrons in the future. Although the processes using Tributyl phosphate (TBP) as selective extractant are known since world-war II, economic and technical reasons motivate the research for alternative extractants. One promising approach that is under development since several years is the use of N,N-dialkylamides which also have a high affinity towards Uranium and Plutonium and significant advantages over TBP. The main disadvantage of N,N-dialkylamides is the viscosity of the organic phase which increases exponentially when processes are intensified by increasing uranyl and extractant concentration. Emulsification and demulsification in extraction devices are only efficient when the difference in viscosity between organic and aqueous phase is small.
Until now, the approaches to solve the problem and optimize formulations are based on experimental investigations along “experimental design”
[1]in order to find a compromise between selectivity and hydrodynamic properties such as viscosity and interfacial tension. To our knowledge, there is no published predictive model that explains the viscosity increase. The present work tries to understand the viscosity increase in three consecutive steps.
In the first step, the problem of the viscosity increase in presence of metal ions is analyzed by detailed investigation (cf. Chapter II). The influence of different parameters on the viscosity is investigated and scattering experiments are carried out in parallel. The experimental results lead to the identification of the type of microstructure in the organic phase which helps to understand the origin of the viscosity increase.
In a second step (cf. Chapter III), this picture is used to develop a “minimal” model at nanoscale.
The term “minimal” means in this context that the model can be used with a minimum of necessary input parameters that are either measurable or have at least a precise definition and physical meaning. This model considers the chemical terms at molecular scale, the physical terms at mesoscale as well as the flow characteristics at macroscale. This concept allows to calculate the number distribution of the microphases, to obtain a qualitative picture of the microstructure by a Monte-Carlo-like simulation and to predict the viscosity evolution.
In the third step (cf. Chapter IV), the model is used to propose approaches to solve the problem
of viscosity increase. Having identified the viscosity-determining parameters, knowledge-based
formulations are proposed and tested. The development of this simple mesoscopic model allows to make formulation in the field of extractant systems more predictable and helps to avoid strict trial-and-error formulation.
Moreover, this general theory is also applied and adjusted on an aqueous system (cf. Chapter V).
The bell-shaped viscosity curve of an anionic surfactant in water in presence of salt can be reproduced by this theory. The influence of some hydrophobic model solutes as well as the type of salt on the position and intensity of the viscosity maximum can be predicted successfully.
In parallel, the underlying equations for both the aqueous and the organic case were implemented in a user-friendly interface. It is a useful tool to understand the new thermodynamic model and resulting tendencies. Therefore, it is recommended to every reader, to use the program and “play” with the sliders. The program can be assessed by the following link:
www.vyrix.de/sim
In the following, the background to this topic as well as the theoretical basics are described.
I.2 State of the art
I.2.1 Liquid-liquid extraction in general
I.2.1.1 Metal recovery and recycling
Metals are omnipresent and essential for everyday life.
[2]They are crucial for all kinds of electronic devices such as smartphones, but also for cars or the construction industry. Moreover, they are essential to produce electric energy by for example windmills or by nuclear power plants. According to their economic importance and their supply risk, the metals can be classified as “critical metals” or “strategic metals”. A metal is considered as “critical” by the European Union, when it follows the three following criteria
[3–6]:
It has a significant economic importance for key sectors.
The EU is faced with high supply risks.
There is a current lack of substitutes for that metal.
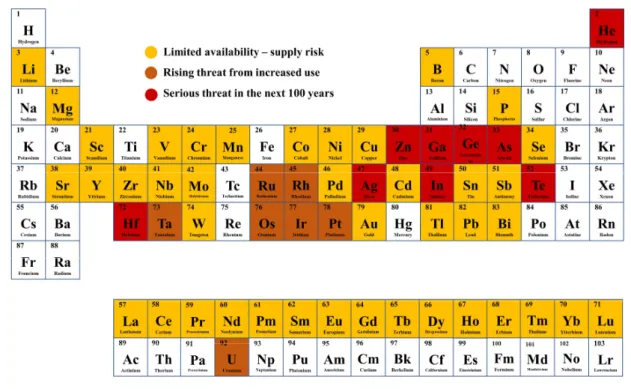
In 2017, the EU has classified 27 raw materials as critical. For most of them, China is the main global producer. A list of potentially endangered elements can be found in Figure 1.
[7]Figure 1: Endangered elements according to a research conducted by the Chemical Innovation Knowledge Transfer Network. Adjusted and replotted from [7].
The increased use of certain metals, the limited availability, the enormous prices of certain
metals, particularly rare earth elements - due to their control by China - and environmental
aspects are only some of the reasons why metal recycling should be intensified and promoted.
I.2.1.2 Liquid-liquid extraction
The central technology for metal recycling, but also for the recovery of metals by ore processing is liquid-liquid extraction (LLE). LLE, also known as solvent extraction, is a method to separate compounds based on their relative solubility in two different immiscible liquids.
[8]In the case of recovery of metals, the distribution of the solute takes place between a polar aqueous phase and an apolar organic phase. In order to quantify this distribution, the distribution coefficient D
Mis defined:
𝐷 = [𝑀]
[𝑀] ( 1 )
where [M]
organd [M]
aqrepresent the concentrations of the metal species M in the organic or respectively in the aqueous phase. When coexisting ions have different distribution coefficients, separation can be obtained. The understanding of the relying molecular driving forces
[9]in known regimes of the phase diagram of water-poor microemulsions
[10]is the basis for effective separation. For detailed information, the review about “ienaics
1” is recommended.
[11]The final goal of a LLE process is to transfer ions that are aimed to extract selectively from phase A into phase B, while undesired ions stay in phase A. The term “hydrometallurgy”
describes the recovery of metals from ores, concentrates and recycled or residual materials. Its main steps are dissolution, concentration and recovery. In the framework of hydrometallurgy, phase A represents in most cases an acidic aqueous phase loaded with desired and undesired ions. This phase is also called “feed solution” and results from treatment of either ores and minerals or - in the case of recycling – valuable waste, e.g. electronic and metallic scrap or spent nuclear fuel rods with acid. This wet-chemical process is called “leaching”. In a second step, the desired ions are extracted into the organic phase. In a last step, the metals are back- extracted from the organic phase – the “extract” - into a fresh aqueous phase.
[12]This process is also called “stripping”. The organic solvent is recuperated and can be reused for another extraction cycle. These steps are schematically represented in Figure 2.
1
By similarity with electronics, “ienaics” (Greek: the object that is moving). ienaics is the science of controlled
transfer of hydrated ions and other charged colloidal aggregates between coexisting complex fluids and denotes
therefore the basis of separation processes of electrolytes
[11].
Figure 2. Schematic representation of a hydrometallurgical process starting from “leaching” over “solvent extraction” to “stripping”.
In order to make such a process efficient, the distribution coefficient D should be high, e.g. in the ideal case, the majority of the desired ions should “dissolve” in the apolar organic phase.
According to the old alchemic wisdom “Similia similibus solvuntur” – “Like dissolves like” this
seems to be counter-intuitive at first sight. Ions will prefer the polar aqueous phase which is
true for most of the cases when the organic phase only consists of a simple diluent. This can be
for example a linear or branched alkane. Therefore, liquid-liquid extraction of metals requires
the use of so-called extractants. These molecules consist of a polar complexing group and
hydrophobic chains. The most effective extractants have branched chains. This has only been
understood recently in terms of entropy.
[13]Moreover, the often used di-ethylhexyl chains
possess a high stability against radiolysis.
[14]Additionally, the chemical precursor for its
production – 2-ethylhexanol – is cheap due to an annual production of 2 million tons per year
from propylene.
[15]The amphiphilic character of extractants allows them to form complexes or
aggregates with the desired ions. The resulting polar cavity surrounded by extractant chains
permits the solubilization of the ions to be extracted. Knowledge-based choice of extractant
type and conditions results in selectivity with respect to undesired ions. Since in pure form, the
viscosity is quite high (~ 50 mPa·s), the extractants are dissolved in a diluent that is immiscible
with water. In most cases, an alkane or an aromatic compound is chosen for that purpose. The
formation of complexes and aggregates will be discussed more in detail in Chapter I.2.4, after
the extraction on industrial scale is introduced as well as the central topic of this thesis – the
viscosity (cf. Chapter I.2.3).
I.2.2 Extraction on industrial scale: Important factors
Solvent extraction is not always carried out in separatory funnels as indicated in Figure 2. On industrial scale, special extraction devices are used to contact the immiscible phases. In the following, three important devices introduced and briefly discussed.
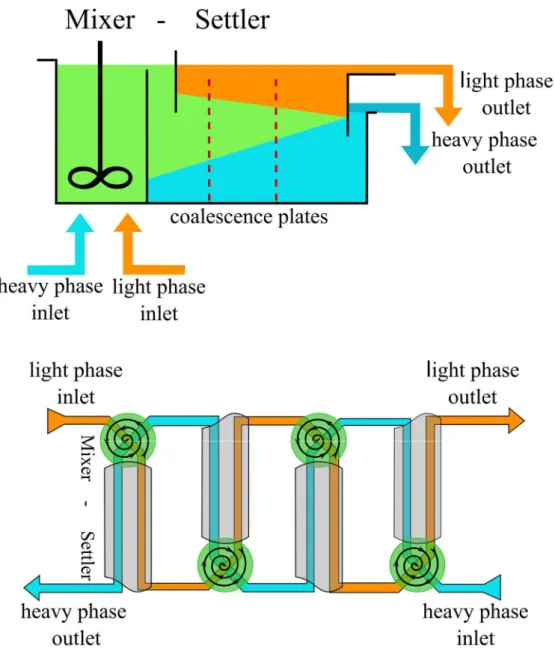
I.2.2.1 Mixer-Settler
[ 8 , 1 2 , 1 6 , 1 7 ]The mixer-settler consists of two stages. In the first, smaller, chamber the two phases are mixed by an impeller to increase the contact surface between the phases and thereby to facilitate the mass transfer. In the second, larger chamber, the two phases are separated by gravity due to their density differences. The transportation of the liquids from one stage to the next occurs either by gravity or using pumps. The so-called “settling” of the phases is supported by coalescence plates. Each mixer-settler unit provides a single stage of extraction. The different stages can be coupled in a countercurrent process, so that multiple mixer-settlers are installed with mixing and settling chambers in alternating arrangement (so that the settled heavy phase outlet feeds the inlet of the adjacent stage mixing chamber). In that way, all extraction, washing and stripping steps necessary can be carried out by mixer-settlers (cf. Figure 3).
I.2.2.2 Centrifugal Extractors
[ 8 , 1 2 , 1 6 – 18 ]Centrifugal contactors are like mixer-settlers discrete-stage units and provide one extraction
stage. They can be also coupled for multi-stage extractions. Centrifugal extractors are equipped
with a spinning rotor that a) mixes the two phases intensely and b) induces a separation of the
two phases inside the rotor. The centrifugal forces can be up to 300 G, leading to a fast and
efficient phase separation. Due to the low residence time (the liquid molecules usually remain
not longer than about 2 min in a multistage industrial centrifugal extractor
[8, pp.398–399]), solvent
degradation can be minimized. The separated phases exit the contactor via overflow and
underflow weirs, similar to a mixer-settler (cf. Figure 4).
Figure 3. Top:Schematic representation of a mixer-settler. Bottom: Mixer-settler in a countercurrent arrangement
Figure 4. Schematic representation of a centrifugal extractor
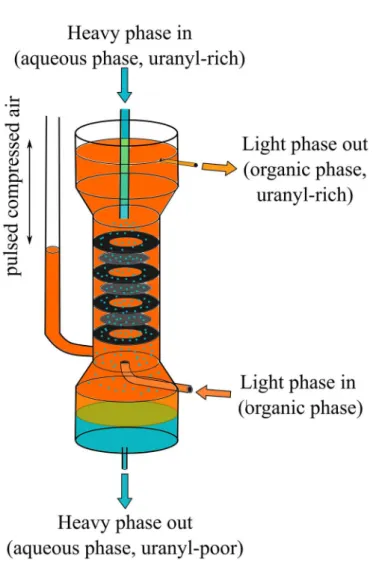
I.2.2.3 Pulsed Column
[ 8 , 1 2 , 1 6 , 1 7 ]Unlike mixer-settlers and centrifugal extractors, pulsed columns are contactors without individual extraction stages. The liquids are continuously fed to the column and flow in countercurrent, the lighter organic phase from bottom to top, the aqueous phase in the opposite direction. Mechanical energy is applied to pulse the liquids in the column up and down. The column is filled with perforated plates or other plates to promote droplet formation as the dispersed phase is pushed through the plates (cf. Figure 5). Due to the pulsing (often done by pressured air) droplet size of the dispersed phase is reduced, the interfacial area increased and mass transfer enhanced. The process can be carried out in aqueous continuous mode or organic continuous mode, e.g. either the organic or the aqueous phase can be dispersed. Pulsed columns are in use for the extraction of uranium and plutonium (PUREX process, cf. Chapter I.2.6.2) in la Hague, a nuclear fuel reprocessing plant in France.
Figure 5. Schematic representation of a pulsed column. A typical extraction of uranyl by a pulsed column is shown.
The organic phase is loaded with uranyl during the extraction.
I.2.2.4 Important factors
The choice of the right extracting system and the extraction device is crucial for the efficiency of the extraction process. The selection of the right solvent is the key for a successful separation.
There is a set of important factors and parameters that have to be considered. A selection is mentioned in the following and roughly discussed:
[8,12] Selectivity towards certain ions: High distribution or respectively selectivity coefficients allow to minimize the number of steps needed for a certain purity or separation.
Capacity: A high value of the solvent capacity for solutes permits to decrease the feed- to-solvent ratio. The capacity is often indicated by a high distribution ratio D
M.
Recoverability: The solvent should be easy to recover, ideally by simple flash or a stripping column.
Economic aspects: The solvents, e.g. the extractant and diluent should be readily available and the costs per year should be low. Furthermore, the chemical, thermal and radiolytic stability of the solvent as well as the corrosion properties can be also counted to economic aspects.
Security and environmental factors: Toxicity and flammability as well as environmental impact has to be considered.
Density difference: The difference in density between the heavy (aqueous) phase and the lighter (organic) phase should be high enough to enable fast settling.
Interfacial tension: High interfacial tension enables a rapid settling due to easier coalescence. On the other hand, low interfacial tension facilitates phase dispersion increasing the interfacial areas and separation efficiency. If the interfacial tension is too low, stable emulsions can be produced. Therefore, a compromise has to be found. In most cases a higher interfacial tension is preferred.
Viscosity and viscosity ratio: The viscosity η is an important factor. It is related to the molecular diffusion coefficient D via the Stokes-Einstein relation
[19]:
𝐷 = 𝑘 𝑇
6π𝜂𝑅 ( 2 )
with k
Bbeing the Boltzmann constant, T the temperature and R the radius of the moving
particle. Therefore, high viscosities reduce the mass transfer efficiency and can lead to
difficulties in pumping and dispersion.
[20,21]The deformation time τ
defis given by the
ratio of solvent viscosity to the external stress σ
extacting on the drop.
𝜏 = 𝜂
𝜎 ( 3 )
As a consequence, droplets with higher viscosities are more difficult to disperse. That means, a higher external stress such as a higher shear rate has to be applied to deform and break a drop.
[22]Accordingly, viscosity is related to emulsion stability and phase separation time.
[20]More important than the viscosity itself is the viscosity ratio between the dispersed (η
D) and the continuous phase (η
C). In dilute systems, the viscosity ratio η
D/η
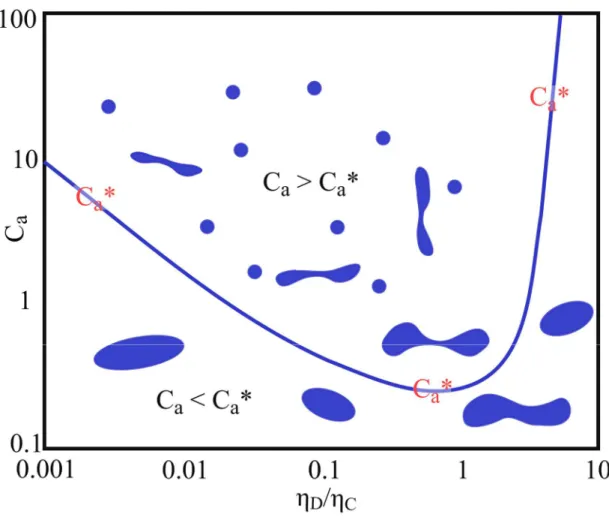
Cis often close to 1. Figure 6 shows, what happens if this viscosity ratio significantly deviates from 1.
On the y-axis, the capillary number C
ais plotted as a function of the viscosity ratio of the dispersed phase η
Dand the continuous phase η
C. This number (C
a) is an important, dimensionless quantity for fluid mechanics. It represents the “ratio between viscous to capillary forces”
[20, p.71 ,23, pp.712–713]and is defined as follows:
𝐶 = 𝜂 𝛾̇𝑟
𝜎 ( 4 )
with σ
Ibeing the interfacial tension and 𝛾̇ the applied shear rate. The value of the initial
droplet radius r
0can change with increasing shear rate. The droplet deformation depends
on the viscosity ratio.
[22]The effect of droplet break-up is given by a certain critical
capillary number C
a*. If the capillary number for a certain viscosity ratio is below C
a*,
the applied energy does not break the droplets. Instead, the shear force is used to spin
the droplet.
[23]That means, that the shear, or respectively, the droplet deformation is not
fast enough to break the droplet compared to the drop ability to spin within the
medium.
[24]Looking at Figure 6, one can learn, that it is easy to create an emulsion, if
the viscosity ratio is close to 1. If the ratio strongly deviates from that value, it becomes
more difficult. The same can be concluded for the phase separation. If the viscosity ratio
strongly differs from 1, stable emulsions are formed. This is particularly true if the
continuous phase is the more viscous one. In that case, coalescence is slowed down
because the separating film of liquid between the drops cannot be drained quickly. As a
rule of thumb for efficient mixing and demixing, the viscosity ratio between the two
contacted phases should not exceed a ratio of 1:5.
[22,24, pp.110–120]Figure 6. Schematic evolution of the critical capillary number as a function of the viscosity ratio. Figure replotted and adjusted from [24, pp.110–120].
The focus of this work is placed on the viscosity which is introduced in the next chapter and explained in a simple illustrative way.
I.2.3 Viscosity – a simple explanation
Viscosity is a fundamental and characteristic property of liquids – for pure ones as well as for mixtures and dispersions. Each liquid has a certain internal resistance against flow or shear.
The viscosity is a measure of this resistance.
[25]It is a macroscopic property, but it originates from molecular and mesoscopic properties.
[26]I.2.3.1 Two-Plate Model (Newton)
The dynamic viscosity is the tangential force per area that is required to slide a certain layer
against another layer (cf. Figure 7).
Figure 7: Schematic representation of simple shear of a liquid film
Image two parallel plates of fluid with equal area A. One plate is fixed, the other is forced to move with a constant velocity v. The force needed to move the plate is called shear force F and is dependent on the velocity v
x, the area of the plates A and inversely proportional to the distance dy between the plates.
𝐹 = 𝜂 ∙ d𝑣
d𝑦 ∙ 𝐴 = 𝜂 ∙ 𝛾̇ ∙ 𝐴 = 𝜎 ∙ 𝐴 ( 5 ) The proportionality factor η is therefore a measure of how resistive the fluid is to flow and is called “viscosity”. This simple proportionality is only valid for so-called “Newtonian fluids”
like for example water. For so-called “viscoelastic fluids”, the behavior can strongly deviate from this relation, dependent on the applied velocity gradient . This velocity gradient is a measure of the speed at which the intermediate layers are moving with respect to each other.
This gradient is also called “shear rate” 𝛾̇ and is given in the unit [s
-1]. The stress that has to be applied parallel to the surface of the liquid to cause that shear is called shear stress σ and is given in the unit of a pressure [Pa = N/m²].
I.2.3.2 A simple metaphore for viscosity
Another definition that can be found is that the viscosity is a measure for momentum transfer
within a liquid.
[27]In gases, this momentum transfer is mainly dominated by translation of the
molecules with only relatively few collisions and can be described by the kinetic theories of
gases. In the case of liquids, the momentum transfer is mainly dominated by collisions and interacting force fields.
[28,29]Consequently, it is a way to describe the effect of the movement of one constituent (depending on the type of the liquid – molecule, colloid or polymer) on the constituents that are adjacent. If the movement of one constituent A causes a strong movement of the neighboring constituents, the viscosity is high. The sliding of one layer is strongly coupled to the sliding of other layers and the momentum transfer is high. In contrast hereto, the viscosity is low if the neighboring constituents are hardly affected by the movement of the constituent A.
There are two general factors that cause viscosity. The first and obvious ones are intermolecular attractive forces between ‘constituents’ of the liquid. The stronger they are, the more difficult the layers can slip and the higher is the viscosity. However, there is a second, not negligible factor – intermolecular repulsive forces and excluded volume interactions. These effects become particularly important at higher concentrations. They are based on the idea that when one constituent of the liquid has to move from one position to another, other parts of the liquid have to get out of the way first and momenta are exchanged.
[30]A very illustrative example drawn from life helps to understand the origin of viscosity that is crucial for this work. Imagine a person P being at a concert.
[30]This person has to go from Position A (e.g. next to the stage) to Position B (e.g. to the beer bar). In the following, different scenarios will be described to make the main origin of the viscosity clear. The scenarios are illustrated by Figure 8. In this figure, the spheres can represent either molecules, colloids, monomer units of polymers or – as in the example of a person at the concert – humans. The expression “spheres” used in the following will also indicate these different viscosity- determining constituents of a liquid.
(1) The concert is not well attended. In order to get from Point A to B, the person P does not have to overcome strong resistance – P will have the beer after a short time.
Transferring this case in the language of physical chemistry, the concentration of spheres is low and only a few spheres have to move and will undergo momentum transfer. The viscosity is expected to be low.
(2) The concert is well-attended. The person P will have to make many people move in
order to fetch the beer. Furthermore, P is popular and has to chat with a lot of people on
his way to position B. As a consequence, he has arrived at the beer bar after quite a long
time. In the analogy of physical chemistry, the concentration of spheres is high. A high
number of spheres will have to be moved to let the blue sphere pass. In addition, the blue sphere experiences intermolecular attractive forces. The viscosity is expected to be higher than in case (1).
(3) The concert is well-attended, but boring. A lot of people are chatting with each other, building small groups of 2-3 persons. In addition, the person P decides to fetch his beer together with his girlfriend. Again, a lot of people have to be moved to arrive at point B. This is more complicated, since the small groups of chatting people do not want to split. P and his girlfriend will have to overcome a strong resistance or walk longer ways.
Transferring this picture to chemistry, some spheres are linked to each other by intramolecular attractive forces or have a rod-like shape. A lot of spheres will have to move and turn around in order to let the blue spheres pass. The viscosity will be higher than in case (2).
(4) The concert is well-attended and the band has distributed handcuffs to let the people handcuff themselves to big queues in order to start a ‘conga line’. Person P is also trapped in such a queue, but wants to fetch the beer anyway. To make its way, a huge number of people has to move, even when they are far away from P. The queues have to wiggle around each other. Person P notices that sometimes two or three persons are an experienced team that can move fast out of the way. However, it takes a long time, until a whole queue is passed and even more time until person P has reached position B. In the analogy of physical chemistry, the spheres are connected to long chains. They cannot easily slip by each other, they have to disentangle and wiggle like snakes. There are small segments of a certain length that stay stiff during movement. This length is called the persistence length (cf. Chapter I.2.5.1). Due to the number of entanglements and the high number of momentum transfers that is needed to move through the solution, the viscosity is much higher than in case (3).
(5) After the concert, people are chatting with each other, shake hands and change phone
numbers. Some of them are still handcuffed together. The result is some kind of network
of interconnected people, however the connections between them are not that strong as
it was when they were handcuffed together. Person P wants to bring back his empty
beer mug. In order to do so, person P has to interrupt the conversations between the
queues of people that are still handcuffed together or at least to convince the people that
are drunk - and really do not want to stop chatting - to talk with another person. Since
the bonding between the groups of people is not that strong, it is easier for person P to get to the beer bar. Transferring this analogy to physical chemistry, the spheres form a network of interconnected and branched chains. Some connections are strong, some others can be broken or at least shifted towards different positions. In total, the viscosity of such systems is smaller, since the segments and interactions that have to be overcome are overall smaller than in a non-connected system.
The viscosity of the systems can be changed by applying energy on the system. One way to do this is to apply a shear force.
Using the example of above, applying no shear force would be to wait patiently on the other people to move, so that you can pass by. Applying a medium shear force would correspond to asking the people kindly. Pushing other people out of the way and forcing them to move aside would consequently correlate with applying a high shear force. The result, if P faster arrives at the beer bar (if the viscosity decreases with shear force), depends on the crowd. There is the possibility that everybody stops talking immediately, and the queues form some kind of guard of honor for person P. In this case, P arrives much faster at position B. In words of physical chemistry, the chains align during shear flow leading to a shear-thinning behavior. The viscosity decreases with increasing shear force. A typical example of such a fluid is paint. The shear applied by brush or roller makes the paint thin and low-viscous, permitting to wet out the surface evenly. Once coated, the paint regains its higher viscosity and dries without dipping and running.
However, there is the possibility that some people are upset of the action of person P. They form some kind of barriers in order to block the way to the beer bar. That will slow down the way to position B for person P. In the analogy of physical chemistry, the spheres tend to agglomerate with increased shear flow. That leads to an increase in viscosity. This behavior is called shear-thickening. An example for this case is a solution of starch. At gentle shearing, a starch solution is fluid. As the shear rate is increased, the liquid becomes very viscous and thick.
The exact mechanism of this phenomena is still under debate, but the majority attributes the increase in viscosity to a shear-induced formation of hydrodynamic clusters.
[31]It has to be mentioned that the use of starch for the thickening of sauces in kitchen undergoes a different mechanism. In that case, heating induces a transition from a dilute dispersion of individual
‘random coils’ to a network of entangled hydrocolloids.
[32,33]And finally, there is also the possibility that pushing and shouting does not have any effect for
person P. The reason could be that it actually would not be necessary to push (case (1)), since the way to position B is easily accessible. Another possibility would be that the people are so immersed in a discussion, that pushing the people only leads to an interchange of discussing people, but does not change the accessibility of the way to position A. In the language of physical chemistry, this behavior is called Newtonian behavior. This can be explained by the fact that the spheres are too dilute, so that the way to position B is more or less free. Another possibility is that the spheres are strongly connected and shearing leads to a sliding of the connection points, but not to a reduction of connectivity. Therefore, such systems can also be shear-independent, since there are always segments perpendicular and some aligned to the shear flow.
[34]Another way to apply energy to the system is to increase the temperature or in analogy to the illustrative example, to heat up the mood of the audience. As a result, the people will start dancing, move faster and the number and deepth of conversations decreases. Consequently, it is easier for person P, to find gaps where he can slip in and he will arrive faster at the beer bar.
In scientific language, increasing the temperature increases the kinetic energy of the spheres
and accelerates the movement. Furthermore, intermolecular interactions are weakened. As a
result, the coupling of the movement is decreased as well as the viscosity. Therefore, the
viscosity of most of the systems decreases with increasing temperature.
Figure 8. Simple picture of the origin of viscosity
I.2.4 Extractant solutions
I.2.4.1 Amphiphilic aggregation of extractants and surfactants After the introduction of viscosity, we can come back to extraction. As indicated in Chapter I.2.1, for the extraction of metals, so-called extractants have to be added to the organic phase to induce selectivity and increase the solubility of ions in the apolar medium.
Since the pioneering work of Osseo-Asare
[35], it is well established that extractant solutions are complex fluids rather than molecular solutions. Extractants are amphiphilic. They consist of a polar chelating group and an apolar part of alkyl chains used to increase their solubility in an organic diluent. This property allows them to form reverse micelles and aggregates.
Since these reverse aggregates with a polar core represent a coexistence of “two immiscible fluids separated by a well-defined interface
[36]” built from an amphiphile two-dimensional fluid and since such solutions are clear, thermodynamically stable and macroscopically isotropic, they can be classified as water-in-oil microemulsions.
[36–38]. Since in most cases, the polar core of these aggregates is relatively small (< 1 nm), the term “water-poor microemulsion” is a commonly used term for such systems.
[36]Due to the amphiphilic molecular structure of extractants, interfacial activity can be observed at a macroscopic interface, indicated by a decrease in interfacial tension, as the extractant concentration in the organic phase increases.
[39]A typical curve is shown in a qualitative way in Figure 9. Important differences compared to surfactant systems have to be noted.
Surfactant molecules adsorb preferably at the interface where they find the energetically most
favorable conditions due to their amphiphilic structure. At low surfactant concentration the
surfactant molecules arrange at the interface and the interfacial tension of the solution starts to
decrease rapidly since more and more surfactant molecules adsorb at the interface. Further
surfactant addition leads to a saturation of the interface and micelles are formed to avoid the
contact of water molecules and the hydrophobic chains. This concentration point is called
critical micelle concentration (cmc). After that concentration, the interfacial tension stays
almost constant, since addition of new surfactant molecules leads only to the formation of new
micelles, but does not change the interfacial properties. In terms of chemical potential, one
could explain this phenomenon as follows. With c
sbeing the concentration of unimeric
surfactants in water and c
totthe total concentration of surfactant, the chemical potential of a
surfactant molecule is given by equation ( 6 ) or ( 9 ), respectively.
Below the cmc, one can assume that c
tot≈ c
s.
𝜇 = 𝜇 + 𝑅𝑇ln𝑐 ≈ 𝜇 + 𝑅𝑇ln𝑐 ( 6 )
Above the cmc, the total concentration of surfactants is approximately the concentration of micelles multiplied with the average number of molecules per micelle N
agg. This term can be also expressed in terms of the equilibrium constant of micellation K
eqand the monomer concentration c
s(cf. equation ( 7 )). Rearranging this equation leads to an expression for the chemical potential μ
S.
above cmc: 𝑐 ≈ 𝑁 ∙ 𝑐 ≈ 𝑁 ∙ 𝐾 ∙ (𝑐 ) ( 7 )
𝑐 = 𝑐
𝑁 ∙ 𝐾 ( 8 )
𝜇 = 𝜇 + 𝑅𝑇ln𝑐 = 𝜇 + 𝑅𝑇
𝑁 ln𝑐 − 𝑅𝑇
𝑁 ln(𝑁 𝐾 ) ( 9 )
For surfactant systems, the aggregation numbers are large (usually 40-100). Therefore, the concentration dependent term ln𝑐 is negligible above the cmc and the interfacial tension stays almost constant.
In the case of extractant systems the situation is different. First, the break in the γ-log[extractant]
curve at the oil/water interface is shifted to higher concentrations compared to surfactant systems. It shows that extractants exhibit higher solvophilicity than surfactants. The concentration of this break is called the critical aggregation concentration (cac) and can be related with the formation of aggregates in the solution.
Second, the break in the curve is much less pronounced in the case of extractants, e.g. the slope
before and after the break differs less than in the case of surfactants. Furthermore, in most cases,
surfactant molecules are more efficient in reducing the interfacial tension of the water-oil
interface leading to a lower value at higher amphiphile concentration. Moreover, while the
interfacial tension of surfactant molecules stays almost constant above the cmc, the slope stays
negative and concentration dependent in the case of extractants. Equation ( 9 ) gives a first
explanation of this phenomenon. In the case of extractants, the aggregation numbers are much
smaller (typically 4-10) than in the case of surfactants. This makes the term ln𝑐 more
significant. Furthermore, it has to be noted, that most extractants belong to the class of “poor”
surfactants
[40]that aggregate in a progressive stepwise process as was demonstrated by Eicke et al.
[41]Therefore, aggregation starts already below the cac and before the saturation of the interface, making a further decrease of the interfacial tension above the cac possible.
Figure 9. Qualitative evolution of the interfacial tension of a macroscopic water-oil interface in presence of an amphiphilic molecule and the corresponding mesostructural evolution. Red: Evolution in presence of an extractant diluted in an organic diluent. Blue: Evolution of a surfactant diluted in water. Remarks: The absolute values of the interfacial tension as well as the cmc and cac values are strongly dependent on the system and can vary significantly. Rough values are taken from [39,42] and [43]. The aggregation behavior is schematically drawn for left: surfactants and right: extractants.
It has to be noted, that the underlying driving force for the aggregate formation is completely different for surfactants and extractants.
For surfactants in water, the so-called “hydrophobic effect”
[44]leads to aggregate formation.
Water molecules have a unique capacity for forming hydrogen bonds additionally to ordinary
dipole-dipole interactions. Since each oxygen atom can contribute to two hydrogen bonds,
every water molecule can form up to four hydrogen bonds with its neighbors.
[45]As a result,
liquid water can be seen as a loose dynamic network of hydrogen bonds. Due to the high number
of different configurations the hydrogen network can be arranged, the network is stabilized by
entropy. A number of unique properties like the high surface tension or the elevated boiling
point results from this stabilization. When hydrophobic compounds, that are not able to
participate in that network, are added to water, the loose network structure is disrupted, since
water molecules next to the hydrophobic compound cannot freely participate in the network.
This results in an entropy decrease. Therefore, for surfactants, the hydrophobic effect leads to a self-organization of the molecules with the goal to screen the oily chain as much as possible from water. In the case of a hydrophobic compound not having amphiphilic properties, the hydrophobic effect leads to phase separation, like in the case of water and a simple oil.
In contrast hereto, extractant molecules are dissolved in an organic diluent. A hydrophobic effect or a reverse equivalent effect does not take place. Furthermore, aggregation is entropically unfavored.
[46]Hence, an enthalpic effect must be the driving force. In non-aqueous solution, the aggregation depends on both the solvent and the structure of the amphiphile.
Entropy and solvent-oily chain interactions prevent aggregation and minimize the size of the aggregate, while interactions between the polar groups of the amphiphile promote aggregation.
[47]Therefore, self-assembly in apolar solvents is the consequence of dipole–dipole and ion pair interactions of the polar groups of amphiphiles.
[47]These interactions can be enhanced by the presence of water or ions due to intermolecular hydrogen bonding or metal coordination bonds.
[48]I.2.4.2 Extractant solutions and their structures: The packing parameter
There is a variety of extractants available that is heavily in research
2. They can be classified according to their mechanism of ion transfer in the organic phase.
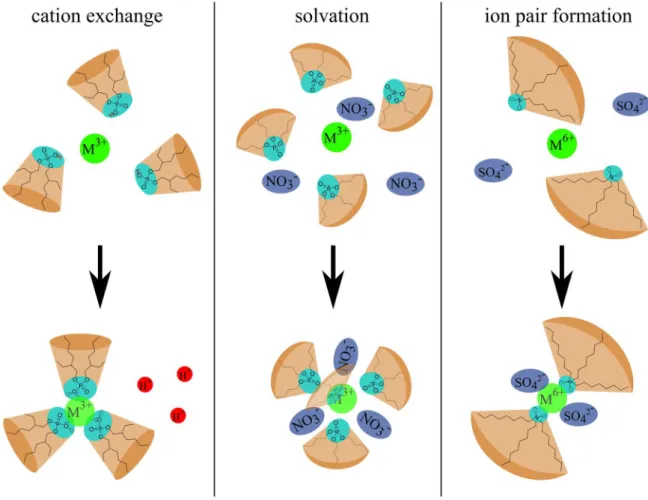
[49,50]A visual overview of the following mechanisms is given in Figure 10:
Cation exchange: Cation exchangers such as the organo-phosphorus extractant HDEHP have an acidic function and extract the desired ion by ion exchange and proton release.
Solvation: Such extractants (for example DEHiBA, TBP, TOPO) exhibit a neutral (non- ionic) polar function and are assumed to extract metal ions by forming a solvation shell in the organic phase. The ions are extracted as neutral complexes or aggregates.
Therefore, also water-soluble anions are part of the resulting coordination. This picture was refined by Dufrêche and co-workers, who have demonstrated that the ions not only interact by complexation or solvation with the first neighbors, but also via long-range
2
Overview of number of publications of some common extractants (2000-2018):
- HDEHP: 3950 - TBP: 24100
- Dialkylamides: 2120
- Malonamide: 1850
forces beyond the first neighbors.
[51] Formation of ion pairs: Basic extractants such as the amine ligand tri-octylamine (TOA) extract the desired metal ion by forming ion pairs. Therefore they can be seen as
‘liquid anion exchangers’.
[50]The mixing of two types of extractants can lead to advantageous effects, such as the “synergistic effect”
[52]. For certain combinations and ratios of extractants (for example HDEHP/TOPO) the extraction power is higher than expected from the values of the pure extractants.
Figure 10. Schematic overview over the three main mechanisms of metal extraction
Besides their mechanism of extraction, the aggregates formed can have different sizes and shapes. Since the work of Osseo-Asare
[35], one knows that it is possible to transfer certain aspects of surfactant science to systems used for solvent extraction.
In the 1970’s, several papers dealing with O/W micelles were expressing the difference in
chemical potential in a reference state (μ
0) and the chemical potential for a given concentration
(μ) not as a function of concentration and activity coefficients, but as radii of different cylinders,
ellipsoids and folded bilayers
[46,53,54]. This allowed for the first time to predict the shape of
micelles by including the concept of pseudo-phases
[44,55,56]. According to this concept
introduced by Shinoda
[55]and Tanford
[56], micelles can be thermodynamically treated as separate phases that are in chemical equilibrium with the surrounding continuous phase (cf.
Chapter III). As a consequence, the chemical potential 𝜇
,of an amphiphile in a micelle must be same as that of an amphiphilic monomer dissolved in the surrounding continuous phase (water or respectively organic diluent) 𝜇
,:
𝜇
,= 𝜇
,( 10 )
𝜇
,+ 𝑅𝑇ln𝑎
,= 𝜇
,+ 𝑅𝑇ln𝑎
,( 11 )
with:
- μ
idenoting the chemical potential - simply put “the tendency of a system to give the particles of type i”
[57]- of compound i in the corresponding pseudo-phase,
- a
idenoting the activity of compound i in the corresponding pseudo-phase and
- μ
i0denoting the standard reference chemical potential of compound i in the corresponding pseudo-phase. The standard reference chemical potential is defined as the chemical potential at which the activity coefficient and the ideal activity is equal to 1 and depends on the choice of the ideal activity expression. For liquid and solid mixtures, this corresponds to the pure system. For solutions it is defined by convention for solutes as infinitely dilute solutes with a standard concentration (depending on the choice of thee standard state) of either the molarity c = c
0= 1 mol/L, the molality of m = m
0= 1 mol/kg or the mol fraction of x = 1 mol/mol.
[57,58, pp.5–43]The second crucial step was the development of the lateral equation of state which comprises the two “opposing forces”
[56]that govern the self-assembly: headgroup repulsion and an attractive interaction arising from hydrophobic forces at the hydrocarbon-water interface.
[59,pp.535–576]


![Figure 15. The four organized microstructures described by Testard et al. [82]](https://thumb-eu.123doks.com/thumbv2/1library_info/3852712.1516138/45.892.158.746.339.751/figure-organized-microstructures-described-testard-et-al.webp)
