doi: 10.3389/fmars.2019.00268
Edited by:
Jacob Carstensen, Aarhus University, Denmark Reviewed by:
Cliff Ross, University of North Florida, United States James E. Kaldy, United States Environmental Protection Agency, United States
*Correspondence:
Thorsten B. H. Reusch treusch@geomar.de
Specialty section:
This article was submitted to Global Change and the Future Ocean, a section of the journal Frontiers in Marine Science
Received:28 February 2019 Accepted:03 May 2019 Published:24 May 2019
Citation:
Brakel J, Jakobsson-Thor S, Bockelmann A-C and Reusch TBH (2019) Modulation of the Eelgrass – Labyrinthula zosterae Interaction Under Predicted Ocean Warming, Salinity Change and Light Limitation.
Front. Mar. Sci. 6:268.
doi: 10.3389/fmars.2019.00268
Modulation of the Eelgrass –
Labyrinthula zosterae Interaction Under Predicted Ocean Warming, Salinity Change and Light Limitation
Janina Brakel1, Stina Jakobsson-Thor2, Anna-Christina Bockelmann1and Thorsten B. H. Reusch1*
1Marine Evolutionary Ecology, GEOMAR Helmholtz Centre for Ocean Research Kiel, Kiel, Germany,2Department of Marine Sciences-Tjärnö, University of Gothenburg, Strömstad, Sweden
Marine infectious diseases can have large-scale impacts when they affect foundation species such as seagrasses and corals. Interactions between host and disease, in turn, may be modulated by multiple perturbations associated with global change.
A case in point is the infection of the foundation species Zostera marina (eelgrass) with endophytic net slime molds (Labyrinthula zosterae), the putative agent of eelgrass wasting disease that caused one of the most severe marine pandemics across the North-Atlantic in the 1930s. The contemporary presence ofL. zosteraein many eelgrass meadows throughout Europe raises the question whether such a pandemic may re- appear if coastal waters become more eutrophic, warmer and less saline. Accordingly, we exposed uninfected Baltic Sea Z. marina plants raised from seeds to full factorial combinations of controlledL. zosteraeinoculation, heat stress, light limitation (mimicking one consequence of eutrophication) and two salinity levels. We followed eelgrass wasting disease dynamics, along with several eelgrass responses such as leaf growth, mortality and carbohydrate storage, as well as the ability of plants to chemically inhibit L. zosterae growth. Contrary to our expectation, inoculation withL. zosterae reduced leaf growth and survival only under the most adverse condition to eelgrass (reduced light and warm temperatures). We detected a strong interaction between salinity and temperature on L. zosterae abundance and pathogenicity. The protist was unable to infect eelgrass under high temperature (27◦C) in combination with low salinity (12 psu).
With the exception of a small positive effect of temperature alone, no further effects of any of the treatment combinations on the defense capacity of eelgrass against L. zosteraewere detectable. This work supports the idea that contemporaryL. zosterae isolates neither represent an immediate risk for eelgrass beds in the Baltic Sea, nor a future one under the predicted salinity decrease and warming of the Baltic Sea.
Keywords:Zostera marina, seagrass, wasting disease, climate change, holobiont, host–pathogen interaction, stress, heat wave
fmars-06-00268 May 23, 2019 Time: 16:51 # 2
Brakel et al. Modulation of the Eelgrass –Labyrinthula zosteraeInteraction
INTRODUCTION
Environmental stressors may change complex species interactions resulting in broad ecological restructuring (Araújo and Luoto, 2007; Tylianakis et al., 2008;Van der Putten et al., 2010; Yang and Rudolf, 2010). Key examples are co-evolved host – microbe interactions, which may change their nature in response to environmental stress. For example, commensals can turn pathogenic, as is the case for coral disease (Bally and Garrabou, 2007), or mutualists such as coral symbionts may become harmful and are thus expelled from the coral host (Webster and Reusch, 2017). It has been argued that disease prevalence will increase under progressive severity of global change (Harvell et al., 1999, 2002). Under this scenario, commensals and opportunistic pathogens are more likely to cause a disease because either the host immune competence is compromised, and/or pathogen reproduction rates increase (Burge et al., 2013).
For most marine host–pathogen systems the influence of environmental factors is unresolved. This applies to the seagrass –
‘wasting disease’ interaction, where species of marine flowering plants are infected by a colonial protist species belonging to the Stramenopiles (Labyrinthulidae, net slime molds). Seagrasses are foundation species that build up extensive meadows in shallow coastal waters, providing a variety of valuable ecosystem services (Costanza et al., 1998; Cullen-Unsworth et al., 2014). At the same time, these ecosystems are declining globally at a rate faster than rain forests owing to a multitude of factors such as eutrophication, coastal construction, global warming, and invasive species (Orth et al., 2006; Waycott et al., 2009). Most notably in the context of our study, the largest reported seagrass die-off was caused by the ‘wasting disease’ that devastated populations of eelgrass (Zostera marinaL.) on both sides of the Atlantic in the 1930s (Den Hartog, 1987). During the pandemic, necrotic lesions rapidly spread on eelgrass leaves followed by leaf detachment and final death of eelgrass shoots (Muehlstein, 1989). Lesions were later causally related to an infection by the marine net slime mold Labyrinthula zosterae(Short et al., 1987;Muehlstein et al., 1988).L. zosteraeand otherLabyrinthula spp. are endophytes that inhabit leaves of various seagrass species (Martin et al., 2016), feeding on plant cell organelles by osmotrophy (Muehlstein, 1992;Raghukumar, 2002).
Today, a presumably pathogenic strain based on full length 18S sequencing ofL. zosteraeis widespread in eelgrass meadows in the Atlantic and Pacific Ocean, without being associated with mass-mortalities (Bockelmann et al., 2012, 2013; Martin et al., 2016). The ubiquitous presence of moderate abundances of L. zosterae in contemporary eelgrass meadows without disease symptoms against the background of proceeding global environmental change raises the question whether environmental stressors and their interaction can change the interaction between eelgrass and L. zosterae (Olsen and Duarte, 2015; Bishop et al., 2017;Jakobsson-Thor et al., 2018; Sullivan et al., 2018).
Moreover, interactions with the plant host defense system may play an important role for controlling infections via plant secondary metabolites (reviewed inZidorn, 2016). For example, inZ. marina, presumablyL. zosteraeinduced lesion coverage was
correlated to the production of phenolic compounds, and their production was induced by experimental L. zosterae infection (Vergeer and Develi, 1997;McKone and Tanner, 2009).
Thus, an experiment is highly warranted that manipulates several stressors simultaneously to study the responses of the seagrass – ‘wasting disease’ interaction. While some recent work addresses the interaction of temperature and light on eelgrass leaves in Z. marina (Dawkins et al., 2018), and of sediment oxygen, sulfide, temperature and light on entire plants of the tropical species Thalassia testudinum (Bishop et al., 2017), we here present for the first time a study using entire plants that were raised from seeds and thus were infection free at the time of controlled inoculation. One additional factor may impede L. zosterae abundance and virulencein planta is salinity, with low levels of salinity being correlated with weak or absent disease symptoms and higher resistance of eelgrass plants to infection (Pokorny, 1967; Muehlstein et al., 1988; McKone and Tanner, 2009). In the light of decreasing salinity levels in the southwestern part of the Baltic Sea (Meier et al., 2006) this motivated us to also include salinity as another experimental factor.
Here, we present results of a multifactorial experimental designed to evaluate responses to simultaneously occurring stressors and investigated the influence of shading, elevated temperatures and decreased salinity level and their interaction on wasting disease dynamics in Zostera marina. We raised naïve eelgrass plants from the southwestern Baltic Sea and experimentally inoculated them with sympatric L. zosterae isolates belonging to a putatively pathogenic phylotype. We hypothesized that light limitation (as one key consequence of water column eutrophication), heat stress and decreased salinity would change the infectivity of and virulence ( = damage to the host) caused byL. zosterae. While we were expecting ocean warming and low light levels to disfavor the plant host, we were predicting low salinity to reduceL. zosteraeinfectivity and virulence. As seagrasses are known to produce a wide range of secondary metabolites that can inhibit growth of microorganisms (reviewed inZidorn, 2016), we also used leaf extracts to assess whether or not those inhibit L. zosterae growth. Further, we hypothesized that there are synergistic effects between stressors that would escape detection in a single factor experiment.
MATERIALS AND METHODS Cultivation of Eelgrass and Labyrinthula zosterae
We raised uninfected eelgrass plants during the year before the experimentation from seeds collected from fruiting shoots collected from two nearby field locations in July 2014 (south- western Baltic Sea: Strande N 54.434, E 10.170, Eckernförde N 54.449, E 9.871) After final ripening of reproductive shoots in large indoor tanks, ripe seeds were sown in plastic containers into 2 cm of sterilized silicate sediment and vernalized for 75 days at darkness and 6◦C. Upon slowly increasing water temperatures, about 20% of the seeds germinated at 8◦C and grew as seedlings for half a year in tanks with sterilized sediments and filtered seawater. For more details on eelgrass rearing
see Supplementary Note S1. In August 2015, Labyrinthula zosteraecultures were isolated according to published protocols (Bockelmann et al., 2012) from eelgrass leaves displaying typical wasting disease symptoms at one of the seed collection sites (Strande: N 54.434, E 10.170). Briefly, eelgrass leaves were surface sterilized, cut into pieces and incubated on seawater growth medium plates at a salinity of 25 psu (see Bockelmann et al., 2012). As soon as L. zosterae cultures appeared, these were transferred to seawater growth medium plates with salinity levels ranging from 12 to 25 psu to support a high potential diversity ofL. zosteraegenotypes by providing a salinity gradient.
L. zosterae cultures were proliferated for 2 weeks to obtain sufficient culture material for the inoculation treatment. After isolation, colony morphology was inspected with a dissecting microscope at 60×for the typical colony form ofLabyrinthula sp. and DNA sequencing of the full-length 18S rDNA confirmed 100% identity to a previously identified L. zosterae phylotype from the North-Atlantic (GenBank acc. no MG333729).
Experimental Design, Experimental Conditions and Treatments
Mature eelgrass plants raised from seeds (see Supplementary Note S1) had a total length of 25–35 cm and first side shoots.
They were planted in plastic (PE) boxes (16 × 26 × 16 cm) filled to a height of 12 cm with natural sediment from the Baltic Sea (N 54.394, E 10.190). Two groups of three individual plants with confirmed genotypic difference were weighed and planted into the boxes at approximately equal distance from one another. Two boxes each were submerged in one 300 L tank of which one would receive L. zosterae inoculation. Plants across boxes were unable to touch each other. Water within the tanks was aerated and circulated within tanks a rate of ≈700 L·h−1. Titan heating elements (Schego, Germany) along with a controlling system (Biotherm, Hobby-Aquaristik, Germany) adjusted temperatures throughout the experiment in each tank individually. Metal-halide lamps (Philips, Master Green Power 400 W, light intensity at canopy height of seagrasses ∼195 µmol·photons·s−1·m−2) provided light in 16:8 h light/dark cycle corresponding to local summer conditions. During the experiment half of the water volume was exchanged every second week. Temperature and salinity were measured daily.
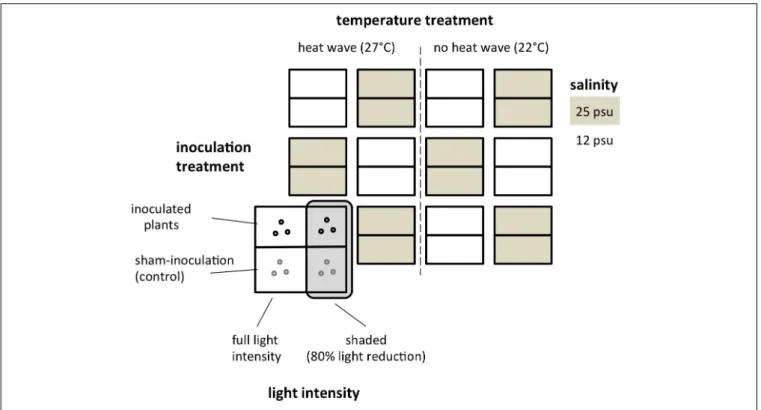
The experimental factors heat stress (yes/no), light availability (shaded/full light), salinity (12/25 psu), and inoculation with L. zosterae(yes/no) were fully crossed. Treatment combinations of heat stress and salinity were replicated three times at the level individual tanks (2 ×2 ×3 = 12 experimental units = 300 L tanks). The light treatment was nested within tanks, with one side of the tank covered by a shading panel, while the other half of the tank received full light intensity. Fully crossed within tanks were also the two planting boxes, representing the sub- replicates in terms of controlled inoculation (Figure 1). The tanks received a water exchange of 1/3 every week and were otherwise independent from one another. Water was not checked for the presence of L. zosteraeas previous assays revealed no detectable abundance.
The temperature treatment simulated a future summer heat wave and attained a temperature of 27◦C for 10 days. The length of the heat wave corresponded to the 2003 heat wave in central Europe (Reusch et al., 2005). The chosen temperature treatment represented an extreme weather event, which is expected to become more frequent in the future due to climate change (IPCC, 2014). The ambient treatment had a temperature of 22◦C (Figure 2). In full combination to the temperature treatment, we applied a shading treatment that reduced the light intensity by 80% from ∼195 µmol·photons·m−2·s−1 to ∼40 µmol·m−2·s−1, simulating light reductions owing to eutrophication (Short et al., 1995).
The seagrass – Labyrinthula sp. interaction is strongly influenced by salinity (McKone and Tanner, 2009; Trevathan et al., 2011). At the same time, the Baltic Sea is expected to undergo major salinity reductions in the coming decades (Meier et al., 2006). Hence we tested a medium salinity of 25 psu for our area with one that is at the lower end of the salinity distribution (12 psu; Hiebenthal et al., 2013). To obtain water of salinity 12 and 25 psu we mixed filtered (5 µm) Baltic Sea water of approximately 15 psu and added either artificial sea salt (Seequasal GmbH) or deionized water and tap water (1:1) to reach salinity 12 or 25 psu, respectively.
Controlled inoculation by L. zosterae was performed as described inBrakel et al. (2014)on the second day of shading and heat wave exposure and simulated infection spread through physical contact of infected leaves. In brief, sterile medical gauze pieces of 1.5 × 1.5 cm size were placed on seawater growth medium plates with or withoutL. zosteraeculture material. Gauze pieces were incubated on these plates for 5 days untilL. zosterae culture had overgrown the gauze pieces. Gauzes were attached carefully via wrapping with soft plastic-coated wire for 48 h to the leaf of the second and third rank of the eelgrass shoots. The control plats were sham inoculated, thus all manipulation was done identical except that the gauze contained noL. zosterae.
Sampling and Response Variables
Wasting disease symptoms and numbers of L. zosteraecells in leaf tissue were determined at the second and eighth day post inoculation of the leaf of third and second rank, respectively.
Note that in Z. marina, the first leaf is very fast growing and sometimes hardly visible, hence the first fully grown leaf is the second leaf. Typical wasting disease symptoms are black necrotic irregular lesions on eelgrass leaves. Percent lesion coverage on the leaves (“wasting disease index”; Burdick et al., 1993) was determined by measuring the length of the necrotic black lesions and the maximum leaf length with a ruler, assuming that leaf width is constant over the time course of the experiment within a plant. To quantify L. zosterae cells within leaf tissue with molecular methods (Bergmann et al., 2011), we harvested a leaf piece from 5 cm below to 5 cm above inoculated site. Leaf pieces were air dried, weighed and powdered by a ball mill (Retsch, Germany). We extracted DNA with InvisorbR DNA Plant HTS 96 Kit (Stratec Molecular, Germany) following the manufacturer’s instructions, with the modification to add 500 ngµL−1Salmon sperm DNA (Life Technologies, United States) to saturate silica columns with non-targeted DNA. Real time quantitative PCR
fmars-06-00268 May 23, 2019 Time: 16:51 # 4
Brakel et al. Modulation of the Eelgrass –Labyrinthula zosteraeInteraction
FIGURE 1 |Experimental design of the eelgrass-Labyrinthulamulti-stressor experiment. Depicted is the distribution of tanks and experimental units, and the corresponding temperature, salinity, light andL. zosteraeinoculation treatment. Treatments were randomized in space with respect to the temperature treatments.
FIGURE 2 |Environmental parameters during the inoculation experiment. Panels depict (from top to bottom) temperature (◦C,A), light (µmol·m−2·s−1,B), and salinity (psu, practical salinity units,C) values over time. Black vertical line indicates the day when eelgrass plants were inoculated withLabyrinthula zosterae(or sham-inoculation as control).
(RT-qPCR) was performed as described inBergmann et al. (2011) andBockelmann et al. (2013)by a Taqman probe based assay.
A standard curve was prepared of the same L. zosterae strain used for inoculation, and included on each RT-qPCR plate; 0.5 cells (CT: 36.22±0.26), 15 cells (CT: 30.52±0.12), and 150 cells (CT: 25.64±0.37).
Eelgrass leaf growth rate was determined during and after the 10-day stress phase of reduced light /enhanced temperature.
Therefore, leaf length of all leaves was measured twice over a 7- day interval. As a measure of damage to the plant (=virulence), we also calculated the ‘net growth rate’ by subtracting leaf growth rate by lesion expansion rate.
We counted shoots including new side shoots throughout the experiments and calculated vegetative reproduction rates, respectively mortality. Plant dry weight (as a proxy for biomass production), measurement of soluble carbohydrates and chemical defense capability of leaf extracts was measured at the end of the experiment. Twenty four days post inoculation (45 days total) all main shoots were carefully excavated, cleaned from sediment, freeze-dried for 72 h and weighed. An aliquot of leaf tissue was homogenized with a ball mill for analysis of soluble carbohydrates and extraction of chemical compounds for theL. zosteraegrowth assay (see below). For starch measurement in the belowground tissue, a part of the rhizome (without roots) between first and third internode was homogenized.
Carbohydrates were extracted according toHuber and Israel (1982) with modifications. Briefly, sucrose was extracted by boiling the plant material in 90% (v/v) MeOH four times.
Starch was recovered subsequently from methanol-insoluble plant residuals. These residuals were incubated for 12 h with 0.1 M NaOH. Starch concentrations were determined in a photometric assay with anthrone at 640 nm, relating sample absorbance to a standard curve (Yemm and Willis, 1954), while sucrose was determined in a photometric assay with resorcinol measuring absorbance at 486 nm (Huber and Israel, 1982).
To investigate whether the inhibitory effect against L. zosteraediffers between eelgrass shoots subjected to different environmental stressors, 6.5 mg of the aboveground biomass of each shoot was extracted in methanol: dichloromethane (1:1) for 1 h under gentle mixing. Plant debris was removed by filtering and solvents were evaporated under nitrogen gas. The inhibition capacity of eelgrass extracts against L. zosterae growth was assessed in liquid medium in a modified growth assay described inMartin et al. (2009). Each sample was re-dissolved in 1 mL liquid growth media (seawater growth medium without agar) containing 1% dimethyl sulfoxide, resulting in a 1/13 volumetric concentration of the leaf. The samples were transferred to 6 well plates (Ø = 35 mm), and L. zosterae plugs (Ø = 7 mm) taken from cultures growing on agar plates were placed faced down in the center of each well. Wells containing growth media and 1% DMSO without eelgrass extracts (n = 18) served as negative controls (Jakobsson-Thor et al., 2019). The well plates were covered and incubated at 25◦C in the dark. After 14 h the L. zosterae colony growth was marked, photographed and the total area of the colony was quantified. The detection limit of our quantitative PCR method is about 20 cells *mg dry weight−1of extractedZ. marina tissue (corresponding to 2 mg dry weight
extracted material and an aliquot of 1/40 used in the PCR reaction = 1 cell per PCR reaction).
Statistical Analysis
To evaluateL. zosteraecell numbers, lesion coverage, net growth and inhibition capacity of eelgrass extracts we applied a linear mixed model of the package lme4 (Bates et al., 2014) within R version 3.1.2. This method estimated the approximate degrees of freedom through maximum-likelihood (Kenward and Roger, 1997). To account for sub-replication within the tank, we defined ‘aquaria’ (box with planted eelgrass shoots) nested in
‘tank’ as a random factor. Salinity, temperature, light intensity and inoculation were assigned as fixed factors allowing for all possible interactions. We performed an ANOVA (type III sums of squares). To achieve normality data ofL. zosteraecell numbers and lesion coverage the data was log transformed. We inspected normality, homogeneity of residuals visually examining qq-plots.
Fitness associated parameters (leaf growth rates, survival of eelgrass main shoot, production rate of side shoots, eelgrass dry weight as a proxy for biomass production, sucrose and starch concentration in leaves and rhizome) were interrelated and not independent. To reduce type 1 error we analyzed the parameters by multivariate analysis. A PERMANOVA was conducted, using Euclidian distances and 9999 permutations of the package vegan (Oksanen et al., 2016). As a PERMANOVA does not handle random factors, we calculated the mean values of samples from the same aquarium. For PCA graphs we performed a z-scaling. All primary data were deposited in the data repository PANGAEA under the doi: https://doi.pangaea.de/
10.1594/PANGAEA.897188.
RESULTS
Abundance and Pathogenicity of Labyrinthula zosterae
In order to assess the infection success and the ability to produce disease symptoms under different environmental treatments, we evaluated L. zosteraecell numbers in leaf tissue in parallel with the measurement wasting disease symptoms (lesion coverage) on inoculated leaves 2 and 8 days post inoculation.
Sham-inoculated plants (thus only administering the gauze onto leaves) harbored no detectableL. zosteraeat the onset of the experiment. In contrast to our initial hypothesis,L. zosteraecell numbers were neither generally elevated at higher temperature, nor under the shading treatment imposing low light stress on eelgrass. Overall, L. zosteraeabundance declined over time in terms of lesion coverage (Figures 3A,C) and numbers (Figures 3B,D). We detected on average 17,600 and 4,900 L. zosterae cells mg leaf dry weight−1 at day 2 and 8 post inoculation, respectively.
Labyrinthula zosterae cell numbers differed as a function of temperature (main effect) and more importantly owing to an interaction among temperature and salinity treatments (Table 1). At both sampling points, only under the high temperatures did we find a pronounced negative effect of low salinity the low compared to high salinity level (12 vs.
fmars-06-00268 May 23, 2019 Time: 16:51 # 6
Brakel et al. Modulation of the Eelgrass –Labyrinthula zosteraeInteraction
FIGURE 3 |Box plots ofL. zosteraeabundance as function of the multi-stressor treatment. Upper panels show abundance 2-days post inoculation as(A)necrotic lesion area (% lesion coverage) and(B)L. zosteraecell abundance (as mg dry weight leaf tissue−1) determined by Taqman based RT-qPCR assay. Panels(C,D):
same response variables 8 days post inoculation. Inoculation control includes samples withoutL. zosteraeinoculation from all treatments. Thex-axis displays the combinatorial structure of the stress treatments. Color codes are corresponding to the ones used inFigure 6(PCA).
25 psu) on both, lesion coverage (Figures 3A,C) andL. zosterae cell numbers (Figures 3B,D). Under low salinity and high temperature (27◦C) L. zosterae was rare within seagrass leaves [31.90 ±6.98 and 25.65 ±17.84 (mean ± 1SE) cells mg leaf dry weight−1] and did not exceed the threshold abundance of the inoculation control (Figures 3B,D). Control treatments without experimental inoculation at most attained 0.2% of the L. zosterae abundance in inoculated treatments 8 days post inoculation. Two days post infection, we also verified that non- inoculated plants (N = 6 across treatments) only had very low L. zosteraebackground concentrations (41.6±17 cells∗mg dry weight−1mean±1 SE) which were at the detection limit of our quantitative PCR method.
Necrotic lesion coverage (Figures 3A,C) mostly followed the trends of L. zosterae cell numbers (Figures 3B,D) and were positively correlated at both time points (Spearman rank correlation, 2 days post inoculation: rs = 0.92,N= 63,p<0.001;
8 days post inoculation: rs = 0.83, N = 68, p < 0.001).
Similarly toL. zosteraecell numbers lesions were neither elevated significantly at higher temperature imposing heat stress on the plants, nor under the shading treatment imposing low light stress. Smaller lesions developed at low compared to high salinity (ANOVA, F1,8 = 6.48, p = 0.03, Table 1 and
Figure 3) 2 days post inoculation. Lesion coverage was 55%
smaller in plants at 12 psu and 22◦C compared to plants at salinity 25 at the same temperature. At low salinity level and high temperatures no visible necrotic lesions developed (Figures 3A,C). The interaction of temperature and low salinity significantly affected lesion coverage 8 days post inoculation (ANOVA, F1,8 = 6.47, p = 0.03, Table 1). The highest lesion coverage was detected on light limited plants at 27◦C and high salinity with 45.42±13.51% (mean±1SE) coverage, however, the interaction between temperature, salinity and light was not statistically significant (Table 1).
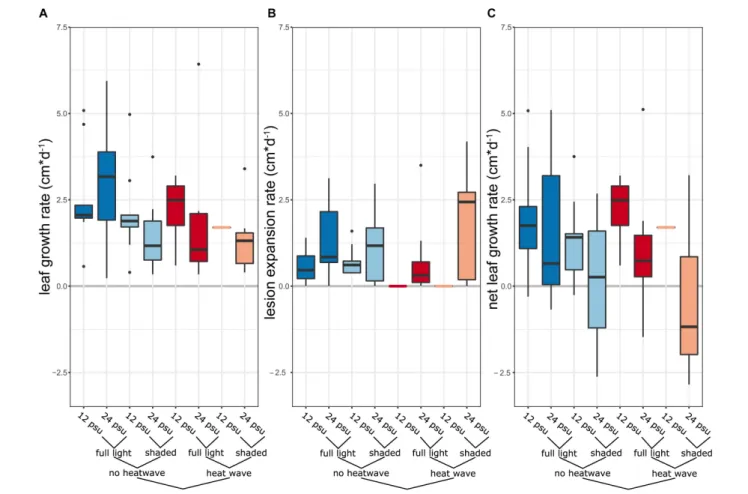
We then calculated how fast lesions would spread along the leaf during the stress treatment (Figures 4A,B). These ranged on average per treatment between 0.55 cm·d−1(full light, salinity 12, 22◦C) and 1.73 cm·d−1(shaded, salinity 25, 27◦C). To examine the added effect of necrotic lesion and reduced growth due to the stress treatment we calculated a net growth rate value by subtracting leaf growth rate by lesion expansion rate (Figure 4C).
While leaf growth rates exceeded lesion expansion in most treatments, this was not the case in shaded heat stressed plants at 25 psu, where the average net growth rate±1 SE was negative (−0.41±0.68 cm·d−1). There was a trend that light intensity increased net growth rates (F1,7= 4.34,p= 0.08).
TABLE 1 |Generalized linear mixed model: effects of two salinity levels, two light levels, and two temperature levels onLabyrinthula zosteraeabundance, quantified as cells mg dry weight leaf tissue−1and lesion coverage [%] of leaves 2 and 8 days post inoculation, respectively.
F Df Df res P
No.L. zosteraecells 2 days post inoculation Salinity 0.43 1 8.86 0.53
Light 0.07 1 6.69 0.80
Temperature 11.15 1 9.42 0.01
Salinity: Light <0.01 1 5.80 0.99
Salinity: Temperature 6.78 1 9.06 0.03
Light: Temperature 0.02 1 6.63 0.89
Salinity: Light: Temperature 0.07 1 5.53 0.80
No.L. zosteraecells 8 days post inoculation Salinity 0.1308 1 9.47 0.72
Light 1.98 1 4.76 0.22
Temperature 13.23 1 9.84 <0.01
Salinity: Light 3.12 1 5.06 0.14
Salinity: Temperature 5.19 1 10.63 0.04
Light: Temperature 0.31 1 8.18 0.59
Salinity: Light: Temperature 0.73 1 6.87 0.42
Lesion coverage[%]2 days post inoculation Salinity 6.48 1 8.02 0.03
Light 0.29 1 7.41 0.60
Temperature 1.34 1 8.01 0.27
Salinity: Light 0.01 1 7.66 0.91
Salinity: Temperature 2.81 1 8.05 0.13
Light: Temperature 0.27 1 7.80 0.61
Salinity: Light: Temperature 0.57 1 7.93 0.47
Lesion coverage[%]8 days post inoculation Salinity 7.47 1 8.13 0.02
Light 0.64 1 7.67 0.45
Temperature 8.14 1 8.13 0.02
Salinity: Light 0.15 1 8.18 0.71
Salinity: Temperature 6.47 1 8.26 0.03
Light: Temperature 0.30 1 8.39 0.59
Salinity: Light: Temperature 1.68 1 8.76 0.22
Only inoculated plants were considered as there were neither lesions nor measurable L. zosterae abundance in the non-inoculated treatment. The residual degrees of freedom were estimated according to the restricted maximum likelihood approach of a Kernward–Roger approximation, implemented in the R-package “car”. Boldface p-values are statistically significant.
Capacity of Eelgrass Extracts to Inhibit L. zosterae Growth
Diluted leaf extracts in all treatments inhibited L. zosterae growth significantly compared to the control medium without eelgrass extracts (ANOVA, F1,140 = 251.06, p < 0.001).
The inhibition capacity compared to the control ranged between 20.0 and 90.2%. Temperature treatment increased the inhibition capacity. Extracts from eelgrass shoots exposed to the heat wave inhibiting L. zosterae growth 7% more than in non-heat stressed plants (Figure 5; ANOVA, F1,29= 4.65, p= 0.04). Exposure to one of the other treatments (inoculation, light or salinity), or any interaction of these, did not influence the inhibiting capacity ofZ. marinaextracts (Table 2 andFigure 5).
Eelgrass Fitness Associated Parameters
To assess the damage L. zosterae infection causes in eelgrass under different environmental treatments, we assessed several eelgrass fitness associated parameters, namely leaf growth rates, shoot survival, rate of side shoot production,
eelgrass dry weight as a proxy for biomass production, and sucrose and starch concentration in leaves and rhizome.
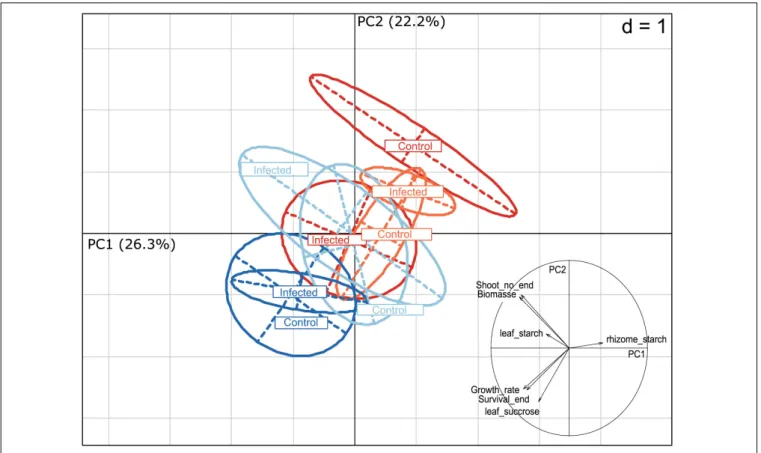
Heat stress treatment had the strongest effect on eelgrass responses (PERMANOVA: F1 = 3.31, p = 0.03, Table 3 and Figure 6). Replicates clustered in opposite corners of a PCA diagram displaying axis 1 and 2 with 26.3 and 22.2% of the variation explained, respectively, as a function of the temperature treatment. In an indicator variable analysis, vectors of leaf growth rate, survival and leaf sucrose concentration pointing toward the non-heat stressed plants in the lower left corner, indicating that plants subjected to heat stress had lower growth rates, survived less frequently and had lower leaf sucrose concentration.
In contrast, biomass, eelgrass vegetative shoot production and starch content (leaf and rhizome) contributed only little to the clustering.
Light limitation had the second strongest effect on eelgrass (PERMANOVA: F1 = 2.88, p = 0.05, Table 3 andFigure 6).
Similar to responses to heat stress, light limited plants clustered more to the upper right corner, while data points corresponding to full light conditions were found in the lower left corner.
fmars-06-00268 May 23, 2019 Time: 16:51 # 8
Brakel et al. Modulation of the Eelgrass –Labyrinthula zosteraeInteraction
FIGURE 4 |Growth response of eelgrass inoculated byL. zosteraeto a combination of abiotic treatments(A)Leaf growth rates of inoculated plants according to the respective stress treatment in cm·d−1during the stress treatment.(B)Expansion rate of necrotic lesion in inoculated leaves in cm·d−1.(C)Net leaf growth rate was calculated by subtracting the leaf growth rate by lesion expansion rate in cm·d−1.
FIGURE 5 |Inhibition capacity of eelgrass extracts onLabyrinthula zosteraegrowth according to experimental treatments to which eelgrass shoots were exposed during the experiment. Control representsL. zosteraegrowth in liquid growth medium without eelgrass extracts.L. zosteraegrowth assays were performed for all treatments at 25◦C in the dark for 14 h.
TABLE 2 |Generalized linear mixed model results for eelgrass extract inhibition capacity onLabyrinthula zosteraegrowth according to experimental treatments from which eelgrass shoots were exposed to during experiment.
Effect F Df Df res P
Salinity 0.56 1 30.41 0.46
Light 0.30 1 15.58 0.59
Temperature 4.65 1 29.37 0.04∗
Infection 0.25 1 29.97 0.62
Salinity: Light 0.98 1 18.00 0.34
Salinity: Temperature 1.27 1 28.56 0.27
Light: Temperature 1.95 1 13.66 0.19
Salinity: Inoculation 0.12 1 27.98 0.73
Light: Inoculation 0.12 1 16.44 0.73
Temperature: Inoculation 3.20 1 28.16 0.08
Salinity: Light: Temperature 2.17 1 15.06 0.16
Salinity: Light: Inoculation 0.10 1 19.08 0.76
Salinity: Temperature: Inoculation 1.52 1 27.35 0.23
Light: Temperature: Inoculation 0.85 1 14.08 0.37
Salinity: Light: Temperature: Inoculation 0.22 1 15.62 0.65
Random factor: tank nested in aquarium. The residual degrees of freedom (DF res) were estimated according to the restricted maximum likelihood approach of a Kernward–Roger approximation, implemented in the R-package “car”. SS, sums of squares; MS, mean squares; df, degrees of freedom. Boldface p-values are statistically significant.
A distinct cluster was formed by data from non-inoculated plants under full light and heat stress, indicating the highest mortality, smallest leaf growth and lowest leaf sucrose. There was a trend for an interactive effect of inoculation treatment and shading (PERMANOVA:F1= 2.37,p= 0.07). Salinity or the interaction of salinity with the other treatments did not significantly affect fitness-associated parameters (Table 3).
DISCUSSION
It is still contentious whether or not marine diseases are increasing in the face of global warming and increasing anthropogenic pressure on marine ecosystems (Harvell et al., 2002;Lafferty et al., 2004). Here, we present one of the first studies investigating the combined effect of multiple stressors on a key marine host–pathogen system. To the best of our knowledge, we establish an infection protocol based on non-infected plant hosts that were initially raised from seeds for the first time in combination with a realistic, multi-stressor experiment addressing several expected environmental perturbations of the global coastal ocean. We focused on the infection of eelgrass by Labyrinthula zosterae, an interaction that was putatively responsible for one of the largest pandemics ever recorded in marine systems, when 90% of thetrans-Atlantic populations of eelgrass disappeared in the 1930s (Den Hartog, 1987;Muehlstein, 1989), and that results in detrimental negative effects on plant performance such as photosynthesis (Ralph and Short, 2002).
We tested the combined effect of some of the most severe causes of seagrass decline worldwide (Waycott et al., 2009;
Duarte et al., 2018), namely elevated temperature, shading (mimicking increased turbidity as one major consequence of water column eutrophication) and two salinity levels on the eelgrass – L. zosteraeinteraction. Moreover, both warming and decreasing salinities well above the average for the Atlantic region are two of the key changes predicted for the Baltic Sea in the coming decades, as well as for other temperate coastal regions throughout the northern hemisphere (Meier et al., 2006; Reusch et al., 2018). Neither of the stressful conditions in isolation resulted in L. zosterae becoming more virulent. Instead we detected a negative synergistic interaction between high temperatures and low salinity, preventing wasting
TABLE 3 |PERMANOVA results of eelgrass fitness associated measures (leaf growth rate, side shoot production, survival rate, root starch concentration, leaf starch concentration, leaf sucrose concentration, plant dry weight) according to experimental treatments.
Effect Df SS MS Fmodel R2 P-value
Temperature 1 4.87 4.87 3.31 0.06 0.03∗
Inoculation 1 0.51 0.51 0.34 <0.01 0.77
Salinity 1 2.00 2.00 1.36 0.02 0.25
Light 1 4.23 4.23 2.88 0.05 0.05∗
Temperature: Inoculation 1 0.60 0.60 0.40 <0.01 0.72
Temperature: Salinity 1 1.42 1.42 0.96 0.01 0.39
Temperature: Light 1 2.72 2.72 1.85 0.03 0.15
Inoculation: Salinity 1 0.56 0.56 0.38 <0.01 0.74
Infection: Light 1 3.49 3.49 2.37 0.04 0.07
Salinity: Light 1 2.09 2.09 1.42 0.02 0.23
Temperature: Inoculation: Salinity 1 1.02 1.02 0.69 0.01 0.52
Temperature: Inoculation: Light 1 1.02 1.02 0.69 0.01 0.52
Temperature: Salinity: Light 1 1.52 1.52 1.03 0.02 0.36
Inoculation: Salinity: Light 1 2.08 2.08 1.41 0.02 0.24
Temperature: Inoculation: Salinity: Light 1 0.36 0.36 0.25 <0.01 0.85
Residuals 32 47.05 1.47 0.62
Total 47 75.61 1.00
SS, sums of squares; MS, mean squares; df, degrees of freedom. Boldface p-values are statistically significant.
fmars-06-00268 May 23, 2019 Time: 16:51 # 10
Brakel et al. Modulation of the Eelgrass –Labyrinthula zosteraeInteraction
FIGURE 6 |Principal component analysis (PCA) of eelgrass responses (leaf growth rate, shoot production, survival rate, rhizome starch concentration, leaf starch concentration, leaf sucrose concentration, plant dry weight) as a function of the multi-stressor treatments. Vectors within the circle indicate the direction and strength of particular variables to the overall response in an indicator variable analysis. Treatments were pooled over salinity levels as no significant effect or interaction of salinity was detected by PERMANOVA (Table 3), dark red, heat stressed and full light; light red, heat stressed and shaded; dark blue, ambient temperature and full light; light blue, ambient temperature and shaded.
disease symptoms and keeping the abundance of L. zosterae low within eelgrass leaf tissue. A similar decrease of wasting disease symptoms was reported for temperatures above 28◦C for Posidonia oceanicaandCymodocea nodosain the Mediterranean after experimental infection with a Labyrinthula sp. isolate from its respective host (Olsen et al., 2014; Olsen and Duarte, 2015). In vitro cultivations of these Labyrinthula sp. isolates revealed that temperatures > 28◦C decreased reproduction of the protist. Similarly, a decline in reproduction rates in low saline medium including the failure to produce an ectoplasmic network has been found for several marine Labyrinthula spp. (Young, 1943; Pokorny, 1967; Muehlstein et al., 1988;
Martin et al., 2009). That a particular combination of both stressors (high temperature and low salinity) led to reduced performance of L. zosterae in the present study in planta would have been missed had we only performed single factor experimentation. Our finding is analogous to interactive effects found in Caribbean turtlegrassThalassia testudinuminfected by anotherLabyrinthulaspecies, where the hypothesized stressors for the plant were actually more stressful to the protist (Bishop et al., 2017).
We still know little on the interaction of light availability and temperature on seagrass wasting disease dynamics (but
see Dawkins et al., 2018 on eelgrass leaf tissue). Wasting disease occurrence in temperate eelgrass populations peaks during the warmest period of the year (Hily et al., 2002;
Bockelmann et al., 2013), which might indicate a positive influence of warmer temperatures. Olsen and co-authors isolated Labyrinthula spp. from Posidonia oceanica and Cymodocea nodosa in the Mediterranean and investigated the influence of temperature on wasting disease symptoms in the respective seagrass species. Here, high summer temperatures limited the spread of necrotic lesions in both seagrass species (Olsen et al., 2014; Olsen and Duarte, 2015), thus it was again the protist that suffered more from global change. As for light availability, Vergeer et al. (1995) reported that light limitation increased wasting disease occurrence on eelgrass in a pilot experiment with little replication, but unfortunately did not follow up on it.
In contrast to seagrass-Labyrinthula interaction in the Mediterranean Sea, where high summer temperatures reduce pathogen pressure (Olsen et al., 2014;Olsen and Duarte, 2015), our results show that under favorable (i.e., high) salinities for the endophyte, the tested L. zosterae isolate can sustain and efficiently infect eelgrass at temperatures of 27◦C. This suggests that in temperate regions, where 27◦C is at the warm end of possible sea surface temperatures (Reusch et al., 2018),L. zosterae
could potentially benefit at high temperatures at the expense of its host plant.
Neither of the treatment combinations was able to reduce the inhibition capacity of eelgrass leaf extracts on L. zosterae growth (Figure 5). Although we do not know howL. zosterae growth inhibition in the assay relates to in plantadefense, the results are a first indication that neither low light stress, heat stress nor their combined effects reduces the production of inhibitory compounds. Our result also corroborate studies of the inhibitory effect of eelgrass extracts collected from different salinity regimes on the Swedish west coast that found no effect of salinity regime origin (Jakobsson-Thor et al., 2018). In contrast to studies on phenolic acids, which has been hypothesized to be a chemical defense againstL. zosterae(Vergeer et al., 1995), the inhibitory effect on L. zosterae by Z. marina compounds extracted in our study did not decrease by light limitation or elevated temperatures.
When the host defense fails to prevent the entry of potential pathogens, the ability to tolerate an infection is a key trait.
An important tolerance mechanism is the compensation of necrotic tissue expansion via leaf growth. Only under the most adverse treatment combination toZ. marinaof low light intensity, high temperature and high salinity level (the latter indirectly favoring the pathogen) necrotic lesion expansion by the endophyte exceeded leaf growth rates, with a concomitant net loss of photosynthetic active tissue. In our experiment we applied shading for only 10 days. Hence, if leaf growth is reduced by turbidity or epiphytes for longer time periods, for example owing to eutrophication, lesion expansion may easily exceed leaf growth. In such a scenario, even low pathogenic L. zosteraegenotypes could become detrimental and contribute to the decline of eelgrass population.
Since we were unable to identify clear environmental drivers of disease outbreak, our study cannot contribute to solving the factors that led to the pandemic outbreak of wasting disease in the 1930s. One possible explanation for the 1930s pandemic is conditions unfavorable to the host species such as extremes in temperature (Short et al., 1995) or precipitation (Martin, 1954), reduced light intensity owing to eutrophication (Giesen et al., 1990), or a combination of those factors which have been invoked to favor the susceptibility of eelgrass. Another complex of factors most likely relate to rapid co-evolution between plant host and potentially pathogenic protists, which this study did not address. For example, a virulent form of the genus Labyrinthula could have evolved and disappeared after most host plants were wiped out in the 1930s. Alternatively, and not mutually exclusively, susceptible eelgrass genotypes were eliminated from the populations in the 1930s, resulting in populations resistant to the pathogen L. zosterae. Hence, to which extent the result observed here can be generalized or are an attribute to the specific isolated L. zosterae phylotypes in this study remains open with respect to a broader sampling of eelgrass and L. zosterae diversity. It has been shown, that Labyrinthula sp. isolates including L. zosterae, even if similar in their 18S genotype, can differ in ability to infect eelgrass plants (Martin et al., 2016; Trevathan-Tackett et al., 2018). In order
to uncover the nature of eelgrass and L. zosterae interaction we need to go further and investigate genetic diversity and connectivity in combination with pathogenicity and virulence assays and genome sequences from diverse isolates sampled in the North Atlantic region. Studies should also address possible positive symbiotic interactions such as an alleviation of eelgrass nutrient limitation owing to the presence ofL. zosterae (Brakel et al., 2017).
CONCLUSION
To the best of our knowledge, this is the first controlled infection study that used naive plants raised from seeds and a thorough quantification using RT-qPCR to control sham infection, as well as the progression ofL. zosterae in planta, in combination with three fully orthogonal stressors. Our experiments suggest that contemporary L. zosterae isolates in the south-western Baltic do not represent an immediate risk for eelgrass meadows even under stressful condition, with the exception that under chronic light stress we cannot exclude that lesion spread might exceed leaf growth rates. To the contrary, under the warming and desalination scenario predicted for the Baltic Sea, L. zosterae infectivity and virulence seems to be disfavored compared to present day performance within its plant host. However, other L. zosterae genotypes might elicit very different responses to the one isolated in sympatry with eelgrass from the Baltic Sea.
Although its full-length 18S rDNA sequence corresponds 100%
to the strain deposited in Genbank, which in turn is very close to a virulent strain from North America (Bockelmann et al., 2012), the repertoire of functional genes including virulence factors may be very different even among isolates with the same 18S genotype.
Thus, the infectivity and virulence of otherL. zosteraegenotypes and otherLabyrinthulaspp. is a major research gap and should be assessed in future studies. Likewise, the rapid evolution of microparasites such as L. zosterae, possibly favored by short generation time, as well as the ability of host switching, or the dispersal of virulent allopatric strains needs more study. These processes might quickly generate local or even more widespread eelgrass epidemics. Given the recent role of seagrass beds as one prime target for blue carbon approaches (Duarte, 2017), these processes urgently need further study.
DATA AVAILABILITY
The datasets generated and analyzed for this study can be found in the data repository PANGAEA under doi https://doi.pangaea.
de/10.1594/PANGAEA.897188.
AUTHOR CONTRIBUTIONS
TR, JB, and A-CB designed the study. JB conducted the experiments and collected and analyzed the data. SJ-T provided the measurements on Z. marina defense capacity. All authors discussed and interpreted the results. TR and JB wrote the manuscript with editorial input from A-CB and SJ-T.
fmars-06-00268 May 23, 2019 Time: 16:51 # 12
Brakel et al. Modulation of the Eelgrass –Labyrinthula zosteraeInteraction
FUNDING
This research received funding from the State Agency for Agriculture, Rural Development and Nature Conservation Schleswig-Holstein (LLUR). JB was funded through “Deutsche Bundesstiftung Umwelt" (DBU) and SJ-T was funded by the Swedish Research Council FORMAS.
ACKNOWLEDGMENTS
We would like to thank Hanna Schade, Zuzanna Zagrodzka, Ricarda Christ, and Merle Drechsel for their
support at different stages during the experiment. We further thank Diana Gill for supporting the study by advice on all laboratory analysis; Thomas Hansen for providing access to the photometer for the carbohydrate measurements; and Jeanine L. Olsen for critical discussions of the results.
SUPPLEMENTARY MATERIAL
The Supplementary Material for this article can be found online at: https://www.frontiersin.org/articles/10.3389/fmars.
2019.00268/full#supplementary-material
REFERENCES
Araújo, M. B., and Luoto, M. (2007). The importance of biotic interactions for modelling species distributions under climate change.Glob. Ecol. Biogeogr.16, 743–753. doi: 10.1111/j.1466-8238.2007.00359.x
Bally, M., and Garrabou, J. (2007). Thermodependent bacterial pathogens and mass mortalities in temperate benthic communities: a new case of emerging disease linked to climate change.Glob. Change Biol.13, 2078–2088. doi: 10.1111/j.1365- 2486.2007.01423.x
Bates, D., Mächler, M., Bolker, B., and Walker, S. (2014). Fitting linear mixed- Effects models using lme4.arXiv
Bergmann, N., Fricke, B., Schmidt, M. C., Tams, V., Beining, K., Schwitte, H., et al. (2011). A quantitative real-time PCR assay for the seagrass pathogen Labyrinthula zosterae.Mol. Ecol. Res.11, 1076–1081. doi: 10.1111/j.1755-0998.
2011.03051.x
Bishop, N., Martin, D., and Ross, C. (2017). Effects of multi-stress exposure on the infection dynamics of aLabyrinthulasp.-turtle grasspathosystem.Mar. Ecol.
Prog. Ser.581, 119–133. doi: 10.3354/meps12318
Bockelmann, A.-C., Beining, K., and Reusch, T. B. H. (2012). Widespread occurrence of endophyticLabyrinthula spp. in northern European eelgrass Zostera marina beds. Mar. Ecol. Prog. Ser. 445, 109–116. doi: 10.3354/
meps09398
Bockelmann, A. C., Tams, V., Ploog, J., Schubert, P. R., and Reusch, T. B. (2013).
Quantitative PCR reveals strong spatial and temporal variation of the wasting disease pathogen,Labyrinthula zosteraein northern european eelgrass (Zostera marina) beds.PLoS One8:e62169. doi: 10.1371/journal.pone.0062169 Brakel, J., Reusch, T. B. H., and Bockelmann, A. (2017). Moderate virulence
caused by the protistLabyrinthula zosteraein ecosystem foundation species Zostera marinaunder nutrient limitation.Mar. Ecol. Prog. Ser.571, 97–108.
doi: 10.3354/meps12104
Brakel, J., Werner, F. J., Tams, V., Reusch, T. B. H., and Bockelmann, A. C. (2014).
Current EuropeanLabyrinthula zosteraeare not virulent and modulate seagrass (Zostera marina) defense gene expression.PLoS One9:e92448. doi: 10.1371/
journal.pone.0092448
Burdick, D. M., Short, F. T., and Wolf, J. (1993). An index to assess and monitor the progression of wasting disease in eelgrassZostera marina.Mar. Ecol. Prog.
Ser.94, 83–83.
Burge, C. A., Kim, C. J. S., Lyles, J. M., and Harvell, C. D. (2013). Special issue oceans and humans health: the ecology of marine opportunists.Microb. Ecol.
65, 869–879. doi: 10.1007/s00248-013-0190-7
Costanza, R. D., Arge, R., de Groot, R., Farber, S., Grasso, M., Hannon, B., et al.
(1998). The value of the world’s ecosystem services and natural capital.Nature 387, 253–260. doi: 10.1038/387253a0
Cullen-Unsworth, L. C., Nordlund, L. M., Paddock, J., Baker, S., McKenzie, L. J., Unsworth, R. K., et al. (2014). Seagrass meadows globally as a coupled social- ecological system: implications for human wellbeing. Mar. Pollut. Bull.83, 387–397. doi: 10.1016/j.marpolbul.2013.06.001
Dawkins, P., Eisenlord, M., Yoshioka, R., Fiorenza, E., Fruchter, S., Giammona, F., et al. (2018). Environment, dosage, and pathogen isolate moderate virulence in eelgrass wasting disease.Dis. Aquat. Organ.130, 51–63. doi: 10.3354/dao03263
Den Hartog, C. (1987). “Wasting disease” and other dynamic phenomena in Zosterabeds.Aquat. Bot.27, 3–14. doi: 10.1016/0304-3770(87)90082-9 Duarte, B., Martins, I., Rosa, R., Matos, A. R., Roleda, M. Y., Reusch, T. B. H., et al.
(2018). Climate change impacts on seagrass meadows and macroalgal forests:
an integrative perspective on acclimation and adaptation potential.Front. Mar.
Sci.5:190.
Duarte, C. M. (2017). Reviews and syntheses: hidden forests, the role of vegetated coastal habitats in the ocean carbon budget.Biogeosciences14, 301–310. doi:
10.5194/bg-14-301-2017
Giesen, W. B. J. T., Katwljk, M. M., and Van Den Hartog, C. (1990). Temperature, salinity, insolation and wasting disease of eelgrass (Zostera marinaL.) in the dutch wadden sea in the 1930’s.J. Sea Res.25, 395–404. doi: 10.1016/0077- 7579(90)90047-k
Harvell, C. D., Kim, K., Burkholder, J. M., Colwell, R. R., Epstein, P. R., Grimes, D. J., et al. (1999). Emerging marine disease–climate links and anthropogenic factors.Science285, 1505–1510. doi: 10.1126/science.285.5433.
1505
Harvell, C. D. E., Mitchell, C., Ward, J. R., Altizer, S., Dobson, A. P., Ostfeld, R. S., et al. (2002). Climate warming and disease risks for terrestrial and marine biota.Science296, 2158–2162. doi: 10.1126/science.106 3699
Hiebenthal, C., Philipp, E. E. R., Eisenhauer, A., and Wahl, M. (2013). Effects of seawater pCO2 and temperature on shell growth, shell stability, condition and cellular stress of western baltic seaMytilus edulis(L.) andArctica islandica(L.).
Mar. Biol.160, 2073–2087. doi: 10.1007/s00227-012-2080-9
Hily, C., Raffin, C., Brun, A., and Den Hartog, C. (2002). Spatio-temporal variability of wasting disease symptoms in eelgrass meadows of brittany (France).Aquat.
Bot.72, 37–53. doi: 10.1016/S0304-3770(01)00195-4
Huber, S. C., and Israel, D. W. (1982). Biochemical basis for partitioning of photosynthetically fixed carbon between starch and sucrose in soybean (Glycine maxmerr.) leaves.Plant Physiol.69, 691–696. doi: 10.1104/pp.69.3.691 IPCC (2014). “Climate Change 2014: Synthesis Report”, inContribution of Working
Groups I, II and III to the Fifth Assessment Report of the Intergovernmental Panel on Climate Change, eds R. K. Pachauri, and L. A. Meyer (Geneva, Switzerland:
Core Writing Team), 151. Availableat:https://epic.awi.de/id/eprint/37530/1/
IPCC_AR5_SYR_Final.pdf
Jakobsson-Thor, S., Toth, G. B., Brakel, J., Bockelmann, A. C., and Pavia, H. (2018).
Seagrass wasting disease varies with salinity and depth in naturalZostera marina populations.Mar. Ecol. Prog. Ser.587, 105–115. doi: 10.3354/meps12406 Jakobsson-Thor, S., Toth, G. B., and Pavia, H. (2019). Seagrass wasting disease
along a naturally occurring salinity gradient.Mar. Ecol. Prog. Ser.614, 67–77.
doi: 10.3354/meps12911
Kenward, M. G., and Roger, J. H. (1997). Small sample inference for fixed effects from restricted maximum likelihood.Biometrics53, 983–997.
Lafferty, K. D., Porter, J. W., and Ford, S. E. (2004). Are diseases increasing in the ocean?Annu. Rev. Ecol. Evol. Syst.35, 31–54. doi: 10.1146/annurev.ecolsys.35.
021103.105704
Martin, A. C. (1954). “A clue to the eelgrass mystery,” in Proceedings of the Transactions of the North American Wildlife Conference, Washington, DC, 441–449.

![TABLE 1 | Generalized linear mixed model: effects of two salinity levels, two light levels, and two temperature levels on Labyrinthula zosterae abundance, quantified as cells mg dry weight leaf tissue −1 and lesion coverage [%] of leaves 2 and 8 days post](https://thumb-eu.123doks.com/thumbv2/1library_info/5294500.1677223/7.892.74.827.126.636/generalized-salinity-temperature-labyrinthula-zosterae-abundance-quantified-coverage.webp)