GXL2SVG: Domain-Specific Graph Layout
Florian Schricker Volker Riediger
Universität Koblenz-Landau Institute for Software-Technology P. O. Box 20 16 02, D-56016 Koblenz (eyerq|riediger)@uni-koblenz.de
Andreas Winter
Johannes Gutenberg-Universität Mainz Institute for Computer Science Staudingerweg 9, D-55128 Mainz
winter@uni-mainz.de
Abstract
GXL provides an international standard to exchange graphs and their according schemas, but without offering means to visualize these structures. This paper presents a declarative approach to specify a graph layout by referring to the graphs schema. Us- ing GReQL graph querying technology, the resulting display of graph elements can be influenced by various graph properties.
The graph visualizer GXL2SVG uses standard graph layout ser- vices and exports graphs as SVG documents.
1 Introduction
Graphs are widely used to represent software systems in software engineering. They provide a well defined the mathematical basis to reason on program structures. Anal- ysis of graph data structures can be done efficiently, and visualizations of graphs are easily understood by various stakeholders in the software development process.
Adequate visualization of graphs strongly depends on the modelling domain the graph is applied in and is often dependent on the information in the graph and the graph structure itself. Using the standardized GXL Graph Ex- change Language[4], the domain specific structure of the graph is represented by GXL schemas. Domain-specific layout of graphs can be specified with respect to these schemas. Graph properties might also influence the lay- out of graphs. For example, CodeCrawler [1] uses colors, shapes, and sizes of nodes to represent metrics in syntax graphs. All of these layout parameters can be calculated using graph queries[7].
In this paper, we present an approach to specify the layout of graphs with respect to their graph schemas and graph properties. The calculation of graph properties fol- lows the GReQL graph querying approach [6]. The graph visualizer GXL2SVG [8] imports GXL graphs and a layout specification referring to the appropriate graph schema.
Using the layout facilities provided by the GraphViz library[3], GXL2SVG exports domain specific graph visu- alizations as Scalable Vector Graphics (SVG)[10].
v1: EntityType name : Entity abstract : 1
v2: RelationshipType name : Relationship v3: BasicDomain
name : INTEGER v5: BasicDomain
name : STRING v6: BasicDomain
name : BOOL
v7: EntityType name : Junction abstract : 0 v9: Attribute
name : name v11: Attribute name : isRoundAbout
v10: EntityType name : Way abstract : 1 v12: Attribute name : name v14: Attribute
name : length
v13: EntityType name : Street
abstract : 0
v15: EntityType name : Footpath abstract : 0
v8: RelationshipType
name : hasAsOrigin v17: RelationshipType name : hasAsTarget goesTo
comesFrom
hasDomain hasDomain
hasAttribute hasAttribute eIsA hasDomain
hasDomain
hasAttribute hasAttribute eIsA
eIsA eIsA
eIsA eIsA
rIsA
comesFrom comesFrom goesTo rIsA goesTo
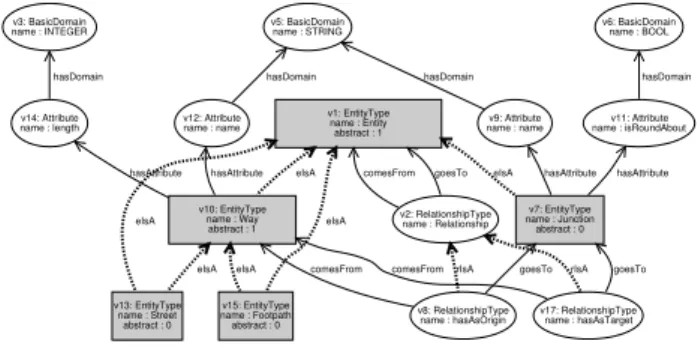
Figure 1: An example graph
2 GXL2SVG Layout Features
The following section introduces some of the layout fea- tures provided by GXL2SVG. Fig. 1 shows a small example graph. Most nodes are represented by ellipses with textual information on node types and names, some of the nodes are rendered as grey rectangles with different content.
GXL2SVG uses an XML language for the specification of graph layout properties. The visualization of the ellip- tical nodes in Fig.1 is specified in Fig. 2. Lines 5 and 6 define the shape, and lines 8-11 specify the node labels consisting of certain literal strings and graph attribute val- ues.
1 <GSIFunctionApplication
2 function="VertexLayoutProperties">
3 <Result><Set>
4 <Tuple>
5 <Name>VertexStyle</Name>
6 <GreqlText>’ellipse’</GreqlText></Tuple>
7 <Tuple>
8 <Name>Label</Name>
9 <GreqlText>USING v: ’v’ + vertexId(v)
10 + ’: ’ + typeName(v) + ’\n name : ’
11 + v.name</GreqlText></Tuple>
12 </Set></Result>
13 </GSIFunctionApplication>
Figure 2: Layout specification for ellipse nodes Fig. 3 shows the layout specification for the rectangu- lar nodes. This specification only holds forEntityType- nodes (line 4). Graphs with nodes to be visualized with this style have to match a schema containingEntityType- nodes. Shape (rectangle) and background color (172 = grey) refering to GXL2SVG’sdefaultcolor palette are de- fined in lines 6-12. The GReQL-Query in lines 15-16 cal- culates the width of each rectangle depicting aEntityType- nodevdepending on the number of incomming edges (in- Degree(v)).
Analogously to the layout of the nodes, the layout of edges is specified. Fig. 1 uses thick dotted and thin solid edges. The placement of the nodes follows a hierarchical layout approach suitable for tree-like structures [9].
GXL2SVG offers means to manipulate graph layout on three levels. Global properties deal with the general layout of all nodes and edges, independent of specific structures or attribute values. Schema-related properties focus on the visualization on graph elements of certain node and edges types specified in the schema. Finally, instance-related properties determine the illustration of a specific nodes or edges. The more specialized levels overwrites the property values of the more general levels.
Three general graph layout approaches – hierarchi- cal, force-directed, and radial [2] – are supported by
1 <GSIFunctionApplication
2 function="VertexLayoutProperties">
3 <Parameter>
4 <TypeId>EntityType</TypeId></Parameter>
5 <Result><Set>
6 <Tuple>
7 <Name>VertexStyle</Name>
8 <GreqlText>’rectangle’</GreqlText></Tuple>
9 <Tuple>
10 <Name>BackgroundColor</Name>
11 <GreqlText>
12 TUP(’default’,172)</GreqlText></Tuple>
13 <Tuple>
14 <Name>Width</Name>
15 <GreqlText>USING v:
16 inDegree{}(v) * 20 + 50</GreqlText></Tuple>
17 . . .
18 </Set></Result>
19 </GSIFunctionApplication>
Figure 3: Layout specification forEntityType-nodes GXL2SVG, so far. Additionally, the manipulation of prop- erties like size, color, shape, line style, edge end sym- bols, node and edge labels, fonts, fontsizes etc., which are not covered by the general layout algorithm itself, can be defined in GXL2SVG layout specifications. All layout properties have distinctive names and an appropriate value.
The value is always computed by a GReQL query. Such queries can easily gather information which is spread over the complete graph. Thus, each layout porperty value can depend on arbitrary graph properties.
Junction isRoundAbout : BOOL
name : STRING
Way length : INTEGER
name : STRING
Street Footpath
hasAsOrigin hasAsTarget
Figure 4: Graph from Fig: 1 layouted as class diagram Fig. 4 shows an example of the power and expressive- ness of GXL2SVG layouts. The graph in Fig. 1 is de- picted in the domain of class diagrams using an UML- like visualization style. Information displayed in the class nodes is collected from various surrounding EntityType, Attribute, and Domain nodes. Different end symbols of edges distinguish generalization from association edges, whereas different shades help telling the abstract class (Way) from concrete ones. Graph layout follows a force directed approach[5].
Using the UML related domain specific layout in Fig. 4 provides a much easier understanding of the graph in Fig. 1. It represents a partial schema for city maps.
3 Implementation
GXL2SVG’s core functionality is implemented as a C++
library. The main objective in development was separation of graph representation, layout specification, output gener- ation, and graph layout algorithm.
LayoutSpec LayoutGraph Writer
Interface for visualizers
gxl2svg library GXL2SVG
GV_LayoutGraph SVGWriter Interface for
layout algorithms
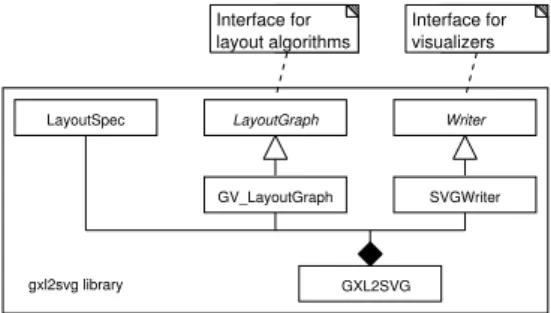
Figure 5: GXL2SVG library structure
This resulted in the modular design shown in fig. 5, where the layout algorithm is only used to compute po- sitions and sizes of nodes and the routing of edges. This results in a specific layout graph which is then rendered by an output writer into the final destination format.
4 Conclusion
GXL2SVG provides a declarative specification of graph layout. By referring to the graph schema, these layout specifications provide domain specific rendering of graphs.
GReQL queries are used to influence the graph layout by arbitrary graph properties.
The approach presented in this paper is based on stan- dardized open formats like GXL and SVG. Unless its cur- rent implementation only uses GraphViz layout services, the implementation can easily be extended and optimized by other graph layout algorithms.
Further work will supply a predefined set of domain specific layout specifications and offer an interactive user interface to support the definition of layouts by extending graph schemas.
References
[1] S. Demeyer, S. Ducasse, and M. Lanza. A Hybrid Reverse Engi- neering Approach Combining metrics and program visualization.
In 6th Working Conference on Reverse Engineering. IEEE Com- puter Society, Los Alamitos, 175–186. 1999.
[2] G. Di Battista, P. Eades, R. Tamassia, and I. G. Tollis. Graph Drawing, Algorithms for the Vizualization of Graphs. Prentice Hall, Upper Saddle River, 1999.
[3] GraphViz - Graph Visualization Software. http://www.
graphiz.org, (30.03.2006).
[4] R. C. Holt, A. Schürr, S. Elliott Sim, and A. Winter. GXL: A Graph-Based Standard Exchange Format for Reengineering. Sci- ence of Computer Programming, 60(2):149–170, April 2006.
[5] T. Kamada and S. Kawai. An Algorithm for Drawing General Un- directed Graphs. Information Processing Letters, 31:7–15, 1989.
[6] M. Kamp and B. Kullbach. GReQL - Eine Anfragesprache für das GUPRO–Repository, Sprachbeschreibung. Projektbericht 8/2001, Universität Koblenz-Landau, August 2001.
[7] B. Kullbach and A. Winter. Querying as an Enabling Technology in Software Reengineering. In P. Nesi and C. Verhoef, ed. 3nd Eu- ropean Conference on Software Maintenance and Reengineering.
IEEE Computer Society, Los Alamitos, 42–50. 1999.
[8] F. Schricker. GXL2SVG - Visualisierung von Graphen in SVG.
Studienarbeit, Universität Koblenz-Landau, Fachbereich Infor- matik, Koblenz, Dezember 2005.
[9] K. Sugiyama, S. Tagawa, and T. Toda. Methods for Visual Under- standing of Hierarchical Systems. IEEE Transactions on Systems, Man, and Cybernetics, 11(2):109–125, 1981.
[10] Scalable Vector Graphics (SVG) 1.1 Specification. http://
www.w3.org/TR/2003/REC-SVG11-20030114/, 14 Jan-
uary 2003.