See discussions, stats, and author profiles for this publication at: https://www.researchgate.net/publication/333731401
Deep hydrous mantle reservoir provides evidence for crustal recycling before 3.3 billion years ago
Preprint · June 2019
DOI: 10.13140/RG.2.2.15896.44801
CITATIONS
0
READS
284 9 authors, including:
Some of the authors of this publication are also working on these related projects:
Project Hotspot: The Snake River Plain Scientific Drilling ProjectView project
Heterogeneity of the Earth mantleView project Alexander V Sobolev
Université Grenoble Alpes 250PUBLICATIONS 8,532CITATIONS
SEE PROFILE
Evgeny Asafov GEOKHI RAS
5PUBLICATIONS 68CITATIONS SEE PROFILE
Nicholas Arndt
University Joseph Fourier - Grenoble 1 335PUBLICATIONS 15,113CITATIONS
SEE PROFILE
Gary Byerly
Louisiana State University 130PUBLICATIONS 3,871CITATIONS
SEE PROFILE
Deep hydrous mantle reservoir provides evidence for crustal
1
recycling before 3.3 billion years ago
2
3 4
Alexander V. Sobolev1,2, Evgeny V. Asafov2, Andrey A. Gurenko3, Nicholas T. Arndt2, Valentina 5
G. Batanova1,2, Maxim V. Portnyagin2,4, Dieter Garbe-Schönberg5, Allan H. Wilson6 and Gary R.
6
Byerly7 7
1 Université Grenoble Alpes, Institute Science de la Terre (ISTerre), CNRS, F-38041 Grenoble, France.
8
2 Vernadsky Institute of Geochemistry and Analytical Chemistry, Russian Academy of Sciences, 9
Kosygina str. 19, Moscow 119991, Russia.
10
3 Centre de Recherches Pétrographiques et Géochimiques (CRPG), UMR 7358, Université de Lorraine, 11
54501 Vandœuvre-lès-Nancy, France.
12
4 GEOMAR Helmholtz Centre for Ocean Research Kiel, Wischhofstrasse 1-3, 24148 Kiel, Germany.
13
5 CAU Kiel University, Institute of Geosciences, Ludewig-Meyn-Strasse 10, 24118 Kiel, Germany.
14
6 School of Geosciences, University of the Witwatersrand, Johannesburg 2050, South Africa 15
7 Department of Geology and Geophysics, Louisiana State University, Baton Rouge, Louisiana 70803, 16
USA.
17 18
First paragraph 262 words, main text 1868 words, 4 figures, 37 references.
19 20 21
H2O strongly influences physical properties of the mantle and its ability to melt or convect 22
and can trace recycling of surface reservoirs down to the deep mantle1,2. This makes 23
knowledge of water content in the Earth's interior and its evolution through time crucial to 24
understanding global geodynamics. Komatiites (MgO-rich ultramafic magmas) result from 25
high-degree mantle melting at high pressures3 and thus are excellent probes of H2O contents 26
in the deep mantle. A significant excess of H2O over elements of similar geochemical 27
behavior during mantle melting (e.g. Ce) was recently found in melt inclusions in the most 28
Mg-rich olivine in 2.7 Ga old komatiites from Canada4 and Zimbabwe5. These data were 29
taken as evidence for a deep hydrated mantle reservoir, probably the transition zone, in the 30
Neoarchean time. In this paper we confirm the mantle source of this H2O by measurement 31
of deuterium to hydrogen ratios in these melt inclusions and present similar data for 3.3 Ga 32
old komatiites from the Barberton Greenstone Belt. Using hydrogen isotopes, we show that 33
the mantle sources of these melts contained excess H2O which implies that a deep mantle 34
hydrated reservoir has been present in the Earth's interior at least since the Paleoarchean.
35
The reconstructed initial hydrogen isotope composition of komatiites is significantly more 36
depleted in deuterium than all surface reservoirs and typical mantle but resembles that in 37
dehydrated subducted slabs. Together with a significant excess of chlorine and a temporal 38
trend of Pb/Ce in the mantle sources of komatiites, these results argue that lithosphere 39
recycling into the deep mantle, arguably via subduction, started before 3.3 Ga.
40 41 42
A common way to determine H2O concentrations in the Earth's mantle is to measure them 43
in submarine basaltic glasses (quenched and differentiated melts of mantle origin) or in glassy melt 44
inclusions in early crystallizing minerals of these lavas1,2,6. Because H2O and Ce partition in a 45
similar way between minerals and melt, the H2O/Ce ratio is independent of both fractionation and 46
degree of mantle melting and represents that of the mantle source. Most glasses from mantle 47
derived basalts at mid-ocean ridges and ocean islands show nearly constant H2O/Ce = 200±100 48
implying a relatively narrow range of H2O concentrations in the modern mantle (Fig. 1a). Magmas 49
originating over subduction zones gain H2O through dehydration of the subducted slab and have 50
higher H2O/Ce ratios (Fig 1a). The H2O excess in these magmas positively correlates with the 51
excess of elements such as Ba and Rb that are concentrated in slab-derived hydrous fluids.
52 53
Melt inclusions in olivine from komatiites of different ages have Ba/Nb ratios similar to 54
Bulk Silicate Earth (BSE) but much higher H2O/Ce ratios (Fig 1a). Our previous study of melt 55
inclusions in ca. 2.7 billion-year-old komatiites from the Abitibi4 and Belingwe5 greenstone belts 56
showed that their primary melts contained moderate water contents (0.2 to 0.6 wt% H2O), but very 57
large excesses of H2O over Ce. This feature was interpreted to indicate the presence of excessive 58
H2O in their mantle sources, possibly entrained into the komatiite source as it passed through the 59
transition zone4. However, some melt inclusions in olivine also show an excess of H2O over Ce 60
that was thought to originate from diffusive gain of H through the host olivine when the external 61
pressure of H2O exceeded that inside the inclusion7-9. Such inclusions are identified in figure 1a.
62
However, the much more melt inclusions display significant H2O depletion (H2O/Ce ratios lower 63
than for syngeneic submarine glasses on Fig 1a) due to diffusive loss of H through the host olivine, 64
or by degassing of melt prior to entrapment10,11. 65
66
Hydrogen isotopes are frequently used to trace the source of H2O in mantle derived 67
magmas because of apparent disequilibria between deuterium enriched surface reservoirs and 68
deuterium depleted mantle6. They also efficiently record post-entrapment hydrogen exchange 69
between melt inclusions and external magma through host minerals as this process changes the 70
primordial H isotopic composition of melt inclusions because hydrogen (1H) diffuses through 71
olivine much faster than deuterium (D) changing dD (the deviation in the ratio of D/1H in per mille 72
relative to the standard ratio in modern seawater, VSMOW) in melt inclusions10-12 and also because 73
1H and D fractionate between melt and fluid11. The latter processes produce a negative correlation 74
between the dD and concentration of H2O10,11. Despite these changes, hydrogen isotopes remain 75
sensitive tracers of the H2O source - mantle, surface reservoirs or recycled material because their 76
fractionation between minerals and fluid at low and medium temperatures6. 77
78
In this paper, we report the results of an investigation of melt inclusions in high-Mg olivine 79
phenocrysts in 3.3 billion-year-old komatiites from the Weltevreden Formation in the Barberton 80
greenstone belt (S. Africa)13,14. We used melt inclusions in olivine rather than bulk rock 81
compositions because these micro portions of melt were isolated by the host mineral and preserve 82
original contents of volatile and other highly mobile elements as shown before4,5 and later in the 83
present study. We analyzed homogenized melt inclusions by electron microprobe for major and 84
minor elements, by laser ablation ICP-MS for trace elements and by ion probe for H2O contents 85
(see METHODS). Hydrogen isotopes were analyzed by ion probe in selected melt inclusions (see 86
METHODS). Here we use these data to constrain the amount and origin of H2O in the mantle 87
sources of these komatiites. Results are presented in Supplementary Tables 1-3.
88 89
H2O/Ce ratios of melt inclusions display significant ranges for the same composition of the 90
host olivine (Fig 1b), a feature we attribute to H2O loss or gain due to diffusion of H through 91
olivine or melt degassing prior to entrapment. The maximum H2O/Ce ratio in each sample of 92
Weltevreden komatiites reversely correlates with the Fo content of host olivine. Because olivine 93
fractionation does not change the H2O/Ce ratio, this suggests assimilation of H2O-enriched 94
material during crystallization and emplacement of the Weltevreden komatiite.
95 96
Most measured hydrogen isotope compositions (dD) of melt inclusions in Weltevreden and 97
Abitibi komatiites show very high values that do not match any terrestrial reservoirs (Fig 2). In the 98
Weltevreden komatiite samples, dD increases with decreasing H2O concentrations along tight 99
trajectories like those predicted for diffusional H loss10. Moreover, in samples 1521 and 1523, dD 100
correlates with the inclusion size (Extended data Fig 4). In Belingwe and sample 1521 from 101
Weltevreden komatiites, the dD values of the melt inclusions with the highest H2O contents are 102
similar to that of Archean mantle (Fig 2). None of the measured dD values match the highly 103
negative numbers expected for melt inclusions that gained H by diffusion (Fig 2). These features 104
preclude diffusive gain of H2O in the studied melt inclusions, and instead suggest partial diffusive 105
loss of H2O from them. This result is in accord with that of our earlier study of melt inclusions in 106
olivines from Abitibi komatiites4 in which we used Sc/Y olivine-melt geothermometry to estimate 107
the depression of crystallization temperatures caused by the presence of H2O.
108 109
The original H isotope composition of the trapped melts was calculated using a model of 110
diffusional loss of hydrogen10. In our calculations, we used estimated initial H2O contents of the 111
melt inclusions, their chemical compositions and size. The initial H2O contents were inferred 112
assuming that the maximum H2O/Al2O3 ratios in olivine-hosted melt inclusions in each sample 113
represents the minimum original amount of H2O (see METHODS for further details). The 114
calculated mean isotopic compositions of hydrogen (Fig. 2) for Belingwe and Abitibi komatiites 115
and sample 1521 from Weltevreden are depleted in deuterium (dD< -120‰), and have 116
compositions that differ significantly from any surface H2O reservoirs: in the latter, dD values are 117
thought to be close to 0 or slightly negative6. In contrast, the reconstructed dD values of melt 118
inclusions from samples 1523 and 1522 from Weltevreden are more enriched in deuterium and 119
their dD values are shifted towards those of hydrated rocks at the Earth's surface (sediments, 120
serpentinites), supporting their surface contamination proposed earlier based on evolution of 121
H2O/Ce ratio (Fig 1b).
122 123
Our new data, as well as those reported earlier4,5, rule out shallow contamination as a source 124
for H2O excess in primitive komatiite melts from Abitibi, Belingwe and Weltevreden (except for 125
samples 1523 and 1522). Also, a primary source of the excess H2O has been confirmed for 126
Gorgona komatiites15. None of these melts show the geochemical features of magmas from 127
subduction zones but are relatively enriched in chlorine (Fig 3). This suggests the persistence of a 128
deep hydrated mantle source from the Paleoarchean to at least the Tertiary (Fig 4a).
129 130
According to recent experimental data on the solidus temperature of fertile peridotite16, 131
mantle plumes with potential temperatures over 1630oC, as is the case for the sources of Abitibi 132
and Belingwe komatiites5, must have been partially molten in the mantle transition zone. The 133
composition of the primary melt for Weltevreden komatiites, calculated assuming equilibrium with 134
the most Mg-rich olivine (Fo 96, ref13), contains over 31 wt% MgO. This indicates an eruption 135
temperature of 1600oC (ca. 0.2 wt% H2O) and a potential temperature over 1800oC [ref]17. The 136
Weltevreden komatiites are more depleted in moderately incompatible elements than other 137
komatiites (Fig 3) and are thought to have originated by melting of a refractory source after the 138
extraction of partial melts in the plume, which also was partially molten in the mantle transitional 139
zone18. Ringwoodite and wadsleyite in the mantle transition zone have high storage capacities for 140
H2O and Cl19-21, and a significant amount of water appears to be present at these depths22,23. These 141
observations support an idea that water and possibly chlorine in these komatiites were entrained 142
into their plume sources during their passage through the hydrated transition zone4. The presence 143
of partial melt in the plume at the transition zone depths is thought to be essential for the 144
entrainment of volatiles4. The absence of H2O excess in the magmas from classical Phanerozoic 145
mantle plumes like Hawaii or Iceland, which should also pass through the hydrated transition zone, 146
is attributed4 to their lower temperature, which was not sufficiently high to produce partial melts 147
at transition zone depths.
148 149
The eruption temperature of Gorgona komatiite24, calculated assuming an initial H2O 150
content of 0.6 and 17 wt% MgO in the primary melt equilibrium with the most Fo-rich olivine 151
(Fo91.5) is only about 1360oC. On the other hand, the eruption temperatures of Gorgona picrites, 152
estimated from olivine compositions up to Fo93.6, and those of the picrites from Tortugal in 153
another part of the Caribbean large igneous province, are higher (up to 1570°C) and very close to 154
those of Archean komatiites25,26. This suggests that parts of the plume that produced the Gorgona 155
and Tortugal picrites were sufficiently hot that they were partially molten too when they passed 156
through the transition zone. In this case, the H2O and chlorine reported in the Gorgona komatiites 157
could have been also derived from a hydrated reservoir in the transition zone.
158
159
The reconstruction of the original isotopic compositions of H in the trapped melts yields 160
an average dD less than -120‰. This is much more depleted in deuterium than any currently 161
accepted mantle composition (Fig 4b). Such a low dD could, however, correspond to that of a 162
lithospheric slab that was initially altered by seawater and then dehydrated during subduction6,27. 163
This, and the excess of Cl, argue that the H2O and Cl in the transition zone came from reacted 164
seawater that was transported into the deep mantle by partially dehydrated oceanic lithosphere.
165
Additional support of this hypothesis is the temporal trend of Pb/Ce in the mantle sources of 166
komatiites (Fig 4c). The canonical ratio Pb/Ce of mantle derived melts is a sensitive indicator of 167
the segregation of continental crust from the mantle28,29. Furthermore, because continental crust 168
production is a multistage process involving shallow recycling of materials processed at or close 169
to the Earth surface28,29, the complement of this process in the deep mantle requires global 170
recycling of lithosphere down to the core-mantle boundary. As seen from Figure 4c, the deep 171
mantle sources of komatiites mimic the proposed global production of continental crust30 with a 172
highly productive initial stage and a steady-state second stage. In addition, as shown recently31, 173
the relatively low Si contents of 2.7 Ga old Abitibi komatiites suggest elevated carbon contents in 174
their mantle sources. Taken together, these results argue that subduction or other process able to 175
recycle surface materials down to deep mantle operated well before 3.3 Ga in accord with 176
consequences of recent geochemical and geodynamic modelling implying efficient crustal 177
recycling in Hadean and Archean eons32. 178
179
The alternative explanation for the origin of deuterium-depleted mantle was recently 180
proposed based on the data on hydrogen isotope composition of melt inclusions in olivine from ca 181
60 million years old Baffin Island picrites33. These authors suggested the existence of primordial 182
reservoir with low deuterium to hydrogen ratio inherited from the protosolar nebula. However, the 183
reported melt inclusions do not show Cl and H2O excesses typical for studied komatiites and thus 184
likely sampled a different reservoir.
185 186
Acknowledgments 187
We thank S. Krasheninnikov for help in the heating of melt inclusions and V. Magnin for help 188
with the EPMA facility at ISTerre, E. Füri for sharing with us reference synthetic forsterite and 189
potentially H2O-free Suprasil 3002 quartz glass, Clair Bucholz and Veniamin Polyakov for 190
consultations on isotopic effects of hydrogen diffusion in olivine. This study was funded by the 191
Russian Science Foundation grant number 14-17-00491 (to A.V.S.). The analytical work on 192
EPMA facility in ISTerre was covered by Labex OSUG@2020 (Investissements d’avenir—
193
ANR10 LABX56) and Institut Universitaire de France. The costs of SIMS analyses at CRPG, 194
(Nancy, France) were covered by an INSU-CNRS grant to A.V.S. This is CRPG contribution #??.
195
Author Information All data used in this paper will be submitted to the Researchgate 196
(https://www.researchgate.net/profile/Alexander_Sobolev) and GEOROC (http://georoc.mpch- 197
mainz.gwdg.de/georoc/) databases. The authors declare no competing financial interests. Readers 198
are welcome to comment on the online version of the paper. Correspondence and requests for 199
materials should be addressed to A.V.S. (alexander.sobolev@ujf-grenoble.fr).
200 201
Figures captions 202
203
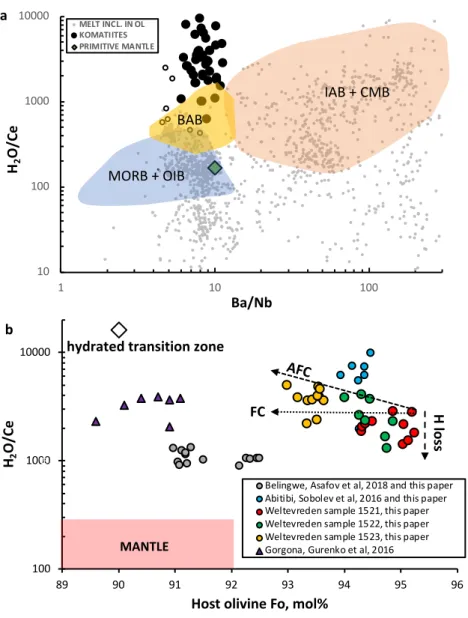
Figure 1. Compositions of glasses and melt inclusions in olivine phenocrysts.
204
a. H2O/Ce and Ba/Nb ratios of melt inclusions in olivine in basalts (small grey dots), komatiites 205
(large filled circles) and glasses (coloured fields) from modern basalts (reference34 and GEOROC 206
database: http://georoc.mpch-mainz.gwdg.de/georoc/) and from komatiites (references4,5,15,24 207
and this study).
208
Coloured fields correspond to submarine glasses of mid-ocean ridge basalts (MORB), ocean island 209
basalts (OIB), back arc basin basalts (BAB), island arc basalts (IAB), and continental margin basalts 210
and andesites (CMB). MORB and OIB form in mid-ocean ridges and intraplate settings while IAB 211
and CMB are directly related to subduction zones, BAB are barely related to subduction zones.
212
Primitive mantle composition after reference35. Specially marked by empty circle are melt 213
inclusions in olivine from basalts with gained H by diffusion through host olivine8,9. 214
b. Compositions of melt inclusions versus Fo content of host olivine for komatiites. Variations of 215
H2O/Ce ratios of inclusions in olivine of the same composition of host are attributed to post- 216
entrapment diffusional H loss. The increase of H2O/Ce with decreasing Fo of host olivine in 217
Weltevreden samples is attributed to fractional crystallization plus wall-rock assimilation (AFC), 218
because olivine fractional crystallization (FC) alone does not change H2O/Ce ratio of the melt. The 219
composition of hydrated transition zone (empty diamond) is estimated from H2O contents of a 220
ringwoodite inclusion in diamond22 and the Ce content of primitive mantle35 assuming olivine 221
Fo90. The composition of mantle (pink field) is from34,35. Errors (2ste) are within symbol size.
222 223
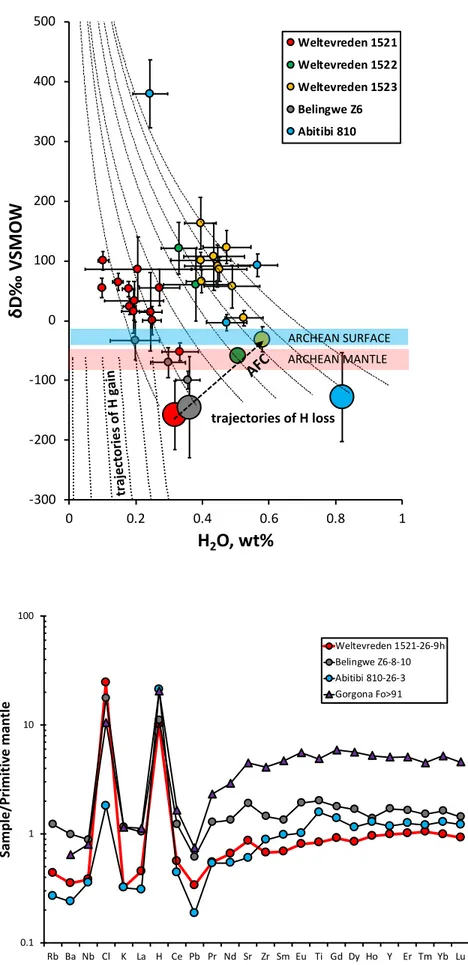
Figure 2. Measured and modelled H2O contents and H isotope compositions of melt inclusions 224
in olivine from komatiites.
225
Small symbols - measured compositions; Larger symbols - initial H2O-δD (‰ VSMOW) in melt 226
inclusions reconstructed using the model of Buchloz et al,(2013) 10 (Methods) and measured 227
data. Error bars correspond to 2 standard errors. Reconstructed compositions for Weltevreden 228
komatiite samples 1522 and 1523 are marked by intermediate-sized symbols because they are 229
likely affected by contamination by surface materials. Dashed and dotted lines correspond to 230
trajectories due to diffusion H loss or gain through the host olivine10. Compositions of Archean 231
mantle and surface reservoirs are from reference 6. 232
233
Figure 3. Primitive mantle normalized patterns of incompatible trace elements in trapped 234
melts in high-Mg olivine phenocrysts from komatiites.
235
Compositions of melt inclusions in olivine Fo>91 from Gorgona komatiite (average of analyses by 236
reference15) and Archean komatiites studied in this paper (Extended data Table 1). Incompatible 237
element concentrations in the primitive mantle are from Hofmann et al, (1988)35; H2O (266 ppm) 238
and Cl (26 ppm) are from Kentrick et al, (2015)34. 239
240 241
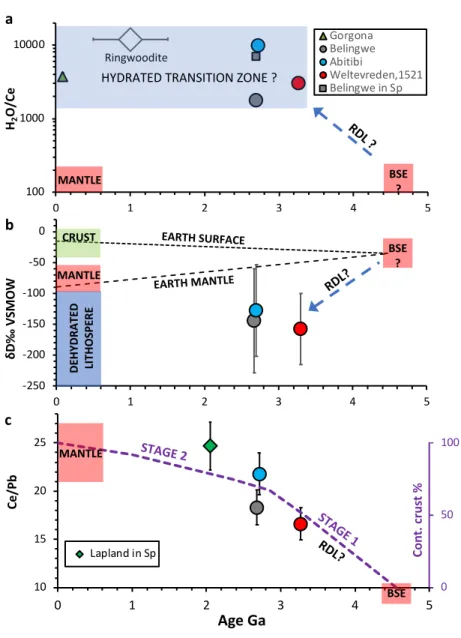
Figure 4. The temporal evolution of the komatiite mantle source composition and other Earth 242
reservoirs.
243
a. Evolution of H2O/Ce ratio in the mantle. The composition of hydrated transition zone is 244
estimated using the H2O content of a ringwoodite inclusion in diamond22, the Ce content of 245
primitive mantle35 (large diamond; assigned an arbitrary age of 1.0 ± 0.5 Ga), and H2O/Ce ratios 246
of melt inclusions in olivine (this paper and references4,5,15) and spinel36 in komatiites. The 247
compositions of Phanerozoic mantle and bulk silicate earth (BSE) are from references34,35. 248
b. Evolution of hydrogen isotope composition of mantle. Compositions of BSE, CRUST, MANTLE 249
and DEHYDRATED LITHOSPHERE and evolution of EARTH SURFACE AND EARTH MANTLE are from 250
reference6. 251
c. Evolution of the Ce/Pb ratio in mantle sources of komatiites and the estimated production rate 252
of continental crust30. BSE composition after35 and Phanerozoic mantle after34. Ce/Pb ratios of 253
melt inclusions of studied komatiites: Weltevreden 1521-26-9h, Abitibi 819-26-23, Belingwe Z6- 254
8-10; Lapland komatiite - calculated average of the least contaminated melt inclusions in spinel, 255
from Hanski and Kamenetsky (2013) 37. 256
All data plotted with 2 standard errors of mean (not seen if they are smaller than symbol size).
257
RDL-stands for Recycling of Dehydrated Lithosphere.
258 259
REFERENCES 260
1 Shaw, A. M. et al. Long-term preservation of slab signatures in the mantle inferred from 261
hydrogen isotopes. Nature Geoscience 5, 224-228, doi:10.1038/ngeo1406 (2012).
262
2 Dixon, J. E. et al. Light Stable Isotopic Compositions of Enriched Mantle Sources:
263
Resolving the Dehydration Paradox. Geochemistry Geophysics Geosystems 18, 3801- 264
3839, doi:10.1002/2016gc006743 (2017).
265
3 Herzberg, C. Depth and degree of melting of komatiites. Journal of Geophysical 266
Research-Solid Earth 97, 4521-4540, doi:10.1029/91jb03066 (1992).
267
4 Sobolev, A. V. et al. Komatiites reveal a hydrous Archaean deep-mantle reservoir.
268
Nature 531, 628-632, doi:10.1038/nature17152 (2016).
269
5 Asafov, E. V. et al. Belingwe komatiites (2.7 Ga) originate from a plume with moderate 270
water content, as inferred from inclusions in olivine. Chemical Geology 478, 39-59, 271
doi:10.1016/j.chemgeo.2017.11.002 (2018).
272
6 Shaw, A. M., Hauri, E. H., Fischer, T. P., Hilton, D. R. & Kelley, K. A. Hydrogen isotopes in 273
Mariana arc melt inclusions: Implications for subduction dehydration and the deep- 274
Earth water cycle. Earth and Planetary Science Letters 275, 138-145, 275
doi:10.1016/j.epsl.2008.08.015 (2008).
276
7 Portnyagin, M., Almeev, R., Matveev, S. & Holtz, F. Experimental evidence for rapid 277
water exchange between melt inclusions in olivine and host magma. Earth and 278
Planetary Science Letters 272, 541-552, doi:10.1016/.j.epsl.2008.05.020 (2008).
279
8 Hartley, M. E., Neave, D. A., Maclennan, J., Edmonds, M. & Thordarson, T. Diffusive 280
over-hydration of olivine-hosted melt inclusions. Earth and Planetary Science Letters 281
425, 168-178, doi:10.1016/j.epsl.2015.06.008 (2015).
282
9 Jackson, M. G. et al. Ultra-depleted melts in olivine-hosted melt inclusions from the 283
Ontong Java Plateau. Chemical Geology 414, 124-137, 284
doi:10.1016/j.chemgeo.2015.08.014 (2015).
285
10 Bucholz, C. E., Gaetani, G. A., Behn, M. D. & Shimizu, N. Post-entrapment modification of 286
volatiles and oxygen fugacity in olivine-hosted melt inclusions. Earth and Planetary 287
Science Letters 374, 145-155, doi:10.1016/j.epsl.2013.05.033 (2013).
288
11 Hauri, E. SIMS analysis of volatiles in silicate glasses, 2: isotopes and abundances in 289
Hawaiian melt inclusions. Chemical Geology 183, 115-141, doi:10.1016/s0009- 290
2541(01)00374-6 (2002).
291
12 Gaetani, G. A., O'Leary, J. A., Shimizu, N., Bucholz, C. E. & Newville, M. Rapid 292
reequilibration of H2O and oxygen fugacity in olivine-hosted melt inclusions. Geology 293
40, 915-918, doi:10.1130/g32992.1 (2012).
294
13 Connolly, B. D. et al. Highly siderophile element systematics of the 3.3 Ga Weltevreden 295
komatiites, South Africa: Implications for early Earth history. Earth and Planetary 296
Science Letters 311, 253-263, doi:10.1016/j.epsl.2011.09.039 (2011).
297
14 Puchtel, I. S., Walker, R. J., Touboul, M., Nisbet, E. G. & Byerly, G. R. Insights into early 298
Earth from the Pt-Re-Os isotope and highly siderophile element abundance systematics 299
of Barberton komatiites. Geochimica Et Cosmochimica Acta 125, 394-413, 300
doi:10.1016/j.gca.2013.10.013 (2014).
301
15 Gurenko, A. A., Kamenetsky, V. S. & Kerr, A. C. Oxygen isotopes and volatile contents of 302
the Gorgona komatiites, Colombia: A confirmation of the deep mantle origin of H2O.
303
Earth and Planetary Science Letters 454, 154-165, doi:10.1016/j.epsl.2016.08.035 304
(2016).
305
16 Andrault, D. et al. Deep and persistent melt layer in the Archaean mantle. Nature 306
Geoscience 11, 139-+, doi:10.1038/s41561-017-0053-9 (2018).
307
17 Herzberg, C. & Asimow, P. D. PRIMELT3 MEGA.XLSM software for primary magma 308
calculation: Peridotite primary magma MgO contents from the liquidus to the solidus.
309
Geochemistry Geophysics Geosystems 16, 563-578, doi:10.1002/2014gc005631 (2015).
310
18 Robin-Popieul, C. C. M. et al. A New Model for Barberton Komatiites: Deep Critical 311
Melting with High Melt Retention. Journal of Petrology 53, 2191-2229, 312
doi:10.1093/petrology/egs042 (2012).
313
19 Bercovici, D. & Karato, S. Whole-mantle convection and the transition-zone water filter.
314
Nature 425, 39-44, doi:10.1038/nature01918 (2003).
315
20 Mibe, K., Orihashi, Y., Nakai, S. & Fujii, T. Element partitioning between transition-zone 316
minerals and ultramafic melt under hydrous conditions. Geophysical Research Letters 317
33, doi:10.1029/2006gl026999 (2006).
318
21 Roberge, M. et al. Is the transition zone a deep reservoir for fluorine? Earth and 319
Planetary Science Letters 429, 25-32, doi:10.1016/j.epsl.2015.07.051 (2015).
320
22 Pearson, D. G. et al. Hydrous mantle transition zone indicated by ringwoodite included 321
within diamond. Nature 507, 221-+, doi:10.1038/nature13080 (2014).
322
23 Tschauner, O. et al. Ice-VII inclusions in diamonds: Evidence for aqueous fluid in Earth's 323
deep mantle. Science 359, 1136-+, doi:10.1126/science.aao3030 (2018).
324
24 Kamenetsky, V. S., Gurenko, A. A. & Kerr, A. C. Composition and temperature of 325
komatiite melts from Gorgona Island, Colombia, constrained from olivine-hosted melt 326
inclusions. Geology 38, 1003-1006, doi:10.1130/g31143.1 (2010).
327
25 Revillon, S., Arndt, N. T., Chauvel, C. & Hallot, E. Geochemical study of ultramafic 328
volcanic and plutonic rocks from Gorgona Island, Colombia: The plumbing system of an 329
oceanic plateau. Journal of Petrology 41, 1127-1153, doi:10.1093/petrology/41.7.1127 330
(2000).
331
26 Trela, J. et al. The hottest lavas of the Phanerozoic and the survival of deep Archaean 332
reservoirs. Nature Geoscience 10, 451-+, doi:10.1038/ngeo2954 (2017).
333
27 Walowski, K. J., Wallace, P. J., Hauri, E. H., Wada, I. & Clynne, M. A. Slab melting beneath 334
the Cascade Arc driven by dehydration of altered oceanic peridotite. Nature Geoscience 335
8, 404-+, doi:10.1038/ngeo2417 (2015).
336
28 Chauvel, C., Goldstein, S. L. & Hofmann, A. W. Hydration and dehydration of oceanic- 337
crust controls Pb evolution in the mantle. Chemical Geology 126, 65-75, 338
doi:10.1016/0009-2541(95)00103-3 (1995).
339
29 Hofmann, A. W. Mantle geochemistry: The message from oceanic volcanism. Nature 340
385, 219-229, doi:10.1038/385219a0 (1997).
341
30 Dhuime, B., Hawkesworth, C. J., Cawood, P. A. & Storey, C. D. A Change in the 342
Geodynamics of Continental Growth 3 Billion Years Ago. Science 335, 1334-1336, 343
doi:10.1126/science.1216066 (2012).
344
31 Herzberg, C. Petrological Evidence from Komatiites for an Early Earth Carbon and Water 345
Cycle. Journal of Petrology 57, 2271-2287, doi:10.1093/petrology/egw055 (2016).
346
32 Rosas, J. C. & Korenaga, J. Rapid crustal growth and efficient crustal recycling in the early 347
Earth: Implications for Hadean and Archean geodynamics. Earth and Planetary Science 348
Letters 494, 42-49, doi:10.1016/j.epsl.2018.04.051 (2018).
349
33 Hallis, L. J. et al. Evidence for primordial water in Earth's deep mantle. Science 350, 795- 350
797, doi:10.1126/science.aac4834 (2015).
351
34 Kendrick, M. A. et al. Seawater cycled throughout Earth's mantle in partially 352
serpentinized lithosphere. Nature Geoscience 10, 222-U297, doi:10.1038/ngeo2902 353
(2017).
354
35 Hofmann, A. W. Chemical differentiation of the Earth: the relationship between mantle, 355
continental crust, and oceanic crust. Earth Planet. Sci. Lett. 90, 297-314 (1988).
356
36 Shimizu, K., Komiya, T., Hirose, K., Shimizu, N. & Maruyama, S. Cr-spinel, an excellent 357
micro-container for retaining primitive melts - implications for a hydrous plume origin 358
for komatiites. Earth and Planetary Science Letters 189, 177-188, doi:10.1016/s0012- 359
821x(01)00359-4 (2001).
360
37 Hanski, E. & Kamenetsky, V. S. Chrome spinel-hosted melt inclusions in Paleoproterozoic 361
primitive volcanic rocks, northern Finland: Evidence for coexistence and mixing of 362
komatiitic and picritic magmas. Chemical Geology 343, 25-37, 363
doi:10.1016/j.chemgeo.2013.02.009 (2013).
364 365
METHODS (1764 words) 366
Samples 367
Weltevreden Formation komatiites. We selected three samples of 3.3 Ga Weltevreden komatiites 368
for this study that came from the well-preserved parts of the cumulate zones of three separate flows 369
(Extended Data Figure 1) of Saw Mill area of the Weltevreden Formation of Barberton Greenstone 370
Belt, South Africa38. These are the massive komatiite cumulates consisting of partially unaltered 371
olivine, spinel and clinopyroxene grains of different size and composition. Details of the samples 372
are as follows:
373
Sample 1521 (Gary’s flow #2) is an olivine cumulate that contains large (up to 2 mm in diameter) 374
partially serpentinized euhedral olivine grains with high-Fo contents (93.5–95.5 mol% Fo). The 375
interstitial groundmass of the rock is made of acicular clinopyroxene (up to 1 mm in diameter), 376
equant or skeletal spinel (up to 100 µm in diameter, Cr-number up to 81 [Cr/(Cr+Fe3++Ti+Al)]
377
and the altered volcanic glass. Sample 1522 (Keena’s flow #1) is an olivine cumulate made of 378
partially serpentinized euhedral olivine grains (1.5 mm in diameter, with a range of olivine 379
compositions – 93.7-95.1 mol% Fo), acicular (up to 0.5 mm in diameter) clinopyroxene, skeletal 380
and to lesser extent equant spinel grains (up to 100µm) and interstitial completely altered volcanic 381
glass. Sample 1523 (Keena’s flow #2) – olivine cumulate consisting of partially serpentinized 382
euhedral olivine grains of different size (mainly 1-1.5 mm, with individual grains up to 2.5 mm in 383
diameter; 93-93.9 mol% Fo). The interstitial groundmass is made of acicular clinopyroxene (up to 384
1 mm in diameter), equant and skeletal spinel crystals (up to 100 µm in diameter, Cr-number 77- 385
82) and completely altered volcanic glass.
386
Abundant partially crystallized melt inclusions (few-200 µm in diameter) composed of glass, 387
olivine, clinopyroxene and spinel occur in the olivine grains (Extended Data Figure 2a).
388
Abitibi and Belingwe Greenstone Belts. Studied samples M810 (Pike Hill) and Z6 (Zimbabwe) 389
are described in references [4] and [5] correspondingly.
390
Analytical methods 391
To study the compositions of minerals and glasses we used the following in situ analytical 392
techniques: electron probe microanalysis (EPMA), secondary ion mass-spectrometry (SIMS) and 393
laser-ablation ICP-MS.
394
EPMA. Melt inclusions, host olivine and spinel were analysed for major and minor elements on 395
a JEOL JXA 8230 microprobe at ISTerre in Grenoble, France using methods and protocols 396
described in ref. [4].
397
SIMS. Hydrogen abundance and D/H ratios of olivine-hosted melt inclusions were analysed by 398
the CAMECA IMS 1280 HR2 ion microprobe at the Centre de Recherches Pétrographiques et 399
Géochimiques (CRPG, Nancy, France). The inclusion-bearing olivine grains recovered from the 400
laboratory heating experiments, mounted in epoxy resin beds and analysed for major elements by 401
EPMA, were carefully re-polished to remove carbon coating, using consequently 1-µm-grain-size 402
Al2O3 and 0.25-µm-grain-size SiO2 suspensions. The grains were then removed from the epoxy, 403
remounted by pressing them into two indium metal mounts, which were ultrasonically cleaned and 404
stored in a laboratory heating and drying oven at about +70 °C for 24 hours. Immediately after 405
gold coating and about 24 to 48 hours prior to analysis, the mounts were placed into a sample 406
storage of the ion probe and held at a pressure of ~10-8 Torr to lower H2O blank.
407 408
The samples were sputtered with a 10-kV, 1.5–3.2-nA, 133Cs+ primary beam focused to a spot of 409
5–10 µm, rastered to 20 µm × 20 µm during 180 s pre-sputtering (in order to further clean the 410
sample surface), and to 10 µm × 10 µm during analysis. A normal-incidence electron gun used for 411
sample charge compensation was tuned by limiting the H- emission from the sample surface to 412
<1000 cps. A mechanical field aperture of ~1,000 µm was set at the secondary ion image plane 413
in order to eliminate the secondary ion signal from the spot margins. A liquid-nitrogen cold trap 414
and a sublimation pump were used to maintain a sample chamber pressure of ≤10-10 Torr during 415
analyses. An energy slit was centred and opened to 30 eV.
416 417
After pre-sputtering, the intensities of 17O- (counting time 2 s), 16OH- (6 s), 18O- (4 s), 17OH- (4 s) 418
and 16OD- (20 s) secondary ions were measured in monocollection mode during 30 to 60 cycles 419
(depending on the H2O concentration in the analysed glasses), using axial electron multiplier 420
(EM). The EM dead time correction (45 ns measured during the analytical session) was applied to 421
all masses. A mass-resolving power (M/DM) of ~13,000, suicient to resolve 16OD mass from 16OH2
422
(M/DM = 11,632) and 17OH (M/DM = 8,739) interferences, was applied.
423 424
The analyses were performed during one 7-day-long analytical session from 29 January through 425
4 February, 2018. To establish calibration curves between measured 16OH-/18O- the respective 426
H2O concentrations, a set of 7 natural and synthetic reference glasses of basaltic composition 427
(Extended fig. 3a, Supplementary Table 4ab) were analysed at the beginning and throughout the 428
analytical session, with at least 3 to 7 replicate measurements. In addition, a synthetic forsterite 429
(4.5 ± 1 µg/g H2O) and a synthetic Suprasil 3002 quartz glass (0.99 ± 0.36 µg/g H2O)39 were 430
repeatedly analysed during the analytical session to monitor the 16OH- background level. Under 431
these analytical conditions, typical count rates were ~7.6 ´ 10+5 cps for 16OH- and ~152 cps for 432
16OD- on ETNA-0 (1.35 wt.% H2O) and ~1.1 ´ 10+5 cps for 16OH- and ~23 cps for 16OD- on CL-DR01- 433
5V (0.17 wt.% H2O) reference glasses. For comparison, ~3.3 ´ 10+2 cps for 16OH- and ~0.54 cps 434
for 16OD- were measured on the Suprasil 3002 quartz glass and ~4.8 ´ 10+2 cps for 16OH- and 435
~0.57 cps for 16OD- on the synthetic olivine. The calibration curve for H2O yields a relative error 436
of ±5.1% (Extended Data Figure 3a).
437 438
The hydrogen isotopic compositions are reported as dD values calculated as:
439 440
dD (‰) = [(D/H)sample / (D/H)VSMOW-1] ´ 1000, (1) 441
where (D/H)VSMOW = 155.76 ´ 10-6 442
443
The measured dD values (dDmeas) are biased by instrumental mass fractionation of H and D 444
isotopes (IMF, ‰, see details in Supplementary Table 4), which depends on matrix composition40. 445
To determine matrix effect for our measurements we applied a multivariate linear correlation (p- 446
value <0.002, R2 ~0.75) between the IMF values and the concentrations of Al2O3 and H2O in the 447
5 glass standards (60701, 40428, CY82-29-3V, VG-2 USNM111240 and ETNA-0, Extended Data 448
Figure 3b,c):
449 450
IMF = 439.74711 - 20.34088 ´ H2O + 4.76916 ´ Al2O3 (2) 451
452
Using the equation (2), the matrix effect on the IMF was ceased and the dDtrue values were 453
calculated as 454
455
dDmeas – IMF = dDtrue (3)
456 457
The reported error, calculated as average residuals for the obtained regression, is ±6.3‰.
458
Laser-ablation ICP-MS 459
Trace-element concentrations in melt inclusions and host olivine were analysed by laser ablation 460
ICP-MS using an Agilent 7900 quadrupole mass-spectrometer coupled with a 193 nm Excimer 461
Laser Ablation system GeoLas Pro (Coherent) at the Institute of Geosciences of Kiel University, 462
Germany. Analyses were performed with 24-µm and 60 to 90-µm spots for inclusions and olivine, 463
respectively, 10 Hz pulse frequency, and a laser fluence of 5 J cm-2. In total, 41 elements were 464
measured. Dwell times ranged from 2 ms for major elements to 20 ms for the least abundant trace 465
elements (e.g., Pb, Th, HREE) with total time per cycle of 0.61 s. The other instrumental conditions 466
and data reduction scheme were the same as in reference [4].
467
Melt inclusions 468
Olivine fractions were placed into the platinum capsules and heated at 1 atm pressure in the CO2- 469
H2 gas mixture corresponding to QFM-1 oxygen fugacity in a vertical furnace at Vernadsky 470
Institute in Moscow, Russia41 in order to homogenize the partially crystallized melt inclusions.
471
Samples were heated to 800°C for 5 min to exhaust the atmosphere gas then the experimental 472
temperature was raised to 1450-1520°C for 5 min. Olivine grains were then quenched, mounted in 473
epoxy and polished to expose the glassy melt inclusions on the surface. Though the melt inclusions 474
contain a shrinkage bubble (Extended Data Figure 2b-d) some of them were completely 475
homogenized (Extended Data Figure 2e,f). The melt inclusions that were analysed were larger than 476
20 µm in diameter because smaller inclusions commonly demonstrate bias in their chemical 477
compositions due to the boundary layer effects. Melt inclusions that had been altered and cracked 478
before or during the experiment were identified by the low S concentrations (below 100 ppm) and 479
were excluded.
480
The composition of the glasses of melt inclusions are commonly modified by the Fe-Mg 481
diffusional exchange with the olivine hosts and by the olivine crystallization on the walls of the 482
melt inclusions42. Thus, the measured compositions were corrected using the reverse Fe-Mg 483
exchange43,44 and applying the olivine-melt equilibrium model45 and the estimated FeO contents 484
of the trapped melts. For the Weltevreden samples the FeO contents of the included melts were 485
estimated as a function of Fo contents of equilibrium olivine through modeling the crystallization 486
of random spinifex komatiite KBA 12-10 [46], which is suggested to represent the initial magma 487
composition. The original trapped melt compositions of the Belingwe and Abitibi komatiites were 488
reconstructed as described in [4] and [5].
489
Hydrogen isotope modelling.
490
Hydrogen isotope compositions of melt inclusions indicate H loss from inclusions to external 491
system by volume diffusion through host olivine (Figure 2; Extended data Figure 4). In order to 492
reverse this process and estimate the initial isotope composition of hydrogen the initial content of 493
H2O in melt inclusions is required to be known. These concentrations were inferred assuming that 494
the maximum H2O/Al2O3 ratios in olivine-hosted melt inclusions in each sample represent the 495
minimum original amount of H2O. We use the Al2O3 content of the trapped melt inclusions as a 496
reference because being incompatible with olivine it mimics perfectly the olivine crystallization 497
trend (Extended Data Figure 5a). Thus, the ratio of H2O (other component incompatible with 498
olivine) to Al2O3 has to be constant during olivine crystallization and could decrease due to H loss 499
from inclusion. Corrected for H loss initial H2O contents of trapped melt inclusions of the 500
Weltevreden komatiites also yield olivine control trends for each sample but show significant 501
difference between samples (Extended Data Figure 5b).
502
The original H isotope composition of the trapped melts was calculated using a model of 503
diffusional loss of hydrogen14. In our calculations, we used estimated initial H2O contents of the 504
melt inclusions, their chemical compositions and sizes. The external pressure and H2O content 505
were assumed to be 1 bar and 0%, the size of olivine crystals was taken as 1 mm, and the 506
temperature as 1400oС, oxygen fugacity QFM-1.
507
Hydration of melt inclusions by diffusional gain of H was modelled using the same protocol14, but 508
assuming external pressure and H2O contents of 100 bars and 0.5 wt% respectively, inclusion size 509
of 50 µm in diameter, composition of melt inclusion as 1521-26-9h and different initial water 510
concentrations of melt inclusions.
511 512
REFERENCES 513
38 Byerly, B. L., Kareem, K., Bao, H. M. & Byerly, G. R. Early Earth mantle heterogeneity revealed by light oxygen isotopes of Archaean komatiites. Nature Geoscience 10, 871-+,
doi:10.1038/ngeo3054 (2017).
39 Wetzel, D. T., Hauri, E. H., Saal, A. E. & Rutherford, M. J. Carbon content and degassing history of the lunar volcanic glasses. Nature Geoscience 8, 755-758 (2015).
40 Hauri, E. H. et al. Matrix effects in hydrogen isotope analysis of silicate glasses by SIMS.
Chemical Geology 235, 352-365, doi:10.1016/j.chemgeo.2006.08.010 (2006).
41 Krasheninnikov, S. P., Sobolev, A. V., Batanova, V. G., Kargaltsev, A. A. & Borisov, A. A.
Experimental testing of olivine-melt equilibrium models at high temperatures. Doklady Earth Sciences 475, 919-922, doi:10.1134/s1028334x17080153 (2017).
42 Sobolev, A. V. & Danyushevsky, L. V. Petrology and geochemistry of boninites from the North termination of the Tonga trench - constraints on the generation conditions of primary high-ca boninite magmas. Journal of Petrology 35, 1183-1211 (1994).
43 Danyushevsky, L. V., Della-Pasqua, F. N. & Sokolov, S. Re-equilibration of melt inclusions trapped by magnesian olivine phenocrysts from subduction-related magmas: petrological implications. Contributions to Mineralogy and Petrology 138, 68-83, doi:10.1007/pl00007664 (2000).
44 Danyushevsky, L. V. & Plechov, P. Petrolog3: Integrated software for modeling crystallization processes. Geochemistry Geophysics Geosystems 12, doi:10.1029/2011gc003516 (2011).
45 Ford, C. E., Russell, D. G., Craven, J. A. & Fisk, M. R. Olivine liquid equilibria - temperature, pressure and composition dependence of the crystal liquid cation partition-coefficients for Mg, Fe-2+, Ca and Mn. Journal of Petrology 24, 256-265 (1983).
46 Kareem, K. Komatiites of the Weltevreden Formation, Barberton Greenstone Belt, South Africa:
implications for the chemistry and temperature of the Archean mantle. Doctor of Philosophy thesis, Baton Rouge, Louisiana State University, (2005).
47 Asafov E.V., Sobolev A.V., Gurenko A.A., Arndt N.T., Batanova V.G., Portnyagin M.V., Garbe- Schönberg D., Krasheninnikov S.P., A. H. Wilson and G.R. Byerly, Olivine-Hosted Melt Inclusions in the Ancient Komatiites – the Potential Key to the Archean Mantle Composition//Abstracts, S3.T02, p.50, ECROFI-2017
Figure 1. Compositions of glasses and melt inclusions in olivine phenocrysts.
a. H2O/Ce and Ba/Nb ratios of melt inclusions in olivine in basalts (small grey dots), komatiites (large filled circles) and glasses (coloured fields) from modern basalts (reference34 and GEOROC database: http://georoc.mpch-mainz.gwdg.de/georoc/) and from komatiites (references4,5,15,24 and this study).
Coloured fields correspond to submarine glasses of mid-ocean ridge basalts (MORB), ocean island basalts (OIB), back arc basin basalts (BAB), island arc basalts (IAB), and continental margin basalts and andesites (CMB). MORB and OIB form in mid-ocean ridges and intraplate settings while IAB and CMB are directly related to subduction zones, BAB are barely related to subduction zones. Primitive mantle composition after reference35. Specially marked by empty circle are melt inclusions in olivine from basalts with gained H by diffusion through host olivine8,9.
b. Compositions of melt inclusions versus Fo content of host olivine for komatiites. Variations of H2O/Ce ratios of inclusions in olivine of the same composition of host are attributed to post-entrapment diffusional H loss. The increase of H2O/Ce with decreasing Fo of host olivine in Weltevreden samples is attributed to fractional crystallization plus wall-rock assimilation (AFC), because olivine fractional crystallization (FC) alone does not change H2O/Ce ratio of the melt. The composition of hydrated transition zone (empty diamond) is estimated from H2O contents of a ringwoodite inclusion in diamond22 and the Ce content of primitive mantle35 assuming olivine Fo90. The composition of mantle (pink field) is from34,35. Errors (2ste) are within symbol size.
10 100 1000 10000
1 10 100
H2O/Ce
Ba/Nb
MELT INCL. IN OL KOMATIITES PRIMITIVE MANTLE
MORB + OIB
IAB + CMB BAB
a
100 1000 10000
89 90 91 92 93 94 95 96
H2O/Ce
Host olivine Fo, mol%
Belingwe, Asafov et al, 2018 and this paper Abitibi, Sobolev et al, 2016 and this paper Weltevreden sample 1521, this paper Weltevreden sample 1522, this paper Weltevreden sample 1523, this paper Gorgona, Gurenko et al, 2016
MANTLE
hydrated transition zone
H gain H loss
H gain
AFC b
FC
Figure 2. Measured and modelled H2O contents and H isotope compositions of melt inclusions in olivine from komatiites.
Small symbols - measured compositions;
Larger symbols - initial H2O-δD (‰
VSMOW) in melt inclusions reconstructed using the model of Buchloz et al,(2013) 10 (Methods) and measured data. Error bars correspond to 2 standard errors. Reconstructed compositions for Weltevreden komatiite samples 1522 and 1523 are marked by intermediate-sized symbols because they are likely affected by contamination by surface materials.
Dashed and dotted lines correspond to trajectories due to diffusion H loss or gain through the host olivine10. Compositions of Archean mantle and surface reservoirs are from reference 6.
Figure 3. Primitive mantle normalized patterns of incompatible trace elements in trapped melts in high-Mg olivine phenocrysts from komatiites.
Compositions of melt inclusions in olivine Fo>91 from Gorgona komatiite (average of analyses by reference15) and Archean komatiites studied in this paper (Extended data Table 1).
Incompatible element
concentrations in the primitive mantle are from Hofmann et al, (1988)35; H2O (266 ppm) and Cl (26 ppm) are from Kentrick et al, (2015)34.
0.1 1 10 100
Sample/Primitive mantle
Weltevreden 1521-26-9h Belingwe Z6-8-10 Abitibi 810-26-3 Gorgona Fo>91
-300 -200 -100 0 100 200 300 400 500
0 0.2 0.4 0.6 0.8 1
δD‰ VSMOW
H2O, wt%
Weltevreden 1521 Weltevreden 1522 Weltevreden 1523 Belingwe Z6 Abitibi 810
trajectories of H loss
trajec
tor
ies of
H g
ain AFC
ARCHEAN SURFACE ARCHEAN MANTLE
Figure 4.The temporal evolution of the komatiite mantle source composition and other Earth reservoirs.
a. Evolution of H2O/Ce ratio in the mantle. The composition of hydrated transition zone is estimated using the H2O content of a ringwoodite inclusion in diamond22, the Ce content of primitive mantle35 (large diamond; assigned an arbitrary age of 1.0 ± 0.5 Ga), and H2O/Ce ratios of melt inclusions in olivine (this paper and references4,5,15) and spinel36 in komatiites. The compositions of Phanerozoic mantle and bulk silicate earth (BSE) are from references34,35.
b. Evolution of hydrogen isotope composition of mantle. Compositions of BSE, CRUST, MANTLE and DEHYDRATED LITHOSPHERE and evolution of EARTH SURFACE AND EARTH MANTLE are from reference6.
c. Evolution of the Ce/Pb ratio in mantle sources of komatiites and the estimated production rate of continental crust30. BSE composition after35 and Phanerozoic mantle after34. Ce/Pb ratios of melt inclusions of studied komatiites: Weltevreden 1521-26- 9h, Abitibi 819-26-23, Belingwe Z6-8-10; Lapland komatiite - calculated average of the least contaminated melt inclusions in spinel, from Hanski and Kamenetsky (2013) 37.
All data plotted with 2 standard errors of mean (not seen if they are smaller than symbol size). RDL-stands for Recycling of Dehydrated Lithosphere.
100 1000 10000
0 1 2 3 4 5
H2O/Ce
Age , Ga
Gorgona Belingwe Abitibi
Weltevreden,1521 Belingwe in Sp Ringwoodite
BSE
? HYDRATED TRANSITION ZONE ?
RDL ?
MANTLE
a
-250 -200 -150 -100 -50 0
0 1 2 3 4 5
δD‰ VSMOW
Age, Ga EARTH MANTLE
DEHYDRATED LITHOSPERE MANTLE
CRUST EARTH SURFACE BSE
?
b
RDL?
0 50 100
10 15 20 25
0 1 2 3 4 5
Cont. crust %
Ce/Pb
Age Ga
Lapland in Sp
BSE MANTLE
c
STAGE 1 STAGE 2
RDL?
Extended Data Figure 1 |a. Generalized geologic map of the western half of the Barberton Greenstone Belt (modified after46). b. Field locality of the sampling area (Saw Mill area, Weltevreden formation, modified after38).
Extended Data Figure 2 |Olivine hosted melt inclusions (sample 1521) from the 3.3 Ga Weltevreden komatiites: a - untreated partially crystallized melt inclusion containing clinopyroxene, glass and the shrinkage bubble; b, c, d, e and f – glassy melt inclusions after the quenching experiments (see METHODS); b,c and d – contain shrinkage bubble; d – contains fine olivine spinifex textures due to very high MgO contents of the melt (>26 wt.% MgO); e and f – homogeneous melt inclusions, f- the 1521-9h melt inclusion reported in this study.
Extended Data Figure 3 |a – H2O calibration line obtained for the series of standards (see Methods, Supplementary table 4a, 4b) to calculate H2O contents of the samples; b and c –the correlation lines between IMF and H2O and Al2O3 contents, multivariant correlation between IMF and both H2O and Al2O3 contents (p-value <0.002, R2 ~0.75, equation 2, METHODS) was used to correct the matrix effect of the analyzed materials. R- correlation coefficient.