Pure & Appl.Chern., Vol.54, No.12, pp.2693—2758, 1982. 0033—4545/82/122693—66$03.OO/O
Printed in Great Britain. Pergamon Press Ltd.
©1 982 TUPAC
INTERNATIONAL UNION OF PURE AND APPLIED CHEMISTRY
ANALYTICAL CHEMISTRY DIVISION COMMISSION ON EQUILIBRIUM DATA*
Critical Evaluation of Equilibrium Constants in Solution Part A: Stability Constants of Metal Complexes
CRITICAL SURVEY OF STABILITY CONSTANTS OF NTA COMPLEXES
Prepared for publication by 0. ANDEREGG
Laboratorium für Anorganische Chemie, ETH, Zurich, Switzerland
*Membershjp of the Commission for 1981—83 is as follows:
Chairman: S. AHRLAND (Sweden); Secretary: H. OHTAKI (Japan); Titular Members:
E. D. GOLDBERG (USA); I. GRENTHE (Sweden); L. D. PETTIT (UK); P. VALENTA (FRG); Associate Members: G. ANDEREGG (Switzerland); A. C. M. BOURG (France); D.
S. GAMBLE (Canada); E. HOGFELDT (Sweden); A. S. KERTES (Israel); W. A. E.
McBRYDE (Canada); I. NAGYPAL (Hungary); G. H. NANCOLLAS (USA); D. D. PER- RIN (Australia); J. STAR' (Czechoslovakia); 0. YAMAUCHI (Japan); National Represen- tatives: A. F. M. BARTON (Australia); M. T. BECK (Hungary); A. BYLICKI (Poland); C.
LUCA (Romania); I. N. MAROV (USSR); A. E. MARTELL (USA).
CRITICAL SURVEY OF STABILITY CONSTANTS OF NTA COMPLEXES
Introduction 2694
Investigation of equilibria 2694
The standard state 2709
Protonation constants 2710
Metal complex formation 2713
Mixed complexes 2739
Thermodynamic data 2749
References 2752
List of selected stability constants 2757 1. INTRODUCTION
Nitrilotriacetic acid (1) is one of the simplest aminopolycarboxylic acids which, in the fully deprotonated form, can act as a general sequestering agent for all metal ions (61 S).
/
CH2COOH
N-CH2COOH (1)
CH2COOH
This is due to the presence of one selective N donor and of three general 0 donors which can form, by coordination, three stable 5-membered chelate rings. Because of the presence of a basic nitrogen atom,its sequestering tendency is strongly dependent on the pH value of the solution. Ionic equilibria involving (1) has been of interest to both analytical chemists and to industry (detergent, plant nutrition, pulp and paper manufacture, industrial and boiler cleaning (75 M)). Almost 150 papers have appeared in which equilibria involving this ligand with hydrogen or metal ions are discussed and described by means of numerical data.
In this survey all numerical data for these equilibria are critically discussed, especially in relation to the systems used (salts, solutions, apparatus, techniques, ...)
to
obtain theexperimental data and the methods used for the calculations and refinements. A question mark indicates situations where the required information is not given in the literature or for cases for which the literature was inaccessible. The numerical data are then classified according to four categories: recommended, tentative, doubtful and rejected (75 W). In this introduction the methods used for the investigations and calculations are presented
chronologically. In this way it is possible to follow the reasons which have led to the introduction of new methods and devices. Indeed, dating from the publication of Jannik Bjerrum's thesis, the techniques for the determination of equilibrium data have received impulses from different scientific approaches and from technological progress.
2. INVESTIGATION OF EQUILIBRIA
For each method a selection of papers is considered and discussed in detail. No attempt has been made to be exhaustive and the choice of the literature simply reflects the questions
2694
Stability constants of NTA complexes 2695
to be discussed. NTA as a tetradentate ligand can form not only 1 : 1 but also 1 : 2 complexes. Further, in the presence of other ligands L*, mixed complexes M(NTA)L* can also be formed (the data for such species are given in a separate chapter). The values of the thermodynamic fuctions G0, LH0 and ES° for the equilibria are tabulated in the appendix.
Although nitrilotriacetic acid was synthesized by Heintza in 1862, the first observation of its strong sequestering power for alkaline earth cations was discovered approximately seven decades
later. Heintz mentioned the initial deep blue color of neutral solutions of this acid in the presence of copper salts, followed by precipitation of a solid phase (the solution remaining was observed to be acidic); however these observations were not understood and not further
explored. In 1917, Dubsky and Spritzmann (17 D) concluded from the composition of the copper(II) complex salts that coordination of the nitrilotriacetate ion occurs via four donor atoms. The water softening properties of aminocarboxylic acids were first mentioned in a patent of the I.G.Farbenindustrie
in Frankfurt am Main (D.R.P.N. 718981) of 31 October 1935.In particular, if such acids have more than one carboxylate group per nitrogen atom:
"It seems, as if the calcium ion would
be bound in complex form by the mentioned aminoacids".In
this, NTA was one of the more efficient of the acids investigated. After the discovery of this water softening property, some preparative work was carried out by Pfeiffer (42 P) who obtained,
in the presence of calcium ions, a 1 : 2 complex salt, K2Ca(NTA)2.4H2Ob .it
was atthis time that Schwarzenbach began an investigation of the equilibria between aminocarboxylic acids and metal ions using potentiometric pH measurements. The direct pH method is based on the fact that the pH values of solutions of the protonated ligand alone (case A) or in the presence of a metal ion (case B) when neutralized by stepwise addition of a strong base, allow the evaluation of the constants for the equilibria involved:
H
+ LVHL1 (I) HL1
+M ML+ H
(II)Equilibria I and II refer to the simple case of a monoprotonic acid whose anion forms 1 :
complexes only. The equilibrium constant for I is identical to the protonation constant K1 H (dm3mol) for the anion, where brackets are used to denote the concentration expressed
[HLJ K
l,H
[H][L]
in mol dm3. From the equilibrium constant of II, K11, it is possible to obtain the stability constant K1 of ML as follows:
Note a. W. Heintz, &iiiaiei3 122, 260 (1862)
Note b. For information about other complex salts: see Gmelin Vol.IV, III Supplement
2696 COMMISSION ON EQUILIBRIUM DATA
[ML] [H] [ML] [HL]
(1=
==K
K[M] [L] [M] [HL] [H] EL]
]1 l ,H
For the sake of simplicity the charges are omitted. The relations between the total
concentration of the ligand [L]t, the metal ion [M]t, and the dissociable protons [H]t, are:
J'
[L]t
=[L]
+ [HL]case A
[H]t = [H] + [HL] - [OH] =
[L]t
-[0H]t
I
[L]t
=[L]
+ [HL] + [ML]; [M]t = [M] + [ML]case B
[H]t = [H] + [HL] - [OH] =
[L]t
-[OH]t
where [OH]t is the concentration of strong base added to the solution of the monoprotonic acid. These relationships are reduced in the first case to:
+ ( - 1)
K1H[H] =0
with =[HL]/[L]t
and in the second to:
+ ( - 1)
K1[L] =0 with =
[ML]/[M]t
=UL]t
-([L]t
-[0H]t
+ [OH] -[H])/([H]K1H)}/
[M]tThe above relationships remain linear in the unknown constants if the maximum number of protons bound to L (= P) is > 1 and that of ligand molecules (= N) bound to M is > 1 (61 R, 65 A):
p-
z(p- p) K [H] = 0
O p
N
E ( - n)
n [L]n =0
0with K =
[HL]/([H]'
[L])and n = [ML]/([M][L]n)
= K1K2 ...KFor each pair of values ,[H] or ,
[L]
one linear equation in the involved unknown(K1H or k1) or unknowns (K or is obtained. If the number of pairs of values is equal to or greater than that of the unknowns, the calculation of the constants can be done with stand-
ard methods. Normally the number of pairs is high, which allows the use of statistical (least squares) methods giving not only the "best values" for the constants but also their standard deviations as well as the precision of the measurements. Concerning the basis of these methods
Stability constants of NTA complexes 2697
in ionic equilibria calculations the papers of Sillén (63 Sa 63 Sb) give the needed information. It is not difficult to develop procedures for the computer calculation of the stability constants (77 P). The literature does not always list sufficient information
concerning determined stability constants to evaluate the reliability of the experiments used.
For simple systems involving formation of mononuclear species, it is normally sufficient to list the standard deviation of the constants 0n) or c(K) ,
but
in more complicated cases the standard deviation of the proton number a(p) and/or the ligand number,ci(n) should also be included since they give a measure of the precision of each single result from the"expected". On the contrary, the value of the standard deviation of a constant depends also on the relative concentration of the species involved.
These relationships are no longer valid if protonated or hydroxo metal complexes are formed.
Their use is straightforward if the measurements are made at constant ionic strength, because it
is
then possible to measure the hydrogen ion concentration ({H] = 10_PH) of the solution aftercalibrating the cell with solutions of known hydrogen ion concentration (using strong acids or buffer solutions). The constant ionic strength should preferably be maintained with the
same inert salt as that used in the measurements. With this precaution it is possible to minimize the diffusion potential if cells with a liquid junction are used. Corrections are necessary for solutions in which the concentrations of H+ or Ui-i are higher than 0.5% of the ionic strength on a molarity scale, because of the extremely high mobility of these ions. The above method had already been used by different authors (e.g., in the determination of pK values of acids by Simms (26 5) and of stability constants of complexes by Cannan and Kibrick(38 C))before Bjerrum gave the first complete and detailed description of the procedure in his dissertation (41 B).
Graphical representation of titration curves allows the following information to be obtained:
(i) the purity of the protonated ligand can be estimated from the calculated equivalent weight and the shape of the curve
(ii) detection of the presence of undesired pH buffering impurities
(iii) data concerning the compositions of the complexes formed (if the stability constants are > lO).
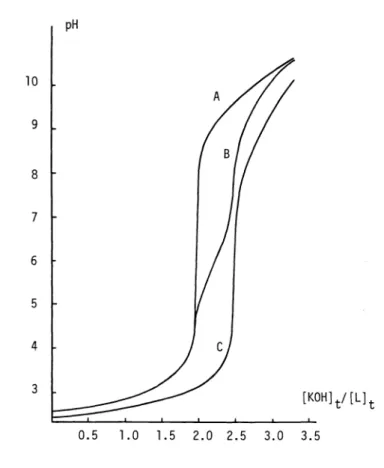
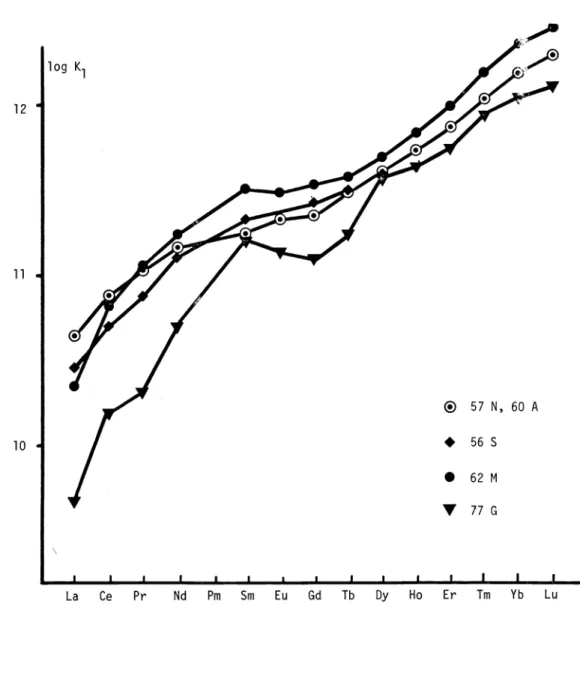
The last information is especially important in relation to the calculation of stability constants. On the basis of such results it was possible, for instance, to demonstrate that only 1 : 1 and 1 : 2 complexes (60 A) are present in acidic solutions of trivalent lanthanide ions and NTA and with the absence of 2 : 3 complexes (57 N). In Fig. 1 are given the titration curves of (i) the triprotonated ligand alone (A); (ii) the ligand in the presence of Ca2 (B);
and (iii) in the presence of Cu2 (C), at I = 0.1 (KNO3) and 25°C. The total concentration of the cations (1lO3M) is half that of the ligand (2.103M), so that formation of both ML and ML can be realized during the
titration. With both metal ions the formation of the 1 : 1 and
1
: 2 complexes takes
place in two distinct pH ranges. For Ca2 (and Cu2) the complex CaL (CuL)is formed at pH
5 - 7 (<4) andCaL (CuLt) and pH
9 - 11 (8 -10).
Evaluationusing least
squares procedures gives the following constants:PAAC 54:12 -AA
2698 COMMISSION ON EQUILIBRIUM DATA
Ca2 log K1 =
6.41
(1)Cu2 log K1 =
11.2
(1)log K2 =
2.47
(5)[CuL(0H)] [H]
log K2 =
4.24
(3) log =9.17
(3)[CuL]
Standard deviation of the ligand number: =
0.005
In parentheses three times the standard deviation of the last digits are shown. Because CuL is
already formed at the beginning of the titration its formation constant is very uncertain;
this
fact will be further discussed.10
9
8
7
6
5
4
[KOH] t1 [L]t
Fig. 1. Titration curves of nitrilotriacetic acid
Sometimes a large error in a constant results from the presence of other species in low concentration. An exact understandig of the situation is often possible only after large variations of the total concentrations of the components have been studied. This can be done only if the ionic strength of the system is high enough to allow such alteration of the composition without significant interference with the ionic medium (activity). At ionic strength 0.1 M (the most widely used ionic strength), such alterations are practically impossible: More recent studies have therefore employed an ionic strength of 1 M or more.
In the first communication of the series "Komplexone", Schwarzenbach (45 5) gave a list of
.-t- + 2+ 2+ 2+ 2+
constants for 1 : 1 complexes of Li , Na , Mg , Ca ,
Sr
and Ba . As no inert salt was present the ionic strength of the solutionschanged during the titration, the calculation of
pH
A
3
0.5 1.0 1.5 2.0 2.5 3.0 3.5
Stability constants of NTA complexes 2699
the constants at ionic strength -'-
0
is appropriate. This implies the use of the activity coefficients of the species involved, but since the total concentration of the ions present was approximately millimolar ,the
use of the Debye-Hückel limiting law is justified.Activities
instead of concentrations were then inserted in the expressions to obtain the thermodynamic constants. Schwarzenbauch used the following cell:
[H2(g),
Solution, sat. KC1, Hg2C12(s); Hg(l)Jwith a sat. KC1 agar bridge. The standardization of the cell with the hydrogen electrode was carried
out by titration of acetic and benzoic acids. The pK values obtained for H3L and H2L (3.03
and 3.07) are very questionable if compared with those obtained at I = 0.1 (1.89 and 2.49) and this has been discussed by Schwarzenbach. In the dissertation of Kampitsch published some years later (1949), the inadequacy of the method is considered "because of the impossibil- ity of the mathematical or experimental elimination of the diffusion potential" (49 K). It shouldbe further mentioned that anomalous pK values were also obtained for uramildiacetic acid which has two deprotonation equilibria in acidic solution. The pK values also "became"
reasonable at ionic
strength 0.1 (1.7 and 2.67) (63 I) compared with the values for I =0 (3.75
and 2.86 (46 5). A correction for liquid junction potential was introduced in Schwarzenbach's laboratory only after 1954; mathematical elimination of this potential was carried out by use of the formula of Henderson (7 H). Because of this difficulty, Schwarzen- bach in 1949 introduced KC1 as inert salt, and this enabled the use of an AgC1, Ag electrode directly in the solution without liquid junction.In a second paper Schwarzenbach (48 5) demonstrated that the "thermodynamic stability con- stants" of Cd2, Co2, Fe2, Mn2, Ni2, Zn2, Ce3, Al3 and Fe3 should be greater than 1010 and therefore not able to be evaluated using the pH method just described because the complex is already formed in the initial solution and the titration corresponds to
neutralization
of free hydrogen ions as well as those bound to excess of the
ligand. The furtherneutralization of the mixture enables the formation of 1 : 2 complexes and the formation of hydroxo complexes to be followed. The values of the equilibrium constants
for thesetwo complex types for I - 0 are given with a precision of ± 0.2 in logarithmic units.
Another difficulty in the investigation of equilibria involving variable and low ionic
strength arises from the uncertainty in the calculated activity coefficients especially if the ionic charge is high as, for instance, it is the case for aminopolycarboxylate anions. The measurements involving nitrilotriacetic acid and alkaline earth cations were therefore
repeated by Schwarzenbach (49 5) with the following cell, in which the concentration of chloride was held constant at 0.1 M. For standardization, titration of acetic acid using the
H2(g),
0.1M KC1, AgCl(s), Ag(s)
pK value of Harned and Owen (43 H) was employed. This practice could be followed because Ag forms weak complexes with aminopolycarboxylate anions. To maintain a constant chloride
concentration, the solution of strong base used for the titration was made 0.1 M in KC1 (50 W).
The difficulties encountered in the investigation of stable 1 : 1 complexes
have been over-
come by Ackermann and Schwarzenbach (49 A) by use of pH measurements applied to the exchange
2700 COMMISSION ON EQUILIBRIUM DATA
reaction III. The stable complex ML reacts with a protonated amine, TREN (2, 2', 2-tn-
MC + H3TREN3 > M(TREN)2 + HL2 +
3H
(III)aminotriethylamine), in a suitable pH range to allow an exact determination of the equilibrium constant involved. This has been carried out for the system with M2 =
Zn2t
The stability constant for ML is obtained by combination of the determined equilibrium constant K111 with the constant for equilibrium IV together with the protonation constants for L3. For Cu2M2 + H3TREN3 M(TREN)2 +
3H
(IV)the 1 : 1 NTA complex is very stable with respect to the 1 : 1 TREN complex and reaction III takes place at quite high pH. With the introduction of a second metal ion M*2, which forms
[ML] [H]3 [M(TREN)] [HL] 1
[M] [L] [H3TREN] [M] [H] [L] K111
complexes only with NTA, the exchange reaction V occurs in a suitable pH range such that
ML + M*2
+ H3TREN3 > M(TREN)2 +M*C
+3H
(V)an accurate value of the equilibrium constant can be obtained. In this last case the stability constant of M*L must also be known. Note that the equilibrium constants for the TREN complexes can be obtained by the usual pH method. Because all the pK values of H3TREN3 are quite high (8.56; 9.59 and 10.29), it is possible to evaluate stability constants up to
1020 in this way, instead of the l0 limit when only NTA is present. Using similar equilibria Schwarzenbach and Freitag (51 S) obtained the stability constants for the 1 : 1 NTA complexes
2+ 2+ 2+ .2+ 2+ 2+ 2+ 3+
with Mn , Fe , Co , Ni , Cu , Zn , Cd and La . The values for the complexes of the first two cations have also been obtained using the standard pH method (K1<109 ) and are reported in the same work. The higher value was obtained for FeNTA with log K1 =
8.82.
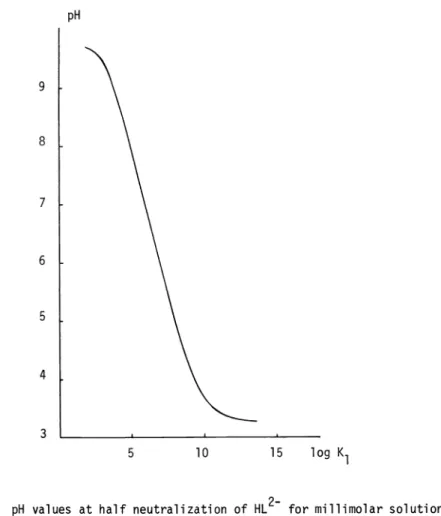
Formillimolar solutions of the ferrous ion and of the monoprotonated ligand HL2, the ligand number before any base addition will already be 0.271 therefore a lower precision of K1 with respect to that for weaker complexes would be expected. In spite of the above limitation
for the direct pH method, the literaturecontains papers using this method to determine stability constants > 1010 with !ITA as ligand. The decrease in precision of the K values
due to the increased ligand number in acidic solutions can be followed in the graphical representation
of the log K1 values. These correspond to the pH values of the solutions with
Stability constants of NTA complexes 2701
millimolar concentrations of the components ([Mit =
[Lit = 103M)
at half neutralization of HL2with strong base (Fig.2). For log K1 values between 3 and 9 a linear dependence with the
9
8
7
6
5
4
3 pH
10 15
log K1
Fig. 2. pH values at half neutralization of HL2 for millimolar solutions
of the components versus log K1
pH value is observed with d log K1 /d pH =
-1.
This corresponds to the range for which the constant K1 canbe obtained with higher precision and an error c(pH) of 0.01 in pH
isreflected by a numerically equal error in log K1 .
At
log K1 = 10 the error is already 3 (pH), for log K1 = 12 it is 30 a(pH) and for log K1 =13 it is 66 a(pH). Further
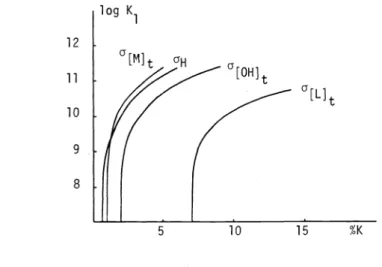
it is necessary to consider other sources of error, such as those in the analytical total concentrations of the components: metal ion, ligand and strong base. These errors are equal in magnitude and in sign for all points of a curve and are therefore systematic errors. The % error in K1 is calculated for the values of K1 and half neutralization of HL2in Fig. 3using the partial derivatives of
K1 with respect to the variables [Mit, [Lit, [OHitand [Hi and the law of propagation of errors.
It appears that the error due to [Lit can be especially relevant and have more influence than those due to [OHit and to [Mit. The experimental values for the standard deviations for the different quantities are:([Mit)
= 0.00005
M, a[Lit) =0.00005
M, a([OHit) =0.00005
M and a([Hi) =0.003
[Hi ln(lO).5
2702 COMMISSION ON EQUILIBRIUM DATA
12 11
10
9
8
Fig. 3. The % error in logK1 from the single experimental quantities
A reduction in the errors of the total concentrations can be partially achieved by repeating the calculation of the constants after variation of the total concentrations. The best values for these analytical concentrations are those which yield the lowest standard deviations for the
required constants. The treatment of the error in [H] as a systematic error in the stand- ardization of the cell is generally not meaningful because this procedure can be applied in different ways to give different final results with the same precision (79 A, 80 A).In calculating the error of a stability constant only the errors involved in the investigated equilibrium are normally considered, whereas the values for any other (protonation equilibrium or stability) constants used in the calculation are usually arbitrarly assumed to be known exactly. For instance, in the case under discussion, the error given by Schwarzenbach (for the constants of the IITA complexes obtained with the TREN exchange equilibrium) identical to that for the corresponding reactions of type III or IV, respectively. The figures given do not correspond to the standard deviation but to the largest deviation of log K1 after
elimination of some values (51 S) which deviate in an unexpected manner in the opinion of the author. By comparison of similar results one can estimate that the error given corresponds to between 1.5 and 2 a (a= standard deviation of the equilibrium constant). The inclusion of errors for other constants (which are normally not included) is done by using the law of error propagation:\/i'
where ar
is the standard deviation of thelogarithm of each constant involved
and R is the number of constants used in the calculation. In the case of the constants discussed above, the value of a obtained for the stability constant of Zn(NTA) (49 R) from reaction III is obtained by putting a1 =0.03
for log Kiv, a2 =0.02
for the pK of HL2 and a3 =0.03
for log K111 given a =0.05,
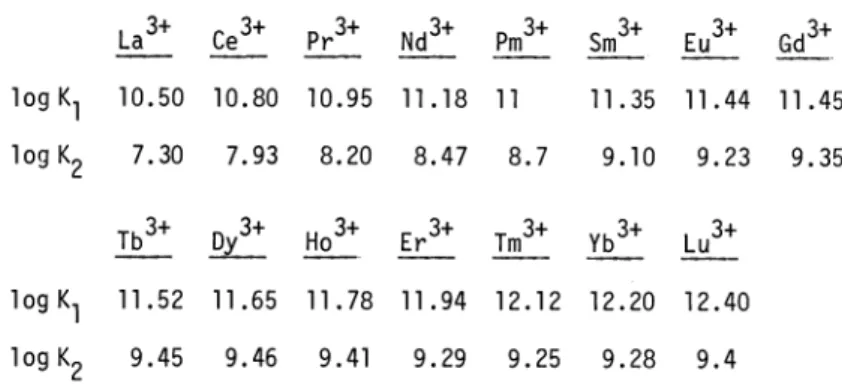
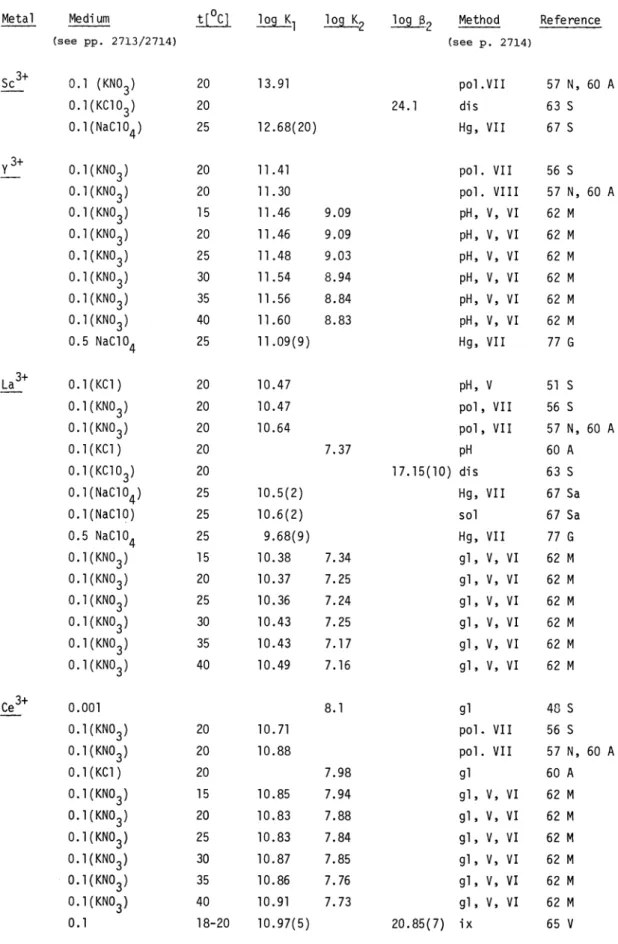
i.e. the value given by Schwarzenbach can be considered to be a good measure of the standard deviation of this stability constant.The exchange reaction V has been used by Anderegg (60 A) and by Moeller and Ferrus (62 M) in the determination of the stability constants of the 1 : 1 and 1 : 2 NTA complexes of the
3+ 3+ .
lanthanide
cations. The stepwise constant K2 from La to Gd can also be obtained using the direct pH method (K2 l0) (60 A). Moeller and Ferrus have obtained values ofK (from V, with M = Cu and M* = Ln) and K2 (from VI) in the temperature range from 15 to 40 C at
log K1
5
10 15Stability constants of NTA complexes 2703
CuL +LnL + H3TREN3
—--
CuTREN2 +LnL
+3H
(VI)intervals of 5 0C. In the course of this investigation the pK value of HL2 was also measured; the authors considered the agreement of the value obtained at 20 0C (9.80) with that obtained by Schwarzenbach (9.73) to be excellent ().
In new investigations, KNO3 was preferred to KC1 as the inert salt because NO forms much weaker complexes than Cl with metal ions. This makes the correction of the stability constants for the presence of chloro
complexes as well as for mixed chloro NTA complexes un- necessary. In the presence of KNO3 it is necessary to use a cell with liquid junction for pH measurements, because the reference electrodes used (calomel or AgCl, Ag) are reversible to chlorideion. This can be a source of error if the potential due to this junction changes with time. The following cells are often used:
A Glass electrode Solution at constant Solution at the same
HgCl ,Hgionic strength I ionic strength I with partial substitution_
of the anion with Cl
B Glass electrode Solution at constant Saturated KC1 solution
HgC1, Hgionic strength I
The first cell is preferred because of better constancy of the liquid junction potential due to
negligible diffusion between the two solutions. Indeed, ifcell B were to be proposed (70 U) for an operational definition of pH, its use should be discouraged for routine measurements of complex formation equilibria because of possible contamination of the solutions in contact.
One of the major causes of error in using buffer solution to calibrate for pH values in the activity
scale arises from using buffer solutions having another composition to the solution to be measured. This type of error results from the difference in liquid-junction potential of the two solutions and is named by Bates and co-workers as "residual liquid-junction". Its importance in the measurement of the pH of blood has been discussed recently (78 B) and found to be 0.03 and 0.05 for solutions at I =0.1
and 0.16, respectively.It should be emphasized that the determined value of a stability constant will be only exactly valid for the ionic medium (and temperature) used; the influence of the ions has to be taken into consideration in any discussion of values in different inert salts. For this reason inert salts are generally preferred which do not seriously interfere with the investigated
equilibria. This should generally be the case for tetramethylammonium or tetraethylammonium perchlorate, but the former is only of low solubility and usually cannot be used. Potassium has only a weak tendency to bind NTA (log KKL= 0.6 (I =
0.1)
(67 A)) and is generally used as its nitrate salt.Hughes and Martell (56 H) determined the thermodynamic pK values for nitrilotriacetic acid as well as the thermodynamic stability constants of the 1 : 1 NTA complexes with Mn(II), Mg(II)
2704 COMMISSION ON EQUILIBRIUM DATA
Ca(II) and Ba(II) using KC1 as the inert salt and using a cell without liquid junction potential (Pt, H2, Solution I (KC1), AgC1, Ag) for the temperatures 0, 10, 20 and 30 0C.
They used only one solution for the determination of a single constant at I values between 0.02 and 0.08 M. The literature E0 value for the reference electrode was used directly with- out separate calibration. The value of a in the Debye-HUckel equation was arbitrarily chosen to give a minimum slope fortheextrapolated function. Because of the potassium ion associat- ion with NTA, the presence of KC1 in the more dilute solutions causes a small pH decrease of 0.03 of a unit.
When investigating the equilibria between certain cations and ligands the field of
measurement is very often limited to that covering only the species of interest. For instance, if one has to determine the formation constant for a 1 1 complex, one tries to find the experimental conditions for which, besides this species, there is only free metal ion and ligand (initially in a protonated form) present. However, side reactions are possible, expecially with H20, to yield protonated and/or hydroxo complexes. In the case of the ligand under discussion, species of the latter type are expected. Martell was one of the first to recognize the importance of such species and he gave, for instance, formation constants for Th(OH)2(NTA).
Biochemists show preference for mixed constants; i.e. for constants for which H+ activity is used for H+ and the concentration scale for the other species. Cohen and Wilson (66 C) determined the pK values for HL2 in 1 M NaCI and 1 M NaNO3 using, for standardization, a Fisher buffer of pH =
7
in a cell with glass and saturated Hg2C12 electrode. They determined the stability constant of ZnL using the direct pH method even though the use of this method in this case had already been discouraged by Schwarzenbach (49 S); further, in thecalculations the presence of H2L was ignored Koryta and Kdssler (50 K) have attempted to use polarographic measurements to investigate the equilibria between NTA and Zn2+, Cd2+ and Pb2 in KC1 solutions with I =
0.1,
0.2 and 0.3 N. They determined, from the height of the wave for the M2+ and M(NTA) reduction, the concentration of these species in acidic solutions containing an excess of ligand. The measured pH value and the concentration of M(NTA) together with the total concentration of ligand gave the concentration of the free[NTA]t = [M(NTA)J + z [HNTA] = [M(NTA)]
+ K [H]{NTA]
nitrilotriacetate
ion. They used for their calculations (for the system at different ionic strengths) the pK values for I =
0.1 of 49 S and no details were given concerning the pH standardizationof the cell used. For both these reasons it is difficult to estimate the experimental error. Schwarzenbach has preferred to use the polarographic method to determine
[M] and
[M(NTA)] for solutions in which an exchange equilibrium VII between two metal ions M2 and M*2 takes place. The equilibrium constant for VII Ky11
is identical to the ratioM(NTA) +
M*2
M*(NTA) + M2 (VII)Stability constants of NTA complexes 2705
of the stability constants of M*(NTA) and M(NTA). To obtain exact values for the constants, it is necessary to know one of these constants exactly. The value of K1 for Cu(NTA) was therefore checked using TREN exchange V and log K1 =
12.96
±0.05
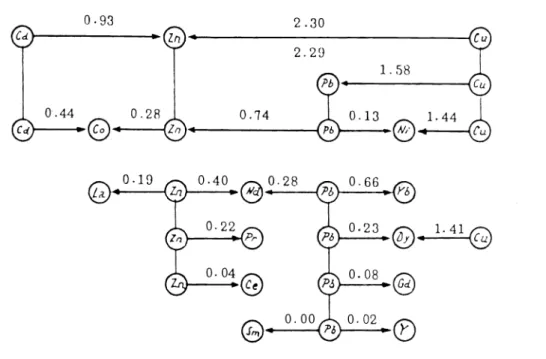
(56 S) was obtained against 12.68 of 51 S. The stability constants of the 1 : 1 complexes with Zn2, Ni2, Pb2, Co2, Cd2 and lanthanide cations were obtained using the exchange equilibria VII from the values of log Ky11 given in the following scheme:0.93
An arrow (M — M*
or M* —
M) separates each pair of the investigated cations. The mixtures investigated normally contained equimolar amounts of the two metal ions and of the ligand and further, the pH value of the equilibrated solutions was between 5 and 5.6 .This
impliesthat
the whole concentration of ligand is bound to the metal ions in proportion to the respective stability constants. The absence of protonated species M(NTA)H simplifies calculation
of the equilibrium constants. Unfortunately, for some cations, sulphate salts2+ 2+ 3+
2-
were used to prepare the metal solution (Cd , Mn
and Ce )even though the SO4 anion
can alter the position of the equilibrium by formation of simple sulphato and/or mixed complexes.A further investigation based on polarographic measurements was performed by Noddack and Oertel
(57 N) using reaction VI . They determined the concentration of free Cu2 or Ni2 in the presence of lanthanide cations in solution containing an acetic acid acetate buffer. The stability constants of the copper and nickel 1 : 1 complexes were obtained from polaro- graphic
and pH measurements in 104M solutions of both HNTA2 and the cations while de- composing the complex by decreasing the pH value of the solution. No details of the pH measurements are given. The complex formation with the lanthanide cations has been inter- preted postulating the formation of 2 : 3 species Ln2(NTA)3. These results were2.30
Fig. 4. Schematic representation of polarographic measurements with NTA (55 G).
2706 COMMISSION ON EQUILIBRIUM DATA
subsequently refuted by Anderegg (60 A) who demonstrated that the results can be interpreted by postulating the formation of only 1 : 1 complexes. The values obtained for the constants are very similar to those of Schwarzenbach and Gut (56 S), even though the effect of acetate ion on the equilibria has been neglected. Instead of measuring the concentration of one species as discussed above, polarography gives, from the displacement of the halfwave potential tiE112 of reduction of a metal ion and the concentration of the free ligand [LI, using equation VIII, both the number N of the ligands involved and also .
In
the caseRT
=
— ln(N[L]N)
(VIII)nF
of Tl the reduction wave is reversible (57 B) and the stability constant for the 1 : complex has been obtained in 1 M KC1 with I =
1.35
- 1.51 M. The standardization of the cell for pH measurements was made using potassium hydrogen phtalate buffer (pH in activity scale) and was also used in the determination of the pK value of HNTA2 at I = 1 M (). NTA also forms very strong complexes with Fe3+, which have been investigated by Schwarzenbach and Heller (51 Sa) using pH and redox measurements on solutions of the complex as well as on FeSO4 in the presence of NTA titrated with Br2. As the stability of the Fe(II) complexes is known, from the measured potential it is possible to determine that of the Fe3+ complex:RT [Fe(NTA)}
KFe(III)NTA
E = E0 +
— ln
F () (IX)
[Fe(NTA)] KFe(II)NTA
Because acetate buffer was used, Fe'NTA(Ac) was taken into account but not FeUAc+ and FeNTA(Ac)2. Further, the required pK values for Fe'NTA, as obtained from measurements with solutions of this complex, were used. The stability constants of Fe'NTA(Ac), of
3.. RT
Fe(NTA)2 (K2) and EM = E0 + —i.— log (KFe(III)NTA / KFe(II)NTA) are obtained from the results of potential measurements in the pH range 3.89 -
5.19
.In
1967, Irving and co- workers (67 I) and Anderegg (67 A) independently observed an increase in the solubility of the neutral protonated acid H3L on addition of strong acid to its solution. They explained this observation in an analogous way to that already postulated for EDTA, namely: formation of H4L in which all basic groups of the ligand are protonated. The calculation of the protonationconstant K4 is done by means of relation X using pairs of values for the concentration c of the
saturated NTA solution at the corresponding pH([Hi] = l0").
c
=[HL} + [H2LI + [H3LJ + [H4L]
1 1
= [H3LI
( ++ 1 + K4[H] )
(X)
K2K3[H] K3[HJ
Stability constants of NTA complexes 2707
Using
solutions at I = 1 NaC1O4 it was possible to determine the protonation constant K4 without significant change of the ionic medium in the presence of additional HC1O4.
Spectrophotometry
can also be used for determining the concentration of one (or more) species in solution and therefore used to obtain stability constants. Astakhov et al. (61 A). . . . 3+ 3+
determined
the stability constants of the 1 : 1 and 1 : 2 complexes with Pr , Sm and Nd3 using isomolar solutions ({L]t +[MIt) in
dilute solution at 18-20 °C. The spectro- photometric measurements were made at pH = 3 and 4. For the calculation of the concentration of the free NTA, a pK value for HNTA2 of 10.33 (56 H) was used. Because of the variable ionic strength and temperature, only rough values are to be expected Intorre and Martell (64 I) have investigated the equilibrium XI at pH = 2 in order to estimate the stabilityFe3 + ZrL
FeL +Zr4
(XI)constant of ZrL+. It was "assumed that the tetramer species is the only form of the hydrolyzed zirconium present" (i). The order of addition of the reagents
was made in different ways in order
to insure the achievement of equilibrium. Zhirnova et al. (65 Z) have investigated the equilibrium XII spectrophotometrically using ammonium acetate buffers in the pH range fromFeL +
In3 "= InL
+Fe3
(XII)2.5 to 3.4 and at an ionic strength fixed "by the concentration of metal and complex ions" ().
Possible
hydrolysis of the metal ions was not considered (). Kornev et al. (66 K) investig- ated the complex formation in solution of thallium(III) ion in the presence of different quantities of ligand using the same method. The thallium complexes absorb strongly in the UVregion. At pH 0.4 the 1 1 complex is formed and at pH 1.3-1.7, the 1 2 complex is formed. Thallium(III) was introduced as its perchlorate to avoid side reactions. The calculation of the number of protons present in the 1 : 1 and 1 : 2 complexes was carried out after making very restrictive assumptions both concerning the number of species present as well as the concentration of the non-bonded ligand. Since the formation of H4L+,was not considered
and the ionic strength, which was mainly due to the concentration of perchloric acid
(0.025- 0.5 M), was not maintained constant -the
quantitative nature of the results must therefore be considered doubtful. The spectrophotometric method was used by Eberle and coworkers for the determination of the stability constants of the 1 : 1 complexes of Np02+NpO2L2, NpO2HL and Np02(OH)L3 (70 E). As a ligand forming colored complexes with metal ions, 3,4-dihydroxyazobenzene-2' -carboxylic acid was used by Koremann et al. (66 Ka) to measure the stability constant of ZrNTA+. The measurements were made in 1 M HC1 with a total zirconium concentration of 5xlO4M. The authors expected that under these conditions, Zr4+
is present in solution chiefly in monomeric non-hydrolyzed form. The formation of H4L+ was not considered.
2708 CONMISSION ON EQUILIBRIUM DATA
The distribution ratioof a neutral complex such as an oxinate between an organic and an aqpeous phase can be changed by addition to the aqueous phase of a competing ligand such as NTA. The investigation of such two-phase equilibria between aqueous 0.1 M KC1O4 and chloro- form was used by Stary (63 S) for the determination of stability constants of NTA complexes with Ag, U02, Be2, Co2, Cu2, Pb2, Sc3, La3 and Ga3t From the ratio of the metal concentration
in the organic and in the aqueous phase in the absence of (q0) and in the presence of NTA (q) at known pH, the required values of 8 ( = [ML5(OH)t]/({MJ[L]s[OH]t)) were obtained. Such measurements were extended to a wide pH range and also involved a wide
q0/q
-1 = s=1 t=O s,t [L315[oW]t (XIII)
range of total concentrations of the components. The parameters q and q0 are generally de- termined using radioisotopes or spectrophotometrically. Possible extraction of other species can give rise to erroneous results. Nevertheless the values of Stary are generally in good agreement with other literature values.
Instead of extracting an uncharged species with a solvent, it is sometimes possible to extract
a metal ion using a cation exchange resin and by this method determine the con- centration of the metal ion in the aqueous solution. This procedure is especially efficient
if
a suitable radionuclide is available to allow the concentration of the metal ion to be determined by radiometric tracer analysis. Eberle and Wede (68 E) have determined the stability constants of the 1 : 1 and 1 : 2NTA complexes with Ce3, Cm3, Am3 and Cf3 usingequation XIV
in which q andq0 are the distribution ratios
of the metal ion between ion
l/q = (1 + + 2[LJ2)/q0
(XIV)exchanger
and solution in the absence and then in the presence of NTA. The ionic strength of the solutions at pH =2-4
was maintained at 0.1 N with NaC1O4 or NH4C104. The pK values used for H3NTA were obtained directly from measurements in solutions with I = 0.1(NaC1O4).
Although there are many possibilities for using a metal electrode to measure directly the concentration of a free metal ion, only a mercury electrode has been used to obtain the stability constants of mercury NTA complexes. The total metal and ligand concentrations were both equal to 2.5 l0 M; therefore 1 : 2 complexes with mercury(II) which may eventually
form cannot be detected. Shorik et al. (67 S) have measured the mercury(II) concentration in the limited pH range 2.6-2.85 at I =
0.l(NaC1O4)
and 25 °C obtaining log KHgL =14.60
±0.14.
The pK values for H3NTA of 51 S valid for 0.l(KC1) solutions are used. The same authors also used the mercury electrode to determine the stability constants of 1 : 1 com-plexes
with La3, Sc3 and Th4 (67 Sa) using an exchange reaction of type VII. Corrections3+ 4+
were made for hydrolysis of Sc and Th . The measurement, by proton n.m.r. spectroscopy,
Stability constants of NTA complexes 2709
of
individual concentrations of metal chelate from the peak heights of the signals for the protons of the respective species (and eventually of the free ligand) in a competitive equilibrium
of type VII was used by Merbach et al. (67 M) to determine the ratio of thestability constants of the NTA complexes involved (Pb2 -
Zn2
or Mo(VI) -W(VI)).
Becauseof the high total concentration of the components needed, the ionic strength was 1.3 M with- out further addition of inert salts. Paper electrophoretic mobility measurements can be
used to determine approximate stability constants. The electrophoretic mobility at a given free ligand concentration [L] can be expressed by equation XV ,
in
which u is the ionic mobility of ML(u0 =1).
In this way Jokl (64 J) has obtained the stability constants for[M] [ML]
[ML2] [ML3]
U= u
-+u
-+u
-_-+u
°
[M]
1 [M]t 2 [N] [M]tE u
[L]1= . (XV)
E . [L]'
2+ 2+ 2+
the NTA complexes of Mn , Co and Cu
3. THE STANDARD STATE
Measurements of ionic equilibria are generally made using solutions containing an inert salt which is present to maintain the ionic strength constant as far as possible. Under this condition the activity coefficients of the species investigated in such solutions will be almost constant. Complex formation between an anionic ligand and a cation will cause a change of the ionic strength, but if the concentrations of the complex partners are of the order of magnitude of 1% of the ionic strength this change can be neglected. This is
especially so if
the
exact value of the required ionic strength of the titrated solution is reachedat the middle of the buffer region under investigation.
To detect all possible equilibria in a given system large changes in concentration of the investigated components (by a factor 10 or more) are desirable. Because
millimolar solutions of the components can be considered to be very near to the limit of lowest concentration for reliable measurements, these changesin concentrations require an ionic strength of at least
1 M. For the measurements with NTA the ionic strength has normally been 0.1 M and therefore only data for simple equilibria (involving formation of mononuclear species) can be con-
sidered reliable. Only in more recent papers has an ionic strength of 1 M or more been used.
The inert salt is chosen such that its ions will not influence the equilibria present by forming complexes with the metal ion or the ligand under investigation. Potassium nitrate has normally been used as inert salt for NTA studies; the absence of a correction for this salt has been generally reflected by a lowering of the pK value for HNTA2 in comparison with the value obtained in the presence of a cation such as the tetramethylammonium ion (which presum-
2710 CONNISSION ON EQUILIBRIUM DATA
ably shows no association tendency towards NTA). In the presence of KC1, a logK1 value of 0.6 for K and in the presence of NaClO4 a log K1 of 1.22 for Na has to be considered. This corresponds for I =
0.1
M to a decrease of logK1 of approx. log (1+0.1 K1) =0.15
and 0.43, respectively. In the discussion and interpretation of equilibria one has sometimes to include the presence of these weak complexes.The standard state used is represented by the solution of the inert salt. Therefore the stability constants are normally not corrected for complex formation with the ions of the inert salt. Nevertheless some caution is necessary in reading the literature because in some papers such a correction has been made (64 I). In giving the ionic strength the following two conventions are used:
0.1 (KNO3)j I = 0.1 by addition of the inert salt shown in parentheses and 0.1 KNO3; I undefined but the concentration of KNO3 is constant at 0.1 M.
However,
in some papers there are insufficient
details given to distinguish between them.4. PROTONATION CONSTANTS
By
analogy with the practice for metal complex formation, for protonation equilibria one has to consider protonation constants which are formally the inverse of the corresponding acidity constants. The equilibria involved have to be investigated with the same instrumentation, techniques and conditions as those used for the evaluation of stability constants. The evaluation of protonation constants is important also if literature values for the used experimental condition are known. Unverified values can lead to wrong stability constants.
A millimolar solution of the uncharged ligand H3L is quite acidic and corresponds to a protonation degree forNTA of near 1.5. Data from titration
procedures allow determination of
the protonation (concentration) constants K1, K2, K3 and K4 with concentrations in mol dm3.
[HL] {H2L] {H3LJ {H4LJ
K1 =
;
K2 =;
K3 =;
K4 =—
[H][L]
[H][HLJ [H][H2L] [H][H3L]To obtain reliable values of K4,
the titration of H3L with a strong acid is usually necessary.
The solubility of H3L in the presence of strong acid is also adequate. Approximately 30
papers refer to independently determined protonation constants of NTA. From these, only two works report protonation constants for I -'
0
(thermodynamic constants). Their comparisonreveals large discrepancies in logK values of 0.37 for p =
1,
of 0.13 for p = 2 and of 1.38for p = 3. In relation to the discussion on pages 6,10 and 11, it seems that the data of 56
Hare more reliable and are therefore proposed as tentative values with an error which should
not exceed ±0.2
log units.For I = 0.1 with KNO3 and KC1 at 20 0C:
•923S
/LALP
aq
[H]
u
6usn peueqo
(oL8)SM
L3N
N
U
L3
iq
99ueAL6 onLI\
914j t7)1 •(
pu 6O
E)1)I
'O °t S.UO3
uewaet6
uL) p006(969)
u
;
(68)
pue;
(o13N)
S3= i
L i
o ot
SBflA
'PflJ osy
aq SflW
UWfl6A
suddoq3
seedde:eq
'uossnsp
eoq
o eq Map
pesn UI aAaM
paw
=
(so
'O13WI)
COW)I
PU
d
UIeq seni
A6UpioooV
eq
SapjOJ3aLa 6U.4OddflS
OM aq JO
MOS
OUOS
eW.AO3 UOP.44
q
UOeUOOAd
sadqUa
joaq
Jo SUWOAflSP8W '(Ydla
PUP viaa 'V!03H 'VIN 'V1a3) SPUe6.L
'.taoeo aq
•11spU6!.L
eLdws
o
aq:senn
d
o aq
u
peasqo aAo.qoaa SM
6uAoddns 'OL3N
S
PUP
£ON)I
UaaMaq
3DUaAOp
LqDp
ON,,
SeflLA Hd q6p.
eq
,cq LAO
eDUeJeJAeU
6U3ejJA
s
wnpew
eU!.L)JLe
u u o
S2UBWAflSOW
o
snse.1
o eq
peuu
e
(
i LL)
Uddoq3e
q6q e.nb
(sUop s
-uoD ewes
.AepUn)
eq
(L96)
uddoqj
q
pesn
pu ;eq
8flLA
sq
ueeeq
eOueej..p
e
eseq eqj SMOS pe).Aw c3Ude.A3Sp eqj eflleAO S66
.AO 1)1601eoe.Aeq
swees-dodd
O
icluo
eq
pUno
((N
eei
6'8
EL) '(3 1768 9L)'(3
EE6)
EL) L)1601JO
S3fl1A
eeL o U 8.00L
uos..dwo3peesu qM o eq eq enn io vo oj i
= spuodseuoDso (oL3w) o o cj.qs (jj) usuo
pezadxe
cq o
..teeu
o
eq sweesg
o
enA
iciuo eq
eJn.Aedwe
eweseq
si.s wn!.sseod
U
fl1A
6upuodse..uo3
eq Ueq
.AeMO1
o
eq pe3oedxes
o _1H
enje/\
eq
)1d'uoLew..1o xeldwoD
wnpos
o
esneoe
eqeuosenb
epnu6ew
s!.ewes
o eq
((;)
OL3H
Loo
wo
eceeqd
pue ue6o.Ap/cqwn!sseod
4M
uo.e.Aq1eo) ei
o
ELe
eneq
osj'
11i
-eALpedse.A
H
=e
senie
eq
Hd WO.Asnse
HdO H
2old
eq
wo..t
penei
e.AeM
suesuo3
uoepossp eq,
eieos
pue/c
A!4O eq
..40
sej.nq
qJM
Hduoezp.Ae
-pues) pep..ieDsp
iceepeww
ue
eqL 1
o
enie eqj
qe.Aepsuoo
..ej4p
ceq3
'(i nq
EL (013eN)
o
(EoNew) pue3
eieq ueeqpeqsqnd 9L6
EL)'(3 6Y6 o9) '( 966 L) '
J0
(0L3eN)
= 1.0 1)1601
i
O
5fl1PA ee.Aqj pesodo..id
s O
09senien
o eq uoieiodeui
sene..Aedwe e .Aeqo
e
q6ue..s
nq
uo
ewes
1)1501
eq
O
uoeine
eq 0d
(i)8'o 601 =
(U981
= 601 E)1
N
=(1L6
601= 601 1)1
0
(is)(Eow)1)l.o
o
I
=:sefl[eA
6uLMo1[o
esodo.Ad
eq
e.Aoe.Aeq
e
ueo suewe..tnseew 6usn5JOMOD
6un..q pue
o
J.AOM
eq
wo.A
eqeLene
5
een
/cLUO euo
3
(Eow)1)L.o
pe
e
= )16oL.AOJ
un
80
601ueq
q
enen pepedxe
eq
wo..j 1)1601
esneeq pepeçe.A
o
eq e.e L9 I3 O
o u eq npe
ejes pueeq
uoeuoo.Adsuesuo
e.Ae pexiwsuesuoD eqj senien e
epew
uoe.Aqe3 eq
sq ese
u
'ef nq U
9Luen!6 51
1)1501
enjen
.AO.Aews
e.Anpeo y
.-o.Ad
ee.do.1dde cq
uepeue no eq
seMo
uoezp.Aepue2s
eq
esneeq .Aeep
OU
s
cDuede.nsp
sq o
uosee.A
exe
eqj
senlen
eqo
o eq
pedse.A
qM
q6.q
oo
'icieweu
VIU3
o
eq o
.Ao.LAe sMoqs
e
g)
(w.Ae)1.AOMOJ
eiieo
pue 1)1501o
enien
.AOeq
L9 (v
'i
's 99 's
s
9L1 6) 61
pueuee;eq
E)1
sei
601
L9 (v
'I
'S 99 'S 99
L93 6) 6Y3
pueueeeq
se
601
L9 (v
'i
'
99 09 99 'S6)
's696 EL6
pueueeeq
se
601 1)1
ILLZ
sxiduioz
o
susuoo
2712 COMMISSION ON EQUILIBRIUM DATA
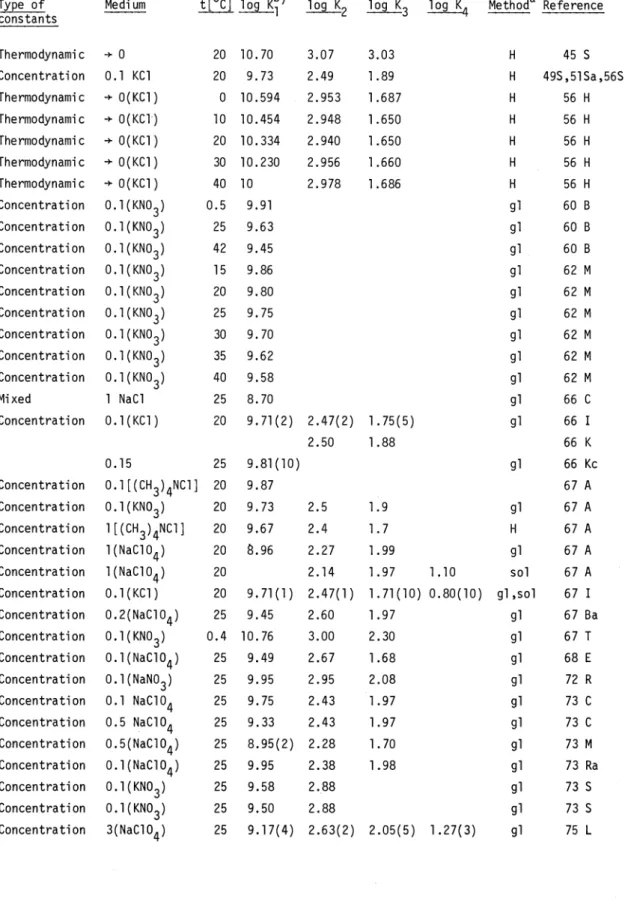
TABLE 1. Protonation constants of NTA (see
page 2710)
Type of constants
Medium t[°C] log log K2 log K3 log 1(4 Methoda Reference
Thermodynamic
÷ 0
20 10.70 3.07 3.03 H 45 SConcentration 0.1 KC1 20 9.73 2.49 1.89 H 49S,5lSa,56S
Thermodynamic
÷ 0(KC1)
0 10.594 2.953 1.687 H 56 HThermodynamic
+ 0(KC1)
10 10.454 2.948 1.650 H 56 HThermodynamic 0(KC1) 20 10.334 2.940 1.650 H 56 H
Thermodynamic
+ 0(KC1)
30 10.230 2.956 1.660 H 56 HThermodynamic
÷ 0(KC1)
40 10 2.978 1.686 H 56 HConcentration Concentration Concentration Concentration Concentration Concentration Concentration Concentration Concentration Mixed
0.l(KNO3) 0.l(KNO3) 0.l(KNO3) 0.l(KNO3) 0.l(KNO3) 0.l(KNO3) 0.l(KNO3) 0.l(KNO3) 0.l(KNO3)
1 NaCl
0.5 25 42 15 20 25 30 35 40 25
9.91 9.63 9.45 9.86 9.80 9.75 9.70 9.62 9.58 8.70
gl gl gl gl gl gl gl gl gl gl
60 B 60 B 60 B 62 M 62 M 62 M 62 M 62 M 62 M 66 C Concentration 0.l(KC1) 20 9.71(2) 2.47(2) 1.75(5) gl 66 I
2.50 1.88 66 K
Concentration Concentration Concentration Concentration Concentration Concentration
0.15
0.l[(CH3)4NC1]
0.l(KNO3) l[(CH3)4NC1]
l(NaC1O4) l(NaClO4) 0.l(KC1)
25 20 20 20 20 20 20
9.81(10) 9.87 9.73 9.67
.96
9.71(1) 2.5 2.4 2.27 2.14 2.47(1)
1.9 1.7 1.99 1.97 1.71(10)
1.10 0.80(10)
gl
gl
H
gl sol gl,sol
66 Kc 67 A 67 A 67 A 67 A 67 A 67 I Concentration
Concentration Concentration Concentration Concentration Concentration Concentration Concentration Concentration Concentration Concentration
0.2(NaClO4) 0.l(KNO3) 0.l(NaC1O4) 0.l(NaNO3) 0.1 NaClO4 0.5 NaC1O4 0.5(NaC1O4)
0.1(NaC1O4) 0.1(KNO3) 0.1(KNO3) 3(NaC1O4)
25 0.4 25 25 25 25 25 25 25 25 25
9.45 10.76 9.49 9.95 9.75 9.33 8.95(2) 9.95 9.58 9.50 9.17(4)
2.60 3.00 2.67 2.95 2.43 2.43 2.28 2.38 2.88 2.88 2.63(2)
1.97 2.30 1.68 2.08 1.97 1.97 1.70 1.98
2.05(5) 1.27(3) gl gl gl gl gl gl gl gl gl gl gl
67 Ba 67 T 68 E 72 R 73 C 73 C 73 M 73 Ra 73 S 73 S 75 L
Stability constants of NTA complexes 2713
a: H: H electrode; gl: glass electrode; sol: solubility b: In parentheses the standard deviation of the last digits.
5. METAL COMPLEX FORMATION
The formation of NTA metal complexes is characterised by the following equilibria:
K1 = _______
[M][L]
[ML2]
(2=
[ML]
[L]
[ML2]
82 K1K2 = 2
[M][L]
[MHL]
MZ+
+L3 +
H+MHL(2Z)
MHL =[M][H][L]
[M(OH)L]
MZ+ +
L3 + OW '
M(OH)L4 M(OH)L = ________
[M][OH] [L]
The unit of concentration for the terms in brackets is mol dm3.
The stability constants are given in the same order as that used in the Stability Constants Publications, Inorganic Part, based on the Periodic System. For each group a nearly complete list of all published values is given. They are presented in tables with inclusion of further information in six columns: metal ion, medium, temperature, values of the constants (in theses
the standard deviation of the last digits), method and reference.
The medium in which the equilibrium constants were measured is normally water, to which a certain
quantity of inert salt was added: its concentration or the corresponding ionic strength is given on the basis of the literature in one of the following ways:PAAC 54:12 -BB Type of cons tants
Medium t[°C] log log K2 log K3 log j Methoda Reference
Mixed
O.ll(KNO3) 20 9.82 2.74 1.61 gl 75 Va
Concentration
O.5(NaC1O4) 25 8.94(2) 2.28(2) 1.86(2) 1.6(1) gl 76 C Concentration
O.l(KNO3) 25 9.65 2.48 1.84 gl 76 H
Concentration
l(NaC1O4) 25 8.92 2.41 1.81 1.39 gl 76 Y
Concentration
O.5(KNO3) 25 9.57(1) 2.64(4) 1.57(6) gl 77 G
[ML]
MZ+
+ L3 Z ML3
ML3 + L3 " ML26)
MZ+ + 2L3
ML26
2714 COMMISSION ON EQUILIBRIUM DATA
÷
0 (KC1) constant extrapolated to zero ionic strength from measurementsin KC1 solutions
0.l(KC1)
ionic strengthequal
0.1 by addition of KC10.1 KC1 constant concentration of KC1 equal to 0.1
0.1 ionic strength equal to 0.1 mol dm3 without indication of the inert salt used
The method used is given by the following symbols:
H H electrode (pH method) pol polarography
gl glass electrode (pH method) sol solubility dis distribution between two phases tp electrophoresis nmr nuclear magnetic resonance Hg mercury electrode
sp spectrophotometry red redox electrode
ix ion exchanger M metal electrode
chrom chromatography (paper) est estimated
If the direct method is not used, the type of equilibrium involved is indicated on the basis of those listed in chapter 2. For instance, pH measurements can be used to obtain the stability constants of complexes of a given metal ion in the following different ways:
z+ +
3-
i)
competition
between M and H for L (direct pH method)ii) competition between M, Hfor L3 and an auxiliary ligand (see page 2700,
III)
iii)
competition between N ,, H
for L and an auxiliary ligand (see page 2700, V).For the three cases the method is indicated by:
i) gl ii) gl, III iii) gl, V.
On
the basis of a critical discussion on the results and on their measure and calculation is selected a list of the more reliable values (75 W).
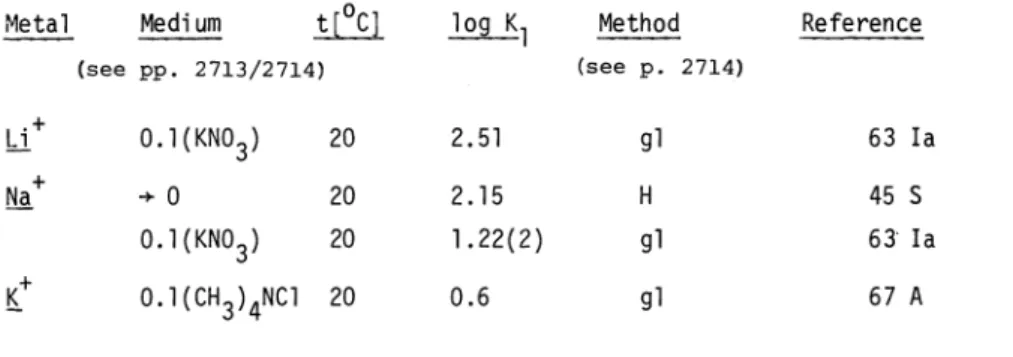
5.1 Complex formation with alkali ions
As yet, the association with alkali ions has not been investigated sufficiently to yield re- liable data. This is due to the fact that the stability constants are small and not easy to obtain accurately. For many purposes they can be neglected. The data should be considered as only tentative for the standard state given. For instance, the values of 63 Ia (Table 2.1) were obtained at I =
O.l(KNO3) and that of 67 A at O.l((CH3)4NC1). Note that the value for Na in KNO3 is four times higher than that for K in (CH3)4NC1. Log K1 with Na in this medium is
expected to be approximately 1.45. As might be expected from an electrostatic model, the
value of K1 decreases as the radius of the cation increases.
Stability constants of NTA complexes 2715
TABLE 2.1 Stability constants of group a cations (For definitions see pages 2713/2714)
Metal Medium t[°C]
log K1 Method Reference
(see pp. 2713/2714) (see p. 2714)
Li
0.l(KNO3) 20 2.51 gl 63 Ia÷0
20 2.15 H45S
0.l(KNO3) 20 1.22(2) gl 63 Ia
0.l(CH3)4NC1 20 0.6 gl 67 A
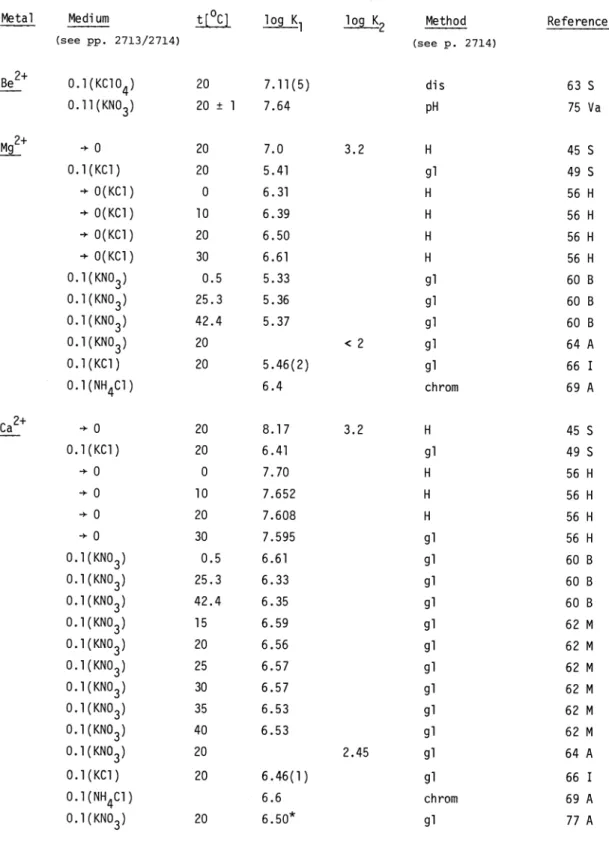
5.2. Complex formation with alkaline earth cations
For the cations Mg2+ to Ba2+ we can discuss the results of two different groups determined under the same experimental conditions. Both sets are in good agreement and this permits recommended values of log K1 to be given in all cases:
t[°C] I
Mg2 Ca2 Sr2 Ba2
20 0.l(KC1) 5.43 6.45 5.00 4.85
The interpolated values of 60 B for 0.l(KNO3) are 0.08, 0.06, 0.1 and 0.1 lower with respect to the above values. As first found by Schwarzenbach, 1 : 2 complexes M(NTA)24 are also formed but the stability constant K2 is low. At I =
0.l(KNO3)
for Ca2, log K2 =2.45
(20 °C) and for the other cations the value is <2.
In the case of Be2+, the two values are quite different:for 75 Va the inappropriate standardization has already been discussed when treating protonation. The error in pH is almost compensated in the determination of the stability constant because this
last quantity depends mainly on the pHdifference. The
stability
constant was obtained using 8points in the pH range 3.5 - 4.2 giving a value with
7% standard deviation "Turbidity due to beryllium(II) hydroxide appears on increasing the basicity of the solution"; therefore probably hydrolytic products
are also present in the pH range investigated. This can lead to a K1 value which is too high. From distribution
measurements of beryllium(II) between a 0.5
M oxine solution in CHC13 and an aqueous NTA (0.01
M) solution at 0.1 M (KC1O4), Stary obtained a much lower K1(lower
by a factor of approximately3). In this case, because of the large excess of ligand, hydrolytic reactions should not take place. One is therefore tempted to discard the value of 75
Va and to consider thevalue of 63 S as more reliable. However, there still remain some questions concerning this
paper because it would be very difficult to discern the formation of mixed complexes from measurements at only one total ligand concentration. Further, the fact that the maximum amount of beryllium oxinate complex extracted by CHC13 represents only 83 and not100% was not explained. From nephelometric (turbidity) measurements Callis et al. (69 C) have postulated the formation of Ca2(NTA) with [Ca2L]/([Ca] [CaL]) = The corresponding equilibrium should be observed by investigation of a mixture in which protonated ligand is in excess: but unoer these conditions only CaL was detected (77 A).
2716 COMMISSION ON EQUILIBRIUM DATA
TABLE 2.2. Stability constants of group 2a cations (For definitions see pages 2713/2714)
Metal Medi urn
(see pp. 2713/2714)
t L°] log K1 log K2 Method
(see p. 2714)
Reference
B2
O.l(KC1O4) 0.ll(KNO3)20 20 ± 1
7.11(5) 7.64
dis pH
63 75
5 Va
M2 ÷ 0
20 7.0 3.2 H 45 S0.l(KC1) 20 5.41 gl 49 S
+ 0(KC1)
0 6.31 H 56 H+ 0(KC1)
10 6.39 H 56 H÷ 0(KC1)
20 6.50 H 56 H+ 0(KC1)
30 6.61 H 56 H0.1(KNO3) 0.l(KNO3) 0.l(KNO3) 0.l(KNO3) 0.l(KC1)
0.5 25.3 42.4 20 20
5.33 5.36 5.37
5.46(2)
< 2
gl gl gl gl gl
60 60 60 64 66
B B B
A
I
0.l(NH4C1) 6.4 chrorn 69A
Ca ÷ 0
20 8.17 3.2 H 4550.l(KC1) 20 6.41 gl 495
÷o
0 7.70 H56H
-'-0 10 7.652 H
56H
÷0
20 7.608 H56H
÷0
30 7.595 gl56H
0.l(KNO3) 0.l(KNO3) 0.l(KNO3) 0.l(KNO3) 0.l(KNO3) 0.l(KNO3) 0.l(KNO3) 0.l(KNO3) 0.l(KNO3) 0.1(KNO3)
0.5 25.3 42.4 15 20 25 30 35 40 20
6.61 6.33 6.35 6.59 6.56 6.57 6.57 6.53 6.53
2.45
gl gl gl gl gl gl gl gl gl gl
60 60 60 62 62 62 62 62 62 64
B B B M M M M M M A
0.1(KC1) 20 6.46(1) gi 66 I
0.l(NH4C1)
0.l(KNO3) 20
6.6 6.50*
chrorn gl
69 77
A A