Arabidopsis thaliana
I n a u g u r a l – D i s s e r t a t i o n
zur
Erlangung des Doktorgrades
der Mathematisch-Naturwissenschaftlichen Fakultät
der Universität zu Köln
vorgelegt von
Andrea Faust
aus Leverkusen
2006
Prüfungsvorsitzender: Prof. Dr. Ulf-Ingo Flügge
Tag der mündlichen Prüfung: 29.05.2006
1. Introduction... 1
1.1. Biosynthesis of long chain fatty acids ... 2
1.2. Mutants with a defect in cutin biosynthesis... 3
1.3. Mutants with a defect in wax biosynthesis ... 6
1.4. Mutants with a defect in wax and cutin biosynthesis... 9
1.5. Analysing wax and cutin ... 12
1.6. Aim of the work... 16
2. Materials and Method ... 17
2.1. Chemicals, enzymes, media, buffers and solutions ... 17
2.2. Bacteria and Plasmids ... 17
2.2.1. Preparation of chemo-competent E. coli cells (Hanahan, 1983)... 17
2.2.2. Transformation of chemo-competent E. coli cells ... 18
2.2.3. Preparation of electrocompetent A. tumefaciens... 18
2.2.4. Electroporation of A. tumefaciens cells... 19
2.3. Plant material... 19
2.3.1. Cultivation of A. thaliana... 19
2.3.2. Cultivation of O. sativa... 19
2.3.3. In planta transformation of A. thaliana... 19
2.3.4. Histochemical staining of O. sativa... 20
2.3.5. Insertionlines ... 20
2.3.6. Selection of transgenic plants on grodan mats ... 20
2.4. Isolation of genomic DNA using the CTAB method ... 20
2.5. Isolation of plasmids ... 20
2.6. Cloning strategies ... 21
2.7. Plasmid DNA cleavage by digestion with restriction endonucleases ... 21
2.8. Isolation of RNA of plants ... 22
2.9. Semi-quantitative RT-PCR ... 22
2.10. Isolation of DNA fragments from agarose gel ... 22
2.11. Primers... 23
2.12. Polymerase chain reaction... 23
2.13. DNA sequencing and sequence analysis... 23
2.14. Map based cloning ... 23
2.14.1. Generation of recombinants ... 23
2.14.2. DNA isolation in 96 well plates ... 24
2.14.3. Databases for SNP... 24
2.14.4. PCR for map based cloning... 24
2.14.5. Separation with denaturing HPLC ... 24
2.14.6. Analysis of data ... 25
2.15. Biochemical analyses of lipids... 25
2.15.1. Wax analysis ... 25
2.15.2. Bound Lipid Analysis ... 26
2.15.3. Chemical degradation of polyesters ... 26
2.15.4. Depolymerisation with methanolic-HCl ... 27
2.15.5. Depolymerisation with borontrifluorid in methanol ... 27
2.15.6. GC and GC-MS analysis of depolymerisation products... 27
2.15.7. Seed coat analysis ... 28
2.16. Microscopy imaging ... 28
2.16.1. Light Microscopy... 28
2.16.2. Scanning electron microscopy... 28
3. Results... 30
3.1. Analysis of cutin in A. thaliana... 30
3.2. Analysing mutants: Cutin analysis and related experiments... 31
3.2.1. Cutin and wax analysis of ace... 32
3.2.2. Cutin analysis of bdg... 34
3.2.3. Cutin analysis of FDH::FAE... 37
3.2.4. Analysing pel3... 38
3.3. Analysing cer10... 41
3.3.1. Morphological and cuticular defects associated with the loss of the cer10 function ... 41
3.3.2. Biochemical analysis ... 48
3.3.3. Alpha hydroxylation ... 51
3.4. Analysing cer13... 53
3.4.1. Morphological and Cuticular defects associated with the loss of the cer13 function ... 53
3.4.2. Mapping... 55
3.4.3. Biochemical analysis of cer13... 56
3.5. Analyses on cer3... 58
3.7. Analysing wt exposed to drought stress ... 63
4. Discussion... 65
4.1. Cutin ... 65
4.2. The method for cutin analysis... 65
4.3. Alternative analyses: of seed coat lipids, wax and suberin ... 69
4.4. Mutants with a defect in the cutin biosynthesis... 70
4.5. Mutants with a defect in wax and cutin biosynthesis... 73
4.6. Biochemical plasticity of plant cuticles ... 78
5. Summary ... 84
6. Zusammenfassung ... 86
7. References ... 89
Danksagung: ... 104
Erklärung:... 105
Teilpublikationen: ... 106
Lebenslauf:... 107
1. Introduction
When plants conquered land around 500 million years ago, they acquired a protection against dangers in the aerial environment. As plants are not mobile, the protection had to be effective and rapidly inducible. Specific dangers for land plants can be divided into two categories: abiotic and biotic stresses. Among others biotic stresses consist of attacks by various viral and fungal pathogens for which plants developed various defence systems. Abiotic stresses include water stress, salt stress, intoxication and UV irradiation. As a strategy to withstand these various stresses plants developed a protective coating, which only made the move from aquatic to terrestrial environment possible. A characteristic feature of land plants is the deposition of a protective layer on top of the outermost cell wall on all aerial organs. This protective layer is called cuticle (Fig.1). It mainly consists of cutin, cutan and waxes. Cutin is a polyester containing hydroxylated and epoxylated long chain fatty acids while cutan is a very thin fraction that is non-hydrolysable and not yet characterised. Cuticular waxes are found on the outermost side of the cuticle. They consist mainly of long chain fatty acids, their esters, alcohols, aldehydes and ketones which form different forms of crystals. In addition to the cell wall, the cuticle provides a barrier against invasions from the external environment.
Fig.1. Classical model of the cuticle.
The cuticle comprises the cuticle membrane and the cutinized portion of the cell wall. It covers the underlying cell wall that tops the epidermis cells. Epicuticular waxes are found on the outer extremity and they form different crystal arrangements and are imbeded in the cuticle. (e- epidermis, cm-cuticular membrane, cw-cell wall, c cw-cutinised cell wall, cu-cuticle, ew- epicuticular waxes, iw-intracuticular waxes)
1.1. Biosynthesis of long chain fatty acids
Fatty acids with more than 18 carbon atoms are termed very long chain fatty acids (VLCFA) and they have a wide range of pivotal functions (Leonard et al., 2004). The majority of VLCFA are destined for the outer surface of the epidermis to become a part of the cuticle and wax layer. In plants, VLCFAs are synthesised in the epidermis by the microsomal fatty acid elongation (FAE) system. In this complex, units of two carbon atoms of malonyl-CoA are attached to preexisting C16 or C18 fatty acids that were produced de novo in the plastids by the fatty acid synthase (FAS) pathway.
The enzymatic reaction in one round in the FAE complex consists of 4 steps. Firstly the malonyl-CoA is condensated with a long-chain acyl-CoA by a !-keto-acyl- synthetase. Secondly, the product from the first step is reduced to !-hydroxyacyl- CoA. In the third step the product from step two is dehydrated to an enoyl-CoA to be then reduced in the fourth step, resulting in the elongated acyl-CoA. The whole process is termed elongation. Multiple genes and the corresponding mutants have been identified in this pathway. Mutations in those genes inhibited wax formation or accumulation of seed triacylglycerols (Fiebig et al., 2000; Hooker et al., 2002; Millar et al., 1997).
In the Arabidopsis thaliana genome, 21 !-ketoacyl-synthetase-like genes or
“elongases” have been identified (Lechelt-Kunze et al., 2003; Kunst et al., 2003). The variety of elongases can be explained by the requirement of tissue specific functions and substrate specificities and that elongases produce different products at different developmental stages. Substrates can differ by chain length or saturation state.
Several examples are described in the literature. The FAE1 gene is expressed in seeds and the fae1 mutant yields a change in the chain length of seed storage lipids but no wax phenotype. FAE1 is part of the VLCFA elongation complex in the membranes of the endoplasmic reticulum (ER) (James and Dooner, 1991; Kunst et al., 1992; James et al., 1995; Millar and Kunst, 1997). The major !-keto-acyl- synthetase involved in wax biosynthesis in Arabidopsis is CER6 (Millar et al., 1999;
Hooker et al., 2002). FIDDLEHEAD (FDH), a homologue to FAE1 and CER6, is putatively involved in cutin biosynthesis. FDH is expressed in the epidermis of young organs (Yephremov et al., 1999). The fdh mutant exhibits a strong organ fusion
phenotype, suggesting that the cuticle may be affected, but the function of the enzyme is not yet understood.
To produce wax and cutin precursors, the VLCFAs undergo further reactions after the elongation but the pathways and locations are not completely resolved yet.
1.2. Mutants with a defect in cutin biosynthesis
Several genes have been cloned that are involved in the formation of the cuticle in Arabidopsis thaliana (Yephremov and Schreiber, 2005). Some of them seem to encode enzymes playing a role in the lipid metabolism: FDH, LCR, WAX2/YRE, LACS2, ACC1, and ATT1 (Yephremov et al., 1999; Pruitt et al., 2000; Wellesen et al., 2001; Chen et al., 2003; Kurata et al., 2003; Baud et al., 2004; Schnurr et al., 2004; Xiao et al., 2004). However their functions in the cutin biosynthesis still need to be defined.
In 1998, Lolle et al reported the isolation and characterisation of 29 independently derived mutants with mutations causing organ fusions in Arabidopsis.
The mutants could be divided into complementation groups corresponding to nine loci (airhead, bulkhead, conehead, deadhead, cer10, fiddlehead, hothead, pothead and thunderhead). The hothead gene was later mapped by Krolikowski et al (2003) to the location of ADHESION OF CALYX EDGES (ACE) that was briefly described previously (Nakatane et al., 1998). In a phylogenetic analysis Krolikowski et al (2003) discovered that there are seven homologues of ACE/HTH which they called HOTHEAD-LIKE 1-7 sharing amino acid identity in the range of 40 to 60 %.
Expression analysis was carried out on HTH by Krolikowski et al (2003) using RT- PCR, and they showed that the HTH gene is highly expressed in leaves, stem and inflorescences but also expressed in roots. In the same article, the authors reported in situ hybridisation studies in which the hybridisation of the HTH probe does not only occur in the epidermis but also in all sub-epidermal tissues and all floral organs. The author concluded that HTH has a general function and is not involved solely in cuticle synthesis. Sequence similarity searches showed that ACE/HTH contains GMC oxidoreductase domains and that the closest homologue was characterized as a mandelonitrile lyase (MDL). MDL is one of four enzymes responsible for the
catalyses the last step in the degradation of diglucosides to HCN, glucose and benzaldehyde (Poulton et al., 1993). Despite these sequence similarities the function of ACE/HTH remains unknown.
Moreover, Lolle et al (2005) claimed that the fundamental tenet of classical mendelian genetics is not true for the hth mutant. The authors reported that homozygous hth mutants after self-fertilisation revert to heterozygous plants with a frequency of 10-1 to 10-2 revertants per chromosome per generation. Approximately 10 % of the progeny were revertants. They proposed that this process is template- directed as the sequence change is the very specific reversion to the wt sequence.
The authors’ model stated that stable RNA, likely in a double stranded form, can be replicated and transmitted over generations, and is likely being inherited via pollen. In this way it can restore the sequence information cached from previous generations.
This phenomenon can be observed on other mutants but can only be seen in the hth background as these mutants are put under an indirect stress due to the absence of the HTH gene product. Other scientists tried to explain the hth phenomenon differently (Comai and Cartwright, 2005; Chaudhury, 2005). Comai and Cartwright state that there are two components that lead to the reversion of the HTH mutations:
firstly that the mutant accumulates toxic or rather mutagenic compounds which lead to a higher variation rate in its genome and secondly that there is an early selection for the HTH revertant alleles as there is no accumulation of toxic compounds.
Additionally, early revertants have fewer deleterious mutations in the genome that is the reason why they are detectable. To explain why small fragments of RNA are able to repair the hth and other mutations, Chaudhury (2005) proposed that very short homologous sequences in the genome are responsible for the production of these RNAs and that the mismatches generated by these RNAs are normally corrected by mismatch repair. Ray (2005) stated that extra chromosomal DNA fragments are archived in a way that they cannot be detected by DNA hybridisation or PCR. These fragments might then be restricted to meristematic cells only and therefore be present in undetectable concentrations in classical experiments. However, the question how the non mendelian passing on of information in hth works still needs to be unraveled as well as the molecular function of the HTH gene.
Other genes appeared to be indirectly involved in the biosynthesis of the cuticle components based on sequence similarities and expression patterns: ALE1, ACR4, WIN1/SHN and PAS2/PAP (Tanaka et al., 2001, 2002; Bellec et al., 2002;
Haberer et al., 2002; Aharoni et al., 2004; Broun et al., 2004; Watanabe et al., 2004).
Phenotypes of these mutants are pleiotropic including cuticular defects, growth abnormalities, an increased sensitivity to chemicals, an altered resistance to pathogens, occasional distorted cell differentiation and cell death (Yephremov and Schreiber, 2005). Two Arabidopsis mutants, one expressing a fungal cuntinase from Fusarium solani f sp. pisi a (Sieber et al., 2000) and the lcr mutant that carries a mutation in cytochrome P450 CYP86A8 (Wellesen et al., 2001), exhibited a cell wall phenotype besides the cuticle phenotype. They demonstrated morphological irregularities in the shape of organs and single cells similar to those in known cell wall mutants as radial swollen (rsw) (Williamson et al., 2001). More cuticular mutants were identified in different collections of A. thaliana lines (Lolle et al., 1998; Tanaka et al., 2004) and not all exhibit organ fusion.
Tanaka et al (2004) screened for mutants with an accelerated penetration phenotype. The author applied toluidine blue solution to leaves. When this cationic dye penetrates the cuticle and binds to the anionic polysaccharides and pectins of the cell wall it can no longer be washed out and the tissue turns blue. Tanaka applied toluidine blue staining to a selection of mutagenised plants and selected those in which the dye stained the cell wall faster than in the wild type (Tanaka et al., 2004).
From this selection of the permeable leaves mutants (pel), pel3 was mapped and molecularly identified by Tanaka et al (unpublished data, personal communication).
The pel3 gene shows homology to transferases but its function remains unknown.
Despite the accelerated penetration of the dye through the cuticle, the pel3 mutant exhibits no obvious cuticle phenotype on leaves but occasionally strong deformations and fusions in the flower. On approximately every second plant the inflorescences show fused petals and fusions involving multiple organs. Ubiquititous PEL3 gene expression was found by using ‚genevestigator’ (Zimmermann et al. 2005), in shoots, in the flower (petal, sepal, siliques, seeds-only stage 6), in young rosettes.
Another fusion mutant is bodyguard (bdg). The lines bdg-1 and bdg-2 mutants
transposon Enhancer/Supressor-mutator (En/Spm) (Kurdyukov et al., 2006). The bdg mutant has a strong cuticular phenotype displaying leaf fusions. This can be seen on transmission electron microscopy images (TEM) in the formation of multilayered structures instead of a thin-layered cuticle and patches with no cuticle at all (Kurdyukov et al., 2006). The BDG gene has been cloned by transposon tagging. It encodes an "/!-hydrolase fold containing protein of unknown function. It has been shown that BDG is expressed in the epidermis. This expression pattern has been assesed by GFP and GUS-fusions, in situ hybridisation analysis and also with immunolocalisation experiments in which the BDG protein was detected in the inner part of the outer epidermal cell wall (Kurdyukov et al., 2006).
The connection between the different cuticle phenotypes is not yet clear and further investigations will be needed to completely enlighten the anabolism of cutin precursors, their transport, the mechanism of interconnection in and on the cell wall and the effects of different irregularities of the cuticle.
1.3. Mutants with a defect in wax biosynthesis
Generally, waxes consist of aldehydes, primary and secondary alcohols, alkanes, ketones and esters that are derived from saturated VLCFAs with predominant chain lengths from 20 to 34 carbons (Walton, 1990; Kunst and Samuels, 2003). Based on the composition of the waxes, a general model has been developed for the biosynthesis of the wax components (Fig.2) (Kunst and Samuels, 2003). The VLCFAs with even numbered chain lengths of more than 20 carbon atoms, coming from the FAE complexes are processed through two different pathways: the acyl reduction pathway and the decarbonylation pathway (Fig.2). In the acyl reduction pathway the VLCFAs are reduced to primary alcohols by acyl reductases. As intermediates of this reaction VLC aldehydes are formed which stay bound to the enzyme and do not appear in a free form. In the last step of this reaction the primary alcohols and the VLCFAs form esters with the help of acyl-CoA:alcohol- acyltransferases. In the decarbonylation pathway the VLCFAs are reduced to aldehydes by an acyl-CoA-reductase that is different to the one in the acyl reduction pathway. These acyl-CoA-reductases release the aldehydes and these free aldehydes are substrate for the next reaction. In this next step aldehyde
dehydrogenases catalyse the production of alkanes by cleaving carbon monoxide from the aldehyde. These alkanes with an odd number of C-atoms in their carbon chains are hydroxylated and further oxidized to secondary alcohols or ketones.
Known enzymes involved in these pathways and in the transport and regulation of these pathways are listed in Table.1.
Figure 2. Putative pathway for biosynthesis of waxes (Millar et al., 1999).
In Arabidopsis, 22 loci are considered to be involved in the wax biosynthesis (Dellaert et al., 1979, Koorneef et al., 1989). The mutants accumulate less wax, exhibit greener stems, siliques and occasionally greener leaves when compared to the wild type. They are called eceriferum (cer) and were produced by irradiation with x-ray and EMS mutagenesis (Dellaert et al., 1979; Koorneef et al., 1989). SEM was performed on the stems of the mutants and revealed differences in the wax layer in comparison to the wild type. Further, it was reported that some cer mutants have a reduced size and reduced fertility, especially cer10 and particularly some mutants under low humidity conditions (cer1, cer3 and cer6) but it was not tested further. In 1993, Preuss et al showed that this reduced fertility phenotype is caused by the erosion of the pollen tryphine layer owing to the absence of pollen surface waxes.
Other model plants revealed different numbers of loci involved in wax biosynthesis. In barley 84 loci are known to regulate the wax biosynthesis (Sogaard and von Wettstein-Knowles, 1987 and von Wettstein-Knowles, 1993). In maize, 20 loci were found to be involved in wax production and transport. Due to the glossy appearance of their mutants they are termed glossy 1-20 (Schnable et al., 1994).
Some wax mutants in maize have been characterised in more detail, for example:
glossy1 (Sturaro et al., 2005), ad1 and cr4.
In Oryza sativa no wax mutants have been reported yet although wax analyses have been reported in rice. These were mainly conducted on different rice varieties as the wax load has been reported to be an adaptive characteristic for the drought resistance (O’Toole and Cruz, 1983). Among rather usual wax components, large amounts of aldehydes have been mentioned to be contained in the rice waxes (Welker et al., 1998; Haas et al., 2001). These were reported to occur in a polymeric form as aggregates of “aldehyde clusters” (Welker et al., 1998; Haas et al., 2001).
Overall, only some of the Arabidopsis cer genes have been identified (Table 1).
Table 1. CER genes with known functions
Function Refercence
CER1 decarbonylase Aarts et al., 1995
CER2 putative involvement in regulation of elongation
Xia et al., 1997
CER3 protein degradation Hannoufa et al., 1996
Eisner et al., 1998 CER4 alcohol forming fatty acyl-CoA reductase Kunst, L., 2005 CER5 ABC-transporter for wax export Pighin et al., 2004 CER6/CUT1 !-ketoacyl synthetase, condensing enzyme
of the elongase complex
Millar et al., 1999 and Hooker et al., 2002
CER10 enoyl CoA reductase Zheng et al., 2005 WIN1/SHINE1 ethylene response factor-type transcription
factor
Aharoni et al., 2004 and Broun et al., 2004
1.4. Mutants with a defect in wax and cutin biosynthesis
A few mutants have been reported to have both, an obvious wax deficit plus an organ fusion phenotype. In Arabidopsis, these mutants were cer10, cer13, wax1 and wax2 (Jenks et al., 1996), deadhead (Lolle et al., 1998) and in Z.mays adherent1 (Sinha and Lynch, 1998).
Zheng et al (2005) identified cer10 as At3g55360, which codes for an enoyl CoA reductase (ECR). In a reverse genetic approach, the authors found Arabidopsis lines with T-DNA insertions in the ECR gene exhibiting the same phenotype as cer10. In a complementation test it was demonstrated that ECR and CER10 are allelic. Green fluorescent protein-ECR revealed the reticulate network typical for the localisation in the ER in all examined organs, suggesting that ECR was especially localised in the ER membrane. This is similar to the location of TSC13p, the enoyl CoA reductase in yeast cells. Kohlwein et al (2001) suggested that TSC13p is a component of the ER and showed an enrichment in the vacuole-nuclear envelope sections which was similar to the location of the yeast ELO proteins, the condensing enzymes of the fatty acid elongation complex in yeast. The enoyl CoA reductase is supposed to catalyse the final reaction of VLCFA biosynthesis. In yeast, TSC13p has been identified to code for such an enzyme. It has been demonstrated that it is essential for yeast viability and that it catalyses a step in the fatty acid elongation cycle for acyl-CoA substrates of all chain lengths (Kohlwein et al., 2001). The orthologue was found in A. thaliana to be At3g55360 which was annotated as a gene similar to the mammalian steroid 5-alpha-reductase. Five homologues exist in the Arabidopsis genome, three of them are closely related to CER10/ECR (Costaglioli et al., 2005). Expression studies of the five homologues were carried out in eight days old A. thaliana seedlings, since Arabidopsis leaves carry the highest wax load per area unit at that age. Expression analysis revealed significant levels of transcript of At3g55360 and At5g16010 only. The expression of At5g16010 was significantly higher than of At3g55360 suggesting that the corresponding protein could play an important role at this stage of development (Costaglioli et al., 2005). Analyses of the wax composition on leaves and stems on cer mutants revealed that there was a shift of wax components to the longer chain lengths in cer10. In leaves this was mainly due to a reduction of the C29 alkane and the increase of C30 primary alcohol
and increased C30 primary alcohol levels was detected. The authors proposed a putative function of cer10 in the conversion of the C30 fatty acid to C30 aldehyde.
The discrepancy between the conclusion based on these wax analyses and the function of the known gene remains elusive but it may be due to the redundancy of the enoyl CoA reductase in Arabidopsis and compensation for the lack of CER10/ECR by the means of other metabolic pathways. Lolle et al. (1998) assayed the permeability of the cuticle for chlorphyll in cer10 using the chlorophyll leaching test. This test is based on extraction of whole tissues with ethanol and photometrical estimation of the extracted chlorophyll. The chlorophyll in cer10 leached out more rapidly than in the wild type and similar to other fusion mutants such as fdh. Another phenotype of cer10 was characterized by the reduction of cell size of epidermis cells on leaves and the less pronounced lobe structures of epidermal cells (Zheng et al., 2005). The Nicotiana benthamiana ECR (NbECR) was silenced by using virus- induced gene silencing (VIGS) (Park et al., 2005). This caused formation of necrotic lesions on young leaves and an abnormal leaf development with wrinkled leaves and irregularities in the shape. The leaves exhibited general defence responses like accumulation of large amounts of callose and expression of numerous defence genes (e.g.PR1a, PR1b). Analysis of saturated fatty acids revealed a reduction in fatty acids longer than C18 in plants with a disrupted NbECR expression. Also, these plants showed highly abnormal plasma and thylakoid membranes. The progression of the degeneration was indicated by loops and irregular surfaces of the membranes leading to the desintegration of the cell. It was proposed that the NbECR is more essential in N. benthamiana and provides most of the enoyl-CoA reductase activity for VLCFA synthesis whereas in Arabidopsis the loss of CER10/ECR can be partially complemented by other enzymes.
Another wax mutant that has been reported to show occasional organ fusions is cer13. Wax analysis has been carried out by Rashotte et al (2001). The leaves of cer13 show a general reduction in the wax load but without a change in the wax profile. On cer13 stems, a measurable reduction in all C29 components and increase in C31 alkanes and C30 primary alcohols was detected, meaning chain length distribution is shifted from shorter to longer chain lengths when compared to the wild type. The mutant cer13 resembles the wax phenotype of cer3 and cer7 (Jenks et al., 1995). For CER13 the authors proposed an involvement in the reduction of C30 fatty
acids to C30 aldehydes because the blockage of that pathway could explain the increase in chain length in cer13 wax components. An accumulation of C30 fatty acids leads to an increase in the reduction of these fatty acids to the C30 primary alcohol or the further elongated C32 fatty acids. These C32 fatty acids could be reduced to C32 aldehydes and decarbonylated C31 alkanes. The results of the wax analysis on stems supported this hypothesis. Still another possibility could be an involvement of CER13 in the release of the C30 fatty acid from its elongation complex. For all possible involvements in the wax biosynthesis there is more than one gene involved in the same process as CER13 because the mutation does not cause a complete loss of C30 aldehyde or downstream products.
The wax2 mutant was described in Kurata et al (2003) with the name yore- yore (yre). Yre-1 was isolated in an Arabidopsis population of T-DNA insertion lines that was screened for mutants defective in cell differentiation. This allele of wax2 exhibited smaller trichomes that showed a normal distribution and normal branching.
It showed a wax deficiency on stems which resembled the cer phenotype. Yre-1 exhibited reduced male sterility which could be recovered under high-humidity conditions. The abscission of siliques was delayed in yre-1. Additionally tissue adhesion was observed in leaves, flower buds, and in other flower organs.
Chen et al (2003) described the identification and characterisation of wax2 in a collection of 30000 insertion mutants, which they screened to identify lines with reduced visible glaucousness of the inflorescence stem. Further inspection of wax2 revealed that it did not only have a wax phenotype but it also exhibited organ fusions.
TEM of the cuticle showed a thicker but less opaque cuticle (151,7 nm in wax2 and 111,2 nm in wild type). The authors described a weight loss of 20,2 % of ZnCl2- isolated cuticles and wax2 stem cuticles compared to wild type. Wax crystals were reduced on wax2 as seen on SEM pictures, and the wax analysis showed a quantitative reduction of waxes on leaves (80,3 %) and stems (78,3 %) in wax2 when compared to the wild type. Organ fusions were reported for most aerial organs of wax2: leaves, sepals, flower buds, sepals and stems. Fusions only occurred within the same plant but never between two different plants. The male fertility was impaired but could be restored under high humidity conditions. Visual inspection of
stomatal index in wax2 was reduced by 17,4 % and on the adaxial side there was a reduction of 16 % when compared to the wild type. Further changes in the epidermis were a reduced stomatal index and increased density of pavement cells. Permeability changes were assayed on wax2 and the corresponding wild type by a chlorophyll leaching test that showed a higher rate of chlorophyll leaching in wax2 than in the wild type. The application of two herbicides (acifluorfen and paraquat) caused greater foliar injury in the wax2 mutant than in the wild type. Discoloration and wilting occurred more readily in wax2 which was likely due to a faster permeation of the herbicide molecules through the cuticle and the epidermis into the underlying tissue.
Not only these molecules could more readily permeate the cuticle but also the water transpiration rate was higher in wax2 in the dark as well as in the daylight, which according to the authors, excludes a defect in stomata closure.
As some wax phenotypes are not found without biochemical analysis, more fusion mutants with wax phenotypes will be found when their wax composition is analysed. One example is the bdg mutant which shows a severe fusion phenotype and no evident wax distortion. But wax analysis reveals that there is a greater accumulation of wax components (Kurdyukov et al., 2006). Apart from these known mutants with a fusion and wax phenotype, there are very likely others.
1.5. Analysing wax and cutin
The biochemical analysis of waxes is well established and usually performed using gas chromatography coupled to either a mass spectrometer (GC-MS) or with a flame ionisation detector (GC-FID). Hydroxyl containing compounds are rather unstable, cannot be well separated in GC conditions and need to be transformed into inert and stable derivatives, which lead to unequivocal mass spectra (Seibl, 1970). One frequently applied method for the derivatisation of wax components is the transformation of the hydroxylated compounds into their trimethylsilyl-ethers and - esters with N,O-bis(trimethylsilyl)trifluoracetamid (BSTFA).
Cutin has been analysed especially from plants with thick cuticles (Kolatakutty, 1981, 2001; Holloway, 1982). For the analysis, the celluloses had to be removed from the peeled cuticles first. This was achieved by digestion with pectinases and
cellulases. Then the cuticles were extracted with methanol/chloroform to extract all soluble lipids such as epicuticular and intracuticular waxes. The next step involved the depolymerisation by procedures cleaving ester bonds. Depolymerisation steps could be carried out using alkaline hydrolysis, transesterification with methanol containing boron trifluoride or sodium methoxide or by using a reductive cleavage with lithium aluminium hydride (Walton and Kolattukudy, 1972; Kolattukudy, 1981).
The liberated cutin monomers could than be derivatised similar as the waxes and also analysed by GC-MS and –FID to identify the cutin monomers by their characteristic fragmentation patterns (Walton and Kolattukudy, 1972) and determine quantitative amounts. Classical cutin components are fatty acids (C16 and C18), hydroxylated fatty acids (C16 and C18, saturated and unsaturated), di-hydroxy fatty acids (C18, saturated), hydroxy-epoxy fatty acid (C18) and tri-hydroxy fatty acids (C18). Minor amounts of VLCFAs are fatty alcohols, aldehydes, ketones, diacids as well as hydroxycinnamic acids.
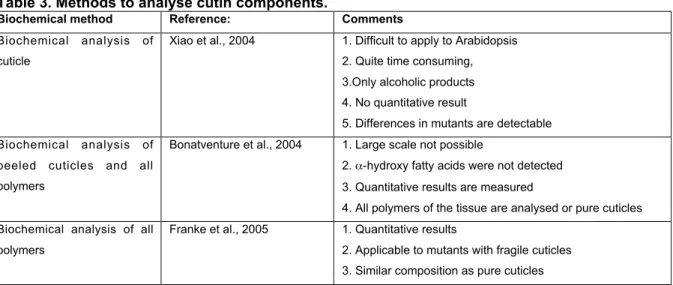
The application of known methods for the analysis of the very thin and fragile Arabidopsis cutin was not successful for a long time. Recent advances showed a novel approach to analyse cutin in A. thaliana (Xiao et al., 2004; Bonatventure et al., 2004; Franke et al., 2005). Xiao et al. (2004) described a method with which the stem cuticle was manually peeled of using forceps after estimating the area of the cuticle.
It was refluxed in chloroform/methanol (1:1) for 24 hours to get rid of all soluble material from the cuticle and then depolymerised the with 14% BF3 in anhydrous methanol to produce methyl esters which could then be extracted with diethyl ether as already described in Riederer and Schönherr (1986). Derivatisation was carried out using N, O-bis (trimethylsilyl) trifluoroacetamide and incubated for 30 min at 70°C. Samples were analysed on GC-FID. The analysis revealed for the Columbia wild type C16-diacid (49,3 %) and C16-10,16-dihydroxy-acid (16,4 %) as major components. Other compounds in the Columbia cuticle included: C18-diacid (11,8
%), C16-7 hydroxy-diacid (11,3 %) C17-9/10 hydroxy-acid (3,9 %), C16-w hydroxy- acid (3,2 %) and C15-9 hydroxy-acid (2,6 %). The total amount of cutin components on the Columbia stem surface was 0,491 !g cm-2 (+/- 0,0082).
A different approach in analysing A. thaliana cuticles was published by
and extracted prior to the depolymerisation instead of the preparation of cuticular membranes. The ester bonds were cleaved by hydrogenolysis with lithium aluminium hydride (LiAlH4) and the carboxy groups were reduced to their primary alcohols.
Other functional groups, such as aldehydes, ketones and oxiranes were reduced to their primary or secondary alcohols. Subsequent analysis was carried using GC-MS and revealed C16 and C18 polyhydroxy alkanes and alkenes as main hydrogenolysate products. The most abundant product in leaves was C18-(2)-1,18 diol. The polyester composition on stems resembleed the same components as on the leave extracted cuticles. To discriminate between the origin of the different hydroxyl groups the authors employed an isotopic labelling by deuteriolysis with lithium aluminium deuteride (LiAlD4) to the extracted tissues. With this method it was possible to distinguish from which part of the molecule the polyols derived from e.g.
the C18-(2)-1,18 diol derives primarily from C18-(2)-diacid, with smaller amounts arising from the corresponding #-hydroxylated fatty acid and very small amount from the #-oxo-fatty acid and 1, #-diol. Bonaventure et al (2004) applied another method on extracted leaves to verify the results of the hydrogenolysis and the deuteriolysis.
They used sodium methoxide (NaOCH3) in methanol for transmethylation of the cutin esters with subsequent silylation of the products. The major product in the leaf cuticle was the methylated C18-(2)-diacid and confirmed the results from their first analysis.
By comparison of the two methods they found out that the transmethylation method produced a more variable monomer content (up to 50 % variation) compared to the hydrogenolysis and deuteriolysis. To confirm that the analysed components were from the cuticle and not from underlying tissues the authors depolymerised epidermal peels from Arabidopsis stems without the extraction of soluble lipids. The result was similar to that obtained with stem and leaf residues but the waxes were obviously also seen. This indicates that the dicarboxylic fatty acids and other components analysed on totally extracted stems were primarily part of the polyester in the epidermis. The remains of the stem without the epidermis was also analysed and did not produce any detectable C16 or C18 polyhydroxylated aliphatic compounds when analyzed by GC indicating that all components mentioned above are associated with the epidermis.
The results for the cutin composition of Bonaventure et al (2004) contradict those of Xiao et al. (2004), who describe C16-diacids as the major component of the
Arabidopsis cutin. Whereas Bonaventure’s analysis revealed C18-(2)-diacid as the major cutin component. Both authors analysed cutin of stems: this discrepancy may therefore be due to the different ecotypes they analysed. Bonaventure analysed the Arabidopsis Wassilewskija-2 ecotype and Xiao Columbia.
The cutin biosynthetic pathway seemed to include hydroxylation and epoxidation steps (Kolatakutty, 2001). But the genes encoding enzymes in this pathway have not yet been unequivocally identified (Kolatakutty, 2001; Nawrath, 2002). Arabidopsis is a good model plant to study genes involved in the cutin biosynthesis as genetic and biochemical approaches can be combined. The screening for cuticular mutants in Arabidopsis is important to search for candidate genes that are involved in cutin biosynthesis. For mutant screening, the application of dyes to measure a change in the penetration rate in cuticular mutants (Tanaka et al., 2004) is the method of choice. Some cuticular mutants can be found as they show different responses to pathogens (Xiao et al., 2004; Nawrath et al., 2005) or organ fusions (Lolle et al., 1998). It is now possible to use reverse genetics and search for knock-out mutants in family members of genes that were already identified by forward mutant screening. Methods to analyse mutants with a putative defect in cuticle biosynthesis and detect the consequent defects in A. thaliana include checking for the obvious organ fusion phenotype, chlorophyll leaching, water evaporation tests, TEM and SEM imaging, the weighing of cuticles, staining with toluidine blue, application of herbicides, the test for pollen germination on non reproductive organs and the test for the response to the application of pathogens.
Tests for putative secondary effects include checking of morphological features such as measurement of the stomatal index, density of pavement cells or analyses on trichomes. The cutin composition analysis suggested fatty acid elongation, hydroxylation and epoxidation steps to be involved in the cutin biosynthesis but the localisation, the active sites and activities of putative enzymes that play a role in the cuticle biosynthesis need to be further scrutinized. Methods of choice include expression analyses (GFP/GUS promoter fusions, in situ hybridisation analysis), introduction of point mutations to check specific functions of the enzyme and expression with different promoters (e.g. epidermis specific, seed specific, inducible by antibiotics or ubiquitous expression with 35S). With the help of these tools, the
1.6. Aim of the work
Different approaches have been taken to understand cutin biosynthesis and the function of the cutin monomers. However, many questions still remain unsolved.
Analysis of cutin lead to the knowledge of the composition on a wide variety of plants but only the combination of this knowledge with genetic approaches using model plants such as Arabidopsis, its mutants and gene knock-outs, it will be possible to fully understand the mechanism of the synthesis of cutin components, the interaction of lipids and their role in defence and signalling.
The work aimed to develop and verify an appropriate method for the analysis of cutin in Arabidopsis, which can subsequently be applied to all plants with very thin cuticles. The method should be applicable to different mutants and to wild types grown under specific conditions to gain insight into the cutin composition of different lines, developmental stages or under specific stress conditions. In the second part of the project known fusion mutants were further investigated. Two of the cer mutants that exhibit the fusion phenotype besides the reduction in waxes, namely cer10 and cer13, were chosen for further characterisation. Both genes seem to play a role in the pathways and their functions had to be analysed based on their phenotypic description and biochemical analyses. With the focus on two mutants that exhibit both, a wax and a cuticular phenotype, more information about these mutants might reveal deeper insight to both pathways and their interconnection and effects on plant development and morphology.
2. Materials and Method
2.1. Chemicals, enzymes, media, buffers and solutions
Chemicals used in this work were obtained from either of the following companies:
Bio-Rad (USA), Biozym (Hess. Oldendorf), Roche (Mannheim), Difco Lab. (USA), Fluka (Switzerland), Gibco-BRL (Neu-Isenburg), Merck (Darmstadt), Promega (Heidelberg), Qiagen (Hilden), Riedel de Häen (Hannover), Roth (Karlsruhe), Sigma (München). The degree of purity was “for analysis”.
Restriction enzymes were obtained from the companies New England Biolabs (Schwalmbach), Roche (Mannheim), Stratagene (Heidelberg) and Fernentas (St.
Leon-Rot). The digestions were done as suggested by the manufacturer.
Media, buffers and solutions were prepared as specified in Sambrook et al (1989).
2.2. Bacteria and Plasmids
E.coli strain:
DH5!: Genotype: supE44 DlacU169 hsdR17, recA1, endA1, gyrA96, thi-1, relA1, F (Hanahan, 1983)
Agrobacterium tumefaciens:
GV3101 pMP90RK (Koncz et al., 1990)
Plasmids
pDONR™ 201 (Invitrogen, Heidelberg) kanR
pAM-PAT 35S GW Terminator (Bekir Uelker and Imre E. Somssich) ampR
2.1.1. Preparation of chemo-competent E. coli cells (Hanahan, 1983)
All steps in this experiment were performed at 4°C. The volume of 5 ml of an over night culture of E.coli strain DH5! was added to pre-heated 100 ml of LB and kept on
were centrifuged at 5000 x g for 10 minutes at 4°C. After discarding the supernatant, the pellet was gently re-suspended in 30 ml ice-cold TFBI solution. After the second step of centrifugation, the pellet was resuspended in ice-cold TFBII solution..
Eppendorf reaction tubes of 1,5 ml containing 50 !l aliquots of cells were frozen in liquid nitrogen and stored at -80°C until use.
2.1.2. Transformation of chemo-competent E. coli cells
For every transformation, one aliquot of chemo-competent cells was thawed on ice.
For the Gateway recombination reaction, the entire reaction mixture (as described in 2.6: 6 !l or 5 !l, respectively) was added to an aliquot of E. coli DH5! cells. The cells were incubated on ice for 30 minutes. The mixture was heat-shocked for 30 seconds at 42°C and again incubated on ice for 2 minutes. The volume of 900 !l of SOC medium was immediately added to the Eppendorf tube and incubated at 37°C for 1 hour with continuous shaking at 950 rpm. A fraction (~ 150-200 !l) of the transformation mixture was plated out onto selection media plates. Transformed colonies were isolated.
2.1.3. Preparation of electrocompetent A. tumefaciens
The Agrobacterium strain GV3101 was used for the described transformation. The strain has a C58C1 chromosomal background is marked by a rifampicin resistance mutation. It carries pMP90, a helper Ti plasmid, marked with a gentamycin resistance encoding virulence functions for T-DNA transfer from Agrobacterium to plant cells (Koncz et al., 1990).
A single colony of A. tumefaciens was inoculated into 5 ml of YEB medium and grown o/n at 28°C. The o/n culture was used to inoculate 400 ml of YEB medium and grown to A600nm=0.5. Cells were harvested by centrifugation at 5000 rpm and successively resuspended in 200 ml, 100 ml and 10 ml of ice-cold 1 mM Hepes (pH=7.5). Finally cells were resuspended in 800 !l of 1 mM Hepes (pH=7.5) and 10%
v/v glycerol, aliquoted and frozen at –70°C.
2.1.4. Electroporation of A. tumefaciens cells
An aliquot of frozen electrocompetent A. tumefaciens was thawed on ice and mixed with 450 !l of 10% glycerol. The electroporator was set to 25 !F, 2.5 kV and 200 ". A single electroporation pulse was given and 1 ml of YEB medium immediately added. After incubation at 28°C for 2 hrs, cells were plated on selective YEB medium with the appropriate antibiotic and incubated for 2 d at 28°C. Transformed colonies were isolated.
2.3. Plant material
Arabidopsis thaliana (L.) Heynh. with the ecotypes of Columbia and Landsberg erecta was used in this work.
2.3.1. Cultivation of A. thaliana
Plants were raised in the greenhouse under long day (18 hrs day light/8 hrs night) or short day conditions (16 hrs day light/8 hrs night) with a temperature of 17-20°C and a relative humidity of 50-60%.
2.3.2. Cultivation of O. sativa
Rice plants were raised in a chamber with a constant temperature of 32°C and under high humidity conditions. From 8 am to 6 pm the light was on and from 6 pm to 8 am it was dark. After the germination of rice seeds the plants were kept on mix of dry sand and soil and on the 31st day after germination the plants are drowned in water up to 20 cm.
2.3.3. In planta transformation of A. thaliana
Agrobacterium clones carrying the plasmid were grown in 5 ml of LB medium with gentamycin (25 mg/l) and rifampicin (50 mg/l) o/n at 28°C. The o/n culture was used to inoculate 400 ml of YEB medium and grown for 16-20h. Cells were harvested by a centrifugation step at 5000 rpm and resuspended in 50 ml of 5% sucrose solution.
The resuspended culture was brought to A600nm = 0.8 by dilution with 5% sucrose
tumefaciens culture. Arabidopsis plants were grown under greenhouse conditions at a density of 9 plants/pot (9 cm diameter). The first emerging stems were cut off to help growth of multiple secondary bolts. Transformation was performed approximately 2 weeks after clipping. The plants were dipped for 30 s into A . tumefaciens culture and covered with a plastic hood for 24 hrs to maintain high humidity. After removal of the plastic hoods, plants were kept in the greenhouse until seeds were harvested. The selection of the transformed plants was performed by spraying 7 day old transformants with 0,1% BASTA.
2.3.4. Histochemical staining of O. sativa
Whole mount GUS staining was carried out as described in: Arabidopsis: A laboratory manual. X-Gluc (5-bromo-4-chloro-3-indolyl # D-glucuronide (cyclohexamine salt) was used for the histochemical staining of transgenic plants.
2.3.5. Insertionlines
A. thaliana T-DNA insertion lines were obtained from TAIR, GABI Kat (Köln) and INRA (Versailes, France). The wda1 T-DNA insertion line of O. sativa was provided by Gynheung An and Ki-Hong (Pohang, Republic of Korea).
2.3.6. Selection of transgenic plants on grodan mats
This selection was carried out using the protocol of Hadi et al (2001). Plants were selected for sulfadiazin resistance.
2.4. Isolation of genomic DNA using the CTAB method
The CTAB protocol was developed by Murray and Thompson (1980), modified from Rogers and Bendich (1988) and adapted by Rios et al (2002).
2.5. Isolation of plasmids
The “Qiaprep Spin Miniprep Kit” by Qiagen (Hilden) was used for plasmid isolation from E. coli.
2.6. Cloning strategies
Plasmids are described in 2.2.
BP reaction
attB-PCR Product (50 ng/!l) 1 !l GATEWAY® BP clonase 1 !l BP reaction buffer (5x) 1 !l pDONR™201 vector (50 ng/!l) 1 !l
ddH2O 1 !l
LR reaction
Entry clone (50 ng/_l) 1 !l GATEWAY® LR clonase 1 !l LR reaction buffer (5x) 1 !l Destination vector (50 ng/_l) 1 !l
ddH2O 1 !l
Typically, reactions were carried out in 1.5 ml Eppendorf tubes. Reactions were incubated at 25ºC for 12 h (for Gateway cloning), before completely transformed into E. coli strain DH5!.
2.7. Plasmid DNA cleavage by digestion with restriction endonucleases
Isolated plasmids were cleaved in diagnostic sites using restriction enzymes in order to confirm the accuracy of obtained construct. For the digestion of plasmid DNA with restriction endonucleases, buffers supplied by manufacturers were used. Cleavage of DNA was performed at recommended optimal temperatures, usually at 37°C. 5-10 U of enzyme were used. Digestion of plasmid DNA and was performed for 1-3 hrs.
Enzyme reactions were stopped by heat inactivation of restriction enzymes upon transfer of the restriction mix to 65° for 20 min.
2.8. Isolation of RNA of plants
For the isolation of RNA from plants the “RNeasy Kit” from Qiagen (Hilden) was used with an additional step to digest the DNA on column. RNA concentration and quality was determined by spectrophotometric measurements and agarose gels.
2.9. Semi-quantitative RT-PCR
Semi-quantitative reverse transcriptase–mediated polymerase chain reactions (RT- PCR) were performed in a one-step way using Qiagen One-Step RT-PCR Kit.
Oligonucleotides used for RT-PCR reactions are listed. The cycling conditions were chosen according to the protocol and the number of cycles was chosen after testing, according to the number of copies of the cDNA to just make it visible on the gel. After amplification, the RT-PCR products were loaded on 1% agarose gel containing EtBr, scanned with Typhoon 8600 Phospho imager (Amersham Biosciences), and quantified using the ImageQuant software (Molecular Dynamics, Sunnyval, CA)
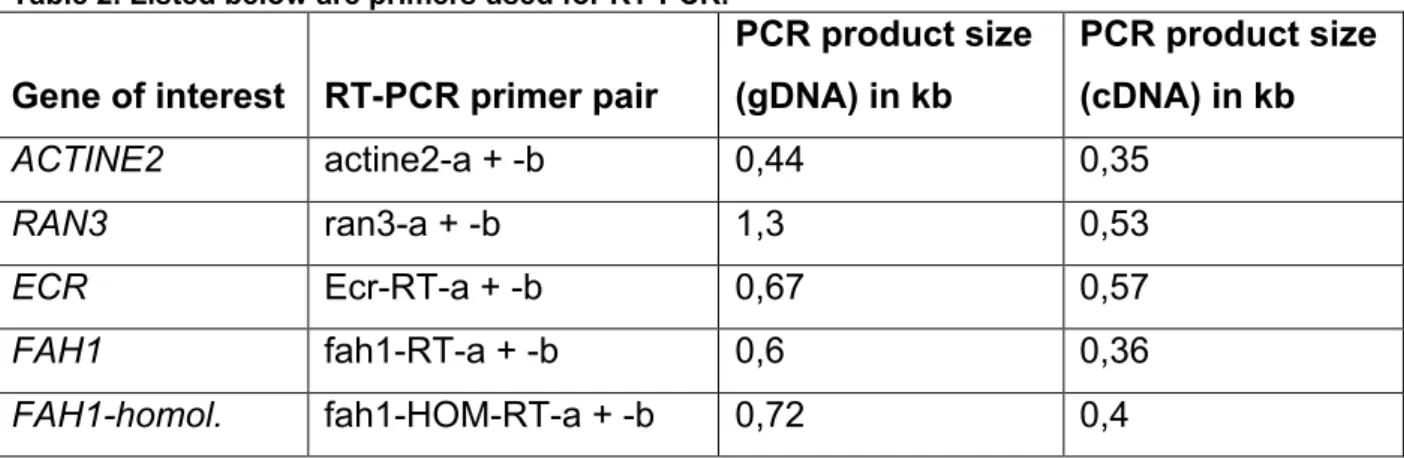
Table 2. Listed below are primers used for RT-PCR.
Gene of interest RT-PCR primer pair
PCR product size (gDNA) in kb
PCR product size (cDNA) in kb
ACTINE2 actine2-a + -b 0,44 0,35
RAN3 ran3-a + -b 1,3 0,53
ECR Ecr-RT-a + -b 0,67 0,57
FAH1 fah1-RT-a + -b 0,6 0,36
FAH1-homol. fah1-HOM-RT-a + -b 0,72 0,4
2.10. Isolation of DNA fragments from agarose gel
The “QIAquick Gel Extraction Kit” by Qiagen (Hilden) was the kit of choice to isolate DNA fragments from agarose gels.
2.11. Primers
Oligonucleotides were synthesized by Invitrogen (Karlsruhe), Operon (Köln) and Sigma (Hamburg).
2.12. Polymerase chain reaction
Polymerase chain reaction (PCR) was used to amplify specific DNA fragments on a Biozym MultiCycler Peltier PTC 225. Either Taq polymerase, the “Expand High Fidelity PCR System” or the “Expand Long PCR System” from Roche Biochemicals (Mannheim) was used. Reactions were performed as indicated by the company.
2.13. DNA sequencing and sequence analysis
DNA sequences were determined by the MPIZ DNA core facility (ADIS = Automatische DNA-Isolations- und Sequenziereinheit) on Applied Biosystems (Weiterstadt, Germany) ABI Prism 377 and 3700 sequencers using BigDye terminator chemistry. Premixed reagents were from Applied Biosystems. DNA and protein sequence analysis was performed using the MacVector program (Oxford Molecular Group). Sequences determined from the PCR products were "BLASTed"
against the GenBank database (http://www.ncbi.nlm.nih.gov/BLAST/) and after i d e n t i f i c a t i o n a n n o t a t e d a c c o r d i n g t o t h e M I P S (http://mips.gsf.de/proj/thal/db/search/search_frame.html) and TIGR Arabidopsis sequence databases (http://www.tigr .org/tdb/e2k1/ath1/LocusNameSearch.shtml).
2.14. Map based cloning
2.14.1. Generation of recombinants
I generated recombinant lines by crossing the mutant cer10 and cer13 (both on the L.erecta background) to the Columbia WT or the other way around. Approximately 100 crosses were carried out and the adult F2 generation used for amplification and mapping. F2-lines exhibiting the mutant phenotype were carefully chosen for the mapping procedure.
2.14.2. DNA isolation in 96 well plates
The DNA isolated as described by Michaels and Amasino (2001) in a 96-well format using a tissue lyser and a subsequent precipitation step.
2.14.3. Databases for SNP
There were two databases available that provide single nucleotide polymorphisms between L. erecta and Columbia. These were allocated by the company Monsanto (https://www.arabidopsis.org/cgi-bin/cereon/cereon_login.pl) and the MASC SNP DB from the Max Planck Institute of Plant Breeding Research in Köln. (http://www2.mpiz- koeln.mpg.de/masc/).
2.14.4. PCR for map based cloning
Primers were designed around the SNPs with a size of 150 to 350 bp. A Taq polymerase was used to amplify the fragments around the SNPs. A standard PCR program was used: 95°C for 1 min (denaturation), 95°C for 30 sec (denaturation), 57°C for 1min (annealing of primers), 72°C for 1 min 50 sec (ampification), 35 cycles the last 3 steps, then 72°C for 5 min for final amplification and 15°C for ever.
2.14.5. Separation with denaturing HPLC
The analyses were carried out on a Transgenomic dHPLC WAVE DNA Fragment Analysis system equipped with a DNASep column (Transgenomic). The mobile phase was 0,1 M triethylammonium acetate (Transgenomic), pH 7, and 0,1 mM Na4EDTA (Transgenomic). DNA fragments were eluted at a flow rate of 0,9 ml/min in a gradient with acetonitrile (Sigma). The predicted melting profile of the provided standard was firstly analysed by the supplied WAVEMAKER (Transgenomic) software to check the correctness of the temperatures and gradient conditions of the machine. For the calibration step, the PCR reactions from heterozygous and homozygous lines were directly loaded on the dHPLC and we determined the optimal temperatures, injecting 5 !l per run. In a successful calibration the chromatogram of a heterozygous fragment differed from the homozygous fragments. For SNP mapping, amplicons derived from recombinants, homo- and heterozygous control lines were run at the established conditions (Fig.3).
Fig.3. Examples of seperation of PCR fragments on dHPLC at optimal temperature.
a) Seperation of fragment homozygous for SNP b) Seperation of fragment heterozygous for SNP
2.14.6. Analysis of data
Chromatograms were examined in the WAVE software (Transgenomic) visually for differences between the homoduplexes of Columbia or L. erecta only and the Columbia/L. erecta heteroduplexes. Only markers with clearly resolved homoduplex and heteroduplex species were used for subsequent genotyping. The map of the region was drawn in Excel. All information coming from the HPLC analyses about heterozygous and homozygous lines were plotted on an Excel diagram in the correct order of the SNPS on the chromosome in the region of interest.
2.15. Biochemical analyses of lipids
2.15.1. Wax analysis
For the wax analysis of A. thaliana leaves, 10 rosette leaves of different five-week-old plants were cut and directly dipped in a vial containing pure chloroform for 10 s at room temperature and scanned for area measurement.
For the analysis of waxes of O.sativa leaves, the first leaf of 3 plants were taken for one sample, and 4 samples were prepared. Big glass test tubes were rinsed with chloroform for cleaning and the 3 leaves per sample were extracted for 10 seconds in the test tube filled with chloroform. Another test tube was prepared and preheated to 35°C and the rice leaves were extracted a second time immediately after the first extraction. Then the leaves were scanned to calculate the surface area later. The remains of the leaves were cut into small pieces and extracted in chloroform/MeOH to remove soluble lipids prior to the analysis the cutin of the rice leaves as described later.