Faculty & Research Working Paper
Assessed by a Teacher Like Me:
Race, Gender, and Subjective Evaluations
_______________
Amine OUAZAD 2008/57/EPS
Assessed by a Teacher Like Me:
Race, Gender, and Subjective Evaluations
By
Amine Ouazad*
September 2008
I am indebted to Roland Benabou, Marc Gurgand, Xavier d'Haultfoeuille, Caroline Hoxby, Francis Kramarz, Eric Maurin, Jesse Rothstein, and Cecilia Rouse for fruitful conversations and comments on preliminary versions of this paper. I also thank the audience of the Labor Lunch Seminar at the Industrial Relations Section, Princeton University, the Lunch Seminar of the Paris School of Economics, and the Labour Markets Seminar at the London School of Economics. This work was undertaken while visiting Princeton University. I thank Professor Cecilia Rouse for access to the restricted-use data set. The author acknowledges _nancial support from the Economics of Education and Education Policy in Europe network, Princeton University, and CREST-INSEE.
* Assistant Professor of Economics at INSEAD and Centre for Economic Performance at the London School of Economics. INSEAD, Boulevard de Constance, 77300 Fontainebleau, France. Tel : 33 (0)1 60 72 42 3 9 Email : amine.ouaza d@insead.edu
A worki ng paper in the INSEAD Working Paper Series is intended as a means whereby a faculty researcher's thoughts and findings may be communi cated to i nterested readers. The paper should be considered prel imi nary in nature and may require revi sion.
Printed at INSEAD , Fontainebl eau, France. Kindly do not reproduce or circulate without permission.
Abstract
The underrepresentation of minority teachers and male teachers remains an issue in U.S. elementary education, and there is evidence that racial interactions partly shape student performance. However, there is little work on discrimination within the classroom. Do teachers give better grades to children of their own race, ethnicity, or gender? A U.S. nationally representative longitudinal data set that includes both test scores and teacher assessments offers a unique opportunity to answer this question. I look at the effect of being assessed by a same-race or same-gender teacher conditional on test scores, child effects, and teacher effects. This strategy controls for three confounding effects: (i) children of different races and genders may react differently in the classroom and during examinations, (ii) teachers may capture skills that are not captured by test scores, and (iii) tough teachers may be matched with specific races or genders. Results indicate that teachers give higher assessments to children of their own race, but not significantly higher assessments to children of their own gender. This effect seems to be driven largely by the differential assessments given to non-hispanic black and hispanic children: white teachers give significantly lower assessments to non-hispanic black children and to hispanic children.
Results are robust to various checks on endogenous mobility, measurement error, and reverse causality.
Moreover, children's behavior is not a significant determinant of same-race or same-gender matching.
Finally, relative grading does not explain the main results of this paper.
Keywords: grading, discrimination, stereotype threat, race, gender JEL Code: C23, I2, J7, J15, J16, J82
1 Introduction
Persistent racial and gender gaps are an increasing concern in many countries. In the United States, a typical black 17-year-old reads at the proficiency level of a typical white 13-year-old (Fryer and Levitt, 2006a). Girls significantly outperform boys in reading, and boys outperform girls in mathematics. At the macroeconomic level, these gaps may be costly, given that the aggregate return to education is estimated at around 6–10% per year of schooling (Acemoglu and Angrist, 2000). A back-of-the-envelope calculation thus suggests that there could be important gains from reducing the human-capital gap between races and genders.
Of course, those potential gains depend on the cost of reducing racial and gender gaps. Some claim that there are intrinsic differences between races and genders that are not reducible to social or economic factors. One of the most famous arguments is described in Herrnstein and Murray (1994). However, this explanation has been disputed. First, there is no single factor — usually called the g factor — that explains educational or labor market outcomes (Heckman, Stixrud and Urzua, 2006). Second, racial and gender gaps are not constant but rather are increasing with age. Fryer and Levitt (2006b) reports that there is no difference in cognitive performance for 1-year-old children. In grade 1, a few covariates for family background are enough to make racial gaps disappear (Fryer and Levitt, 2006a). By the end of third grade, covariates do not capture the black–white test score gap (Fryer and Levitt, 2006a); and, indeed, the black–white test score gap increases by about 0.1 percent of a standard deviation per year that children are in school. This suggests that teachers’ behavior may be a factor.
The explanation may partly rely on the lack of minority teachers in elementary education: the fraction of minority teachers would have to (roughly) double to match the fraction of minority students. In this paper, I look at whether teachers give better subjective assessments to students of their own race and/or gender conditional on test scores. Subjective assessments are pervasive in schools: most teachers fill school records with comments on the child’s ability or behavior. Important decisions such as tracking, special education, and ability grouping are partly based on subjective assessments. Moreover, teachers’ priors, beliefs, and behavior may be based on what other teachers have reported.
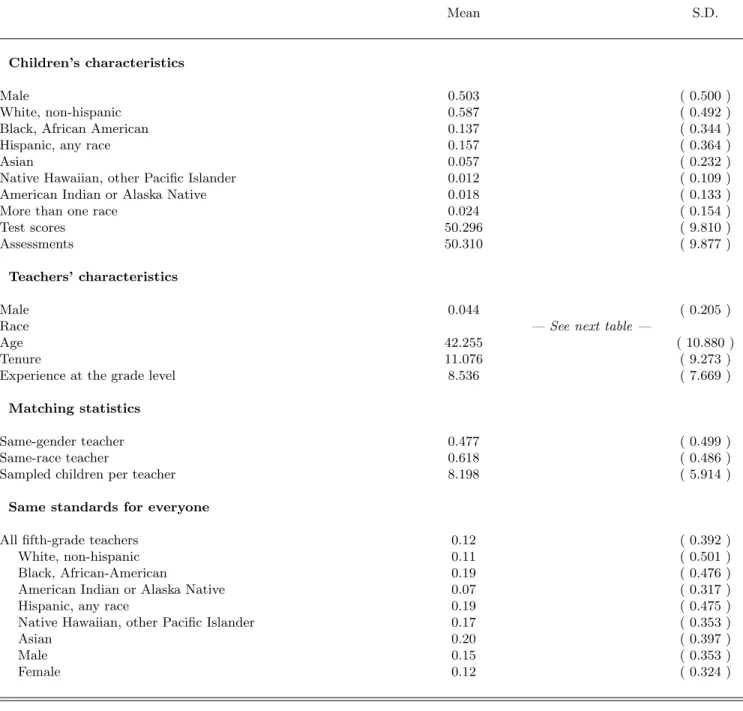
The bottom part of Table I shows how fifth-grade teachers report their grading practices: 11% of white teachers declare they hold all children to the same standards; 19% of non-hispanic black and hispanic teachers provide the same answer. Male teachers too, more often declare holding all children to the same standards: 15% versus 12% for female teachers. Thus teachers’ self-reported grading practices vary widely
across race and gender. However, econometric work is needed to reveal teachers’ actual grading practices.
I estimate the effect of being assessed by a teacher of the same race on assessments conditional on test scores. I use a unique U.S. longitudinal data set that combines test scores and teacher assessments of children’s skills in elementary education. I can thus compare the test scores and teacher assessments when a given child has a same-race teacher versus when the teacher is of a different race. I can also look at differences for a given teacher when assessing same-race children versus children of other races. Combining these two identification strategies, I estimate the effect of same-race and same-gender teaching on assess- ments conditional on test scores and on child and teacher fixed effects. This addresses three potential identification issues. First, children of different genders and races may behave differently in the classroom and during examinations; examples include differential effect of testing on boys and girls as well as effects arising from stereotype threats (Steele and Aronson, 1998). Second, teacher assessments may capture skills that are not captured by test scores. Third, some teachers may give higher average assessments regardless of their students’ race or gender, and this can be correlated with child characteristics.
The data set is the Early Childhood Longitudinal Study, Kindergarten cohort of 1998–1999 (ECLS-K), collected by the National Center for Education Statistics of the U.S. Department of Education. It is the first large-scale U.S. study that follows a cohort of children from kindergarten entry to middle school.
Hence this is the first paper to look at the discrepancy between test scores and teachers’ perception of students’ ability that uses a representative longitudinal sample of U.S. children in elementary education.
Important findings are that teachers tend to give better assessments to children of their own race and ethnicity, but not significantly higher assessments to children of their own gender. Moreover, this result is mainly due to the lower grades given to non-hispanic black children and to hispanic children.
A number of robustness checks confirm the result of the baseline estimations. I test for endogenous mobility and allow for some correlation between race, gender, and pupil mobility. Furthermore, measure- ment error checks show that it would take a large amount of measurement error to otherwise explain results. The estimates are also robust to falsification checks in which test scores are regressed on assess- ments rather than these on teacher assessments. Finally, I show that even if relative ranking and de facto racial segregation could be a potential explanation, controlling for peers’ test scores does not change the results.
The analysis of this paper is related to Lavy (2004). Lavy’s paper uses high school matriculation exams in Israel. Comparison of blind versus nonblind test scores showed that boys are likely to be overassessed in all subjects. Moreover, the size of the bias was highly sensitive to teachers’ characteristics suggesting
that teachers’ behavior is causing grade discrimination. This paper differs from Lavy (2004) in at least three ways. First, I compare subjective assessments and test scores, where subjective assessments are based on classroom behavior and coursework; Lavy (2004) compares test scores of blind and nonblind examinations. Second, in Lavy (2004), if tough teachers are more likely to grade boys then the effect of nonblind assessments on boys’ test scores could be overestimated. I control for this effect in the ECLS-K by taking into account child and teacher fixed effects.
This paper is also related to a small-scale experiment on fifth-grade teachers in the state of Missouri.
Clifford and Walster (1973) sent teachers report cards that included child records randomly matched to photographs, and teachers were asked to assess child ability. The researchers found a significant effect of physical attractiveness on assessments but no effect of gender. Nevertheless, the study raises a number of issues. It is not clear whether this result on Missouri fifth-grade teachers is relevant to assessing discrimination in a representative U.S. classroom, since teachers were assessing students they did not know on the basis of randomly generated school records. The research reported here on the ECLS-K provides a large-scale analysis of teacher assessments in U.S. elementary education.
Better teacher assessments may have beneficial or detrimental effects on performance. On the one hand, better assessments for the same ability level make it easier to get good grades and may therefore decrease the child’s marginal benefit of effort (cf. Coate and Loury, 1993). On the other hand, better teacher expectations may raise student expectations or reflect greater investment in the child’s education.
These stories can be told apart in a controlled experiment. The psychological and educational litera- ture has debated the issue of the effect of teacher expectations at least since the Pygmalion experiment (Rosenthal and Jacobson, 1968). In this experiment, children of an elementary school took a cognitive test at the beginning of the school year. The experimenters then selected 20% of the children and told the teachers that these children were showing “unusual potential for intellectual growth”. Empirical results suggested that those labeled as bloomers had significantly higher IQ progress in first and second grade.
Discrimination and the effect of discrimination cannot be jointly identified in the same data set.
Identifying discrimination in grading by same-race or same-gender teachers requires a data set such as the ECLS-K, whereas identifying the effect of perceptions requires a controlled experiment. That is an important point, because it is tempting to go further and estimate the effect of perceptions and the amount of discrimination in the same dataset.
Dee (2004) and Dee (2005b) show that being taught by a teacher of the same race or gender increases test scores. Empirical results from Project STAR’s experiment show that same-race teaching increases test
scores for grade-1 to grade-3 children (Dee, 2004). Other empirical results from the National Education Longitudinal Study show that same-gender teaching increases the test scores of eighth-grade children (Dee, 2005b). This paper is different: it estimates the effect of same-race teaching on assessments conditional on test scores. That is, I examine whether teachers have incorrect perceptions of their students’ ability
— either overestimating or underestimating it. This leads to different policy implications, e.g. including or improving diversity training for teachers.
The rest of the paper is structured as follows. Section 2 presents the Early Childhood Longitudinal Study. It provides a first-hand descriptive analysis of the difference between teacher assessments and test scores as well as some statistics on racial and gender diversity in U.S. elementary education. Section 3 explains main identification issues, the identification strategy, and baseline results. Section 4 checks the robustness of the results. Section 5 shows that assessment rankings are not affected by teacher–pupil racial interactions in the classroom and that relative ranking does not explain the main results. Finally, Section 6 concludes.
2 The Early Childhood Longitudinal Study
In the fall of 1998, the National Center for Education Statistics of the U.S. Department of Education undertook the first national longitudinal study of a representative sample of kindergartners. It started with more than 20,000 children in a thousand participating schools. It then followed children in the spring, in the fall and spring of grade 1, and in the spring of grades 3 and 5. The study’s last follow-up will be eighth grade. Follow-ups have combined procedures to reduce costs and maintain the representativeness of the sample. Movers have been randomly subsampled to reduce costs. At the same time, new schools and children have been added to the data set to strengthen the survey’s representativeness. In the spring of 1999, part of the schools that had previously declined participation were included. In the spring of grade 1, new children were included; this made the cross-sectional sample representative of first-grade children. All of whom were followed in the spring of grade 3 and 5.
This paper’s empirical analysis uses the restricted-use version of the ECLS-K, which contains the race and gender of both teachers and pupils. Observations with missing data on basic variables (test scores, subjective assessments, teachers’ and children’s race and gender) were deleted. The analysis is done on 48,065 observations in mathematics and 67,085 in English, which is similar to Fryer and Levitt (2006a).
Weights provided by the survey’s designers correct for the subsampling of movers, but most of the analysis
is robust to changes in weights. Race and ethnicity questions for the teacher were combined to match the categories of child’s race; hence Hispanic, Any Race is a separate category. “Same race” should therefore be read as “same race (non-hispanic) or both hispanic (any race)”1.
Test scores were derived from national and state standards, including the National Assessment for Educational Progress (NAEP), the National Council of Teachers of Mathematics, the American Associ- ation for the Advancement of Science, and the National Academy of Science. Test scores are based on answers to multiple-choice questionnaires conducted by external assessors. It is a two-stage adaptive test:
surveyors administer a routing test and select a longer test of appropriate difficulty. Test scores are made comparable across children using item response theory2, and items in second-stage forms overlap adjacent forms. Skills covered by the reading assessments from kindergarten to fifth grade include: print famil- iarity, letter recognition, beginning and ending sounds, recognition of common words (sight vocabulary), and decoding multisyllabic words; vocabulary knowledge, such as receptive vocabulary and vocabulary in context; and passage comprehension. Skills covered by the mathematics assessment from kindergarten to fifth grade include: number sense, properties, and operations; measurement; geometry and spatial sense; data analysis, statistics, and probability; and patterns, algebra, and functions. Test scores were standardized to a mean of 50 and a standard deviation of 10 before the deletion of missing observations.
At approximately the same time, teachers are contacted in their school. Teachers complete one questionnaire per child. Teacher assessments of children’s skills, also called the Academic Rating Scale, are separated into three areas: Language and Literacy; General Knowledge; and Mathematical Thinking.
I will use English (Language and Literacy) and mathematics assessments (Mathematical Thinking). The instructions make it clear that this is not a test and should not be administered directly to the child. For English and mathematics, teachers answer between seven and nine questions on the childs’ proficiency in a set of skills. Answers are on a five-point scale: Not Yet, Beginning, In Progress, Intermediate, Proficient.
An overall assessment is computed for each topic. Teacher assessments, like test scores, were standardized to a mean of 50 and a standard deviation of 10 before the deletion of missing observations.
Teachers also report measures of behavior, which are useful as controls. The social rating scale (SRS) has five scales: approaches to learning, self-control, social interaction, impulsive/overactive, and sad/lonely. The Approaches to Learning Scale measures the ease with which children can benefit from
1Racial questions follow the 1997 Revisions to the Standards for the Classification of Federal Data on Race and Ethnicity published by the Office for Management and Budget. These standards allow for the possibility of specifying “More than One Race”. Nevertheless the share of children who were declared as “More than One Race” is small.
2Item response theory computes test scores adjusting for the difficulty of each question. Formally, the probability of a right answer is modelled aspi(θ) =ci+ (1−ci)/[1 + exp(−Dai(θ−bi))], whereai,bi andciare question-specific parameters andθis child ability.
their learning environment. The Self-Control Scale indicates the child’s ability to respect the property of others, control temper, accept peer ideas for group activities, and respond appropriately to pressure from peers. The five Interpersonal Skills items rate the child’s skill in forming and maintaining friendships;
getting along with people who are different; comforting or helping other children; expressing feelings, ideas and opinions in positive ways; and showing sensitivity to the feelings of others. Externalizing Problem Behaviors include acting-out behaviors; the Internalizing Problem Behavior Scale asks about the apparent presence of anxiety, loneliness, low self-esteem or sadness.
Basic children’s characteristics are summarized in Table I. The sample is balanced in terms of gender and race. Some racial groups are overrepresented to increase the precision of statistics for subgroups.
Moreover, test scores and teacher assessments were standardized to a mean of 50 and a standard deviation of 10 before the exclusion of missing data. This makes test scores and teacher assessments comparable to those in the overall population.
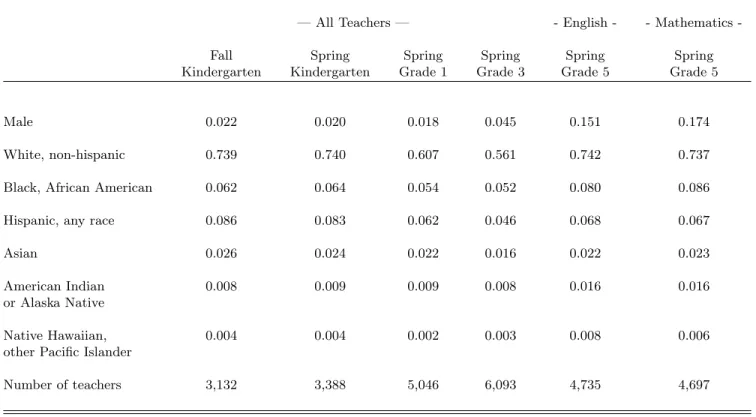
What does it mean to be matched to a teacher of the same race or the same gender? Most children are taught by female white teachers, so the potential advantages of same-race or same-gender teaching will mostly be felt by female or white children. Tables I and II show that only 4.4% of teachers are male, and 47.7% of children are matched with a teacher of the same gender. However, the fraction of male teachers increases over time. Only 2.2% of fall kindergarten teachers are male, but this figure jumps to 15.1% among grade-five English teachers and to 17.4% among grade-five mathematics teachers.
Teachers are also mostly white; Table II reveals that 73.9% of teachers are non-hispanic white in fall kindergarten. This fraction decreases over time before rising in grade 5. Most minority teachers are either hispanic (of any race) or black (African Americans). They predominantly teach to minority children, with their classrooms averaging 81.4% minority children. Column 1 of Table IX shows the regression of a “same race” dummy on pupil characteristics: boys are not significantly more likely to be taught by a teacher of the same race, whereas minority children are systematically less likely to be taught by a teacher of the same race. Non-hispanic black and hispanic children are about 66% less likely to be taught by a teacher of the same race, and this unlikelihood rises to 83% for Asian children.
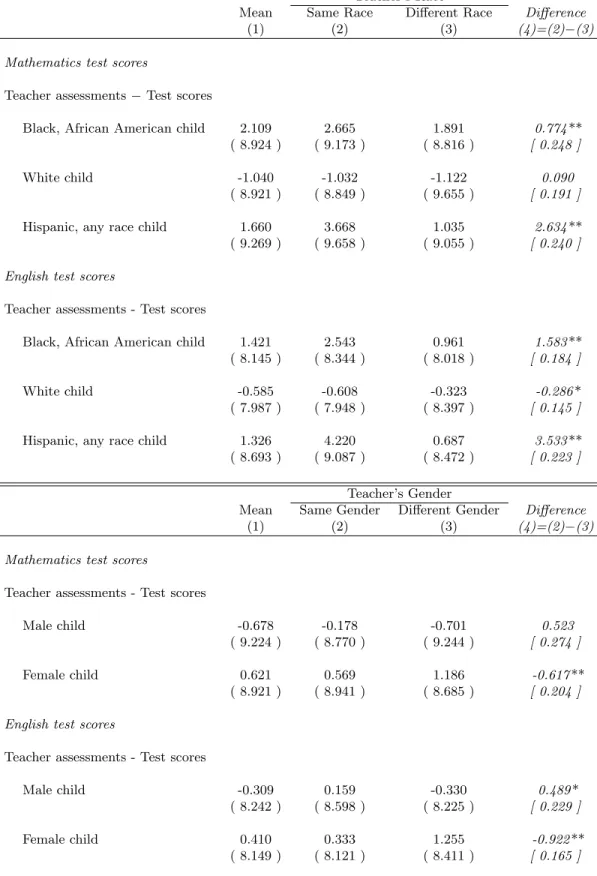
A first taste of the forthcoming results is shown in the descriptive statistics of Table III. Let’s start with mathematics. The difference between test scores and teacher assessments is higher for teachers of the same race as African American children (7% of a standard deviation), hispanic, any race children (26.3% of a standard deviation). These differences are significant at 1%. In English, too, these differences are higher for children matched to a teacher of the same race: 15.8% of a standard deviation for African
American children, 35.3% for hispanic children. The difference is slightly negative for white children in English, but this effect disappears when confounding effects are controlled for. Small minority groups are omitted from these initial tables but they are fully included in all subsequent regressions.3
Descriptive statistics for same-gender vs opposite-gender pairings do not display the same clear-cut figures, although the difference between teacher assessments and test scores is lower for girls when matched to a teacher of the same gender. These statistics should not be viewed as causal because they do not control for potentially confounding effects. I describe these in the next section.
3 Identification and Results
3.1 Identification of Teacher Discrimination
Descriptive statistics suggest that, in most minority groups, the teacher assessment–test score gap is higher when student and teacher are of the same race (Table III). This should not be interpreted as a causal effect for a number of reasons.
First, teachers may report skills that are not captured by test scores. The description of the data set makes it clear that, in principle, teacher assessments and test scores cover the same skills. But questions and answers give some leeway. Questionnaires do not formally define the meanings of the five answer categories (Not Yet, Beginning, In Progress, Intermediate, Proficient). Second, boys and girls, white and minority children may display skills differently in the classroom and in a multiple-choice questionnaire.
Studies have shown that, for instance, boys react differently to high-stake examinations. Third, some teachers give (on average) higher grades than other teachers for children of the same abilities. The teacher’s tendency to give higher grades may be correlated with being of the same race or gender as the students, in which case the gap between test scores and assessments varies with same-race or same-gender teaching without reflecting discrimination.
The baseline specification will attempt to cope with these three potential issues; in this specification, teacher assessments depend on test scores, teacher fixed effects, child fixed effects and a variable indicating whether the child is matched to a teacher of the same race or gender. Formally:
3Results available on request.
ai,f,t = µJ(i,f,t)+δyi,f,t+ui,f +αrSame Racei,f,t+εi,f,t, (1)
ai,f,t = µJ(i,f,t)+δyi,f,t+ui,f +αgSame Genderi,f,t+εi,f,t. (2)
Hereai,f,tis the teacher assessment of childiin fieldf (English or mathematics), in periodt, whichs runs from fall kindergarten to spring grade 5. The yi,f,t term is the test score, ui,f is the child effect of child iin field f, andµJ(i,f,t) is the teacher effect. Same Racei,f,t (resp. Same Genderi,f,t) takes value 1 when matched with a teacher of the same race (resp. gender) and 0 otherwise.
ui,f captures non–time–varying individual characteristics that may have an effect on assessments regardless of the teacher. For instance, this term may capture behavior, which teachers typically include in their assessments. Boys may react differently to classroom exercises, which are assessed by the teacher, and to the multiple-choice questions of the ECLS-K.
The inclusion of teacher effects µJ(i,f,t) attempts to cope with the third identification issue. If the teacher’s grading practice µJ(i,f,t) is correlated to same-race or same-gender teaching, then the OLS estimates ofαg and αr might be biased. Hence teacher effectµJ(i,f,t)is used to capture these permanent average differences between teachers.4
The model is estimated using a preconditioned conjugate gradient method described in Abowd, Creecy and Kramarz (2002).5 All estimations have converged with a numerical precision of 10−15. Bootstrap was used to compute standard errors, as described in Efron and Tibshirani (1994); specifically, block bootstrap was performed (i.e. simple random sampling of children, which takes into account the correlation of residuals across observations of the same child).
As in Abowd, Kramarz and Margolis (1999) and Kramarz, Machin and Ouazad (2007), children moving from/to a same-race teacher identify the effect of same-race assessments conditional on test scores. The identification of specifications (1) and (2) therefore requires sufficient and exogenous mobility6.
Exogenous mobility is best understood when comparing the progress of a child in terms of assessments to progress in terms of test scores. Let’s therefore take the first difference of specifications (1) and (2):
4Another identification issue may arise if some teachers “spread” their assessments more than others, in which caseδmay vary from teacher to teacher. However, estimations are too imprecise when allowing this flexibility. Results are available on request.
5I have developed a set of STATA packages available on the web by typing ‘ssc install a2reg’ on the command line.
6Sufficient mobility can be properly defined. As in Abowd et al. (1999) and Kramarz et al. (2007), two teachers are said to beconnectedwhen they have taught the same child in different years. This defines a network of teachers connected together through children. For all teachers in the same connex component of the mobility graph, it is then possible to identify teachers’ relative toughness in grading.
∆ai,f,t = ∆µJ(i,f,t)+δ∆yi,f,t+αr∆Same Racei,f,t+ ∆εi,f,t, (3)
∆ai,f,t = ∆µJ(i,f,t)+δ∆yi,f,t+αg∆Same Genderi,f,t+ ∆εi,f,t. (4)
The effect of same-race and same-gender assessments is identified whenever ∆Same Racei,f,t and
∆Same Genderi,f,tare not correlated with unobserved characteristics that have an impact on the progress in assessments, conditional on the variation in teacher effects ∆µJ(i,f,t) and the progress in test scores
∆yi,f,t. In other words, child mobility should not be driven by unobserved time-varying shocks that affect teacher assessments conditional on the other covariates. Section 4.1 suggests that this issue is not affecting the empirical results.
3.2 Baseline Results
Baseline results suggest that teachers indeed give better assessments to pupils of their race, but not significantly better assessments to pupils of their own gender. The effect is sizeable: it is between 1/10 and 1/5 of the black–white teacher assessment gap and about 1/3 of the hispanic–non-hispanic teacher assessment gap.
Baseline results are presented in Table IV. OLS estimates indicate that children who are assessed by same-race teachers also have higher math assessments around 2.8% of a standard deviation higher.
However, this is not likely to be the causal effect of same race assessments for reasons outlined previously.
Column 2 gives the estimate when controlling for child effects. This estimate is higher than the baseline OLS, which suggests that the child fixed effect is negatively correlated with same-race pairings. Most teachers are female non-hispanic white, therefore either on average all teachers give lower assessments to white children or white children respond differently when in the classroom than when facing an assessor.
Column 3 gives the estimate when controlling for teacher fixed effects. Again, the estimate is higher than the OLS estimate of column 1, which implies that the teacher fixed effect is negatively correlated with same-race pairings. Teachers who give lower assessments are matched with children of the same race.
Again, a majority of teachers are white females, and a possible story is that these teachers are tougher than teachers of other races.
Finally, column 4 gives the estimate when controlling for both children and teacher fixed effects. The estimate is similar to the estimates of columns 2 and 3. Column 4 is my preferred estimate for the effect
of same-race matching on assessments conditional on test scores. It indeed addresses the three important identification issues already described. On average, children who are assessed by a teacher of the same race have a higher mathematics assessment — around 7% of a standard deviation higher.
Turning to English assessments, the OLS estimate and the child fixed effects are roughly similar:
children who are assessed by a teacher of the same race also have a higher English assessment, by around 4% of a standard deviation. Column 7 shows that controlling for teacher fixed effects actually increases the estimate, suggesting the same correlation between grading practices and same-race matching as for math assessments. Column 8 shows the estimate when controlling for both children and teacher fixed effects. Surprisingly, the effect is of the same magnitude as the OLS and the child fixed effect estimates;
this is due to the negative correlation between child and teacher fixed effects. Results indicate that being matched with a teacher of the same race increases assessments by around 4% of a standard deviation, conditional on test scores and on children and teacher fixed effects.
The gender and racial gaps in teacher assessments are shown in Table V. This table is useful for comparing the gaps in assessments to the magnitude of the effect. In mathematics, the effect of same- race assessments is around 7% of a standard deviation, approximately 1/3 of the black–white teacher assessment gap and 1/5 of the hispanic–non-hispanic teacher assessment gap. In English the effect of same-race assessments is around 4.1% of a standard deviation, which explains about 1/10 of the black–
white teacher assessment gap. Overall, the effect of race interactions on assessments accounts for between 1/10 and 1/3 of the teacher assessment gaps.
3.3 Analysis of Child and Teacher Effects
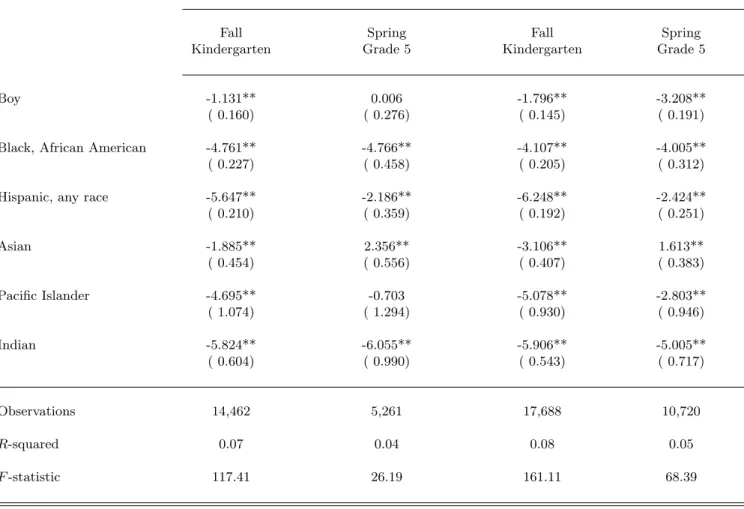
Child fixed effects are interpreted as: (i) differential behavior in the classroom and during tests; (ii) unob- served characteristics that teachers may include in their assessment; (iii) average grading discrimination.
Column 1 of Table VI shows that boys’ fixed effects are 19% of a standard deviation lower, controlling for race. Controlling for teacher-reported child’s behavior, the difference between boys’ and girls’ fixed effects is much smaller (7% of a standard deviation). This indicates that teacher assessments partly include the child’s behavior. The same reasoning for other rows of columns 1 and 2 of Table VI suggests that lower fixed effects for minority children are partly due to the inclusion of behavior in teachers’ assessments.
Teacher grading practices are captured by teacher fixed effects. The fixed effects are higher when teachers give better assessments regardless of the student’s race or gender. Columns 3 and 4 of Table VI show results of the analysis of teacher fixed effects. Male teachers’ effects are 5.3% of a standard
deviation higher, suggesting that male teachers give better assessments on average. Black, hispanic, and Asian teachers’ effects are between 1% and 2.5% of a standard deviation lower. These correlations are stable when controlling for tenure and experience, even though the proportion of minority teachers has steadily declined in the last decades.
3.4 Breaking Down Results by Race
Results have suggested that teachers give higher grades to children of their own race conditional on test scores and children’s and teachers’ constant characteristics. What races drive these results? In order to disentangle the effects of different racial interactions, I will estimate a specification in which the Same Race dummy is split into multiple dummies, one for each interaction between the teacher’s and the student’s race. This will allow for heterogeneous effects, race by race. The specification is similar to baseline specification (1).
ai,f,t = µJ(i,f,t)+δyi,f,t+X
r6=r0
αr,r0D(r, r0) +ui,f+εi,f,t, (5)
where r denotes teacher’s race and r0 student’s race. Pupil i’s assessment ai,f,t in field f in period t depends on test scores yi,f,t, a set of interactions between the teacher’s and the student’s race D(r, r0), child effectsui,f and teacher effectsµJ(i,f,t).
Results are presented in Table VII.7 This more refined analysis of racial interactions gives a better view of teacher perceptions. In mathematics, being assessed by a white teacher lowers the assessment of hispanic children by 17.3% of a standard deviation. The interaction between white teachers and black students is not significant, but the coefficient’s order of magnitude is comparable to baseline estimates.
In English, the interaction is significant. White teachers give lower assessments to black children, lower by 11.1% of a standard deviation. They also give lower assessments to hispanic children, by 14.8% of a standard deviation.
Despite the size of standard errors, statistical tests show that black teachers give significantly higher English assessments to white students that white teachers to black students. Hispanic teachers, too, tend to give higher assessments in English to white students than white teachers to hispanic students.8 In
7Results from very small minority groups (Pacific Islanders, American Indians) may not be robust. All racial interactions are included in the regressions but only coefficients for blacks, hispanics and whites are reported on the table.
8A post-regressionχ2 test rejects the equality of coefficients “White teacher–Black student” and “Black teacher–White student”, as well as the equality of coefficients “White teacher–Hispanic student” and “Hispanic teacher–White student” .
mathematics, white teachers give significantly lower assessments to Hispanic students than to white and black students.9
One result from Table VII departs from the idea that same-race assessments result in higher grades:
hispanic teachers tend to give higher grades to white students than to hispanic students in English.
Overall results broken down by race reveal that the strongest interactions occur between white teachers and black students and between white teachers and hispanic students.
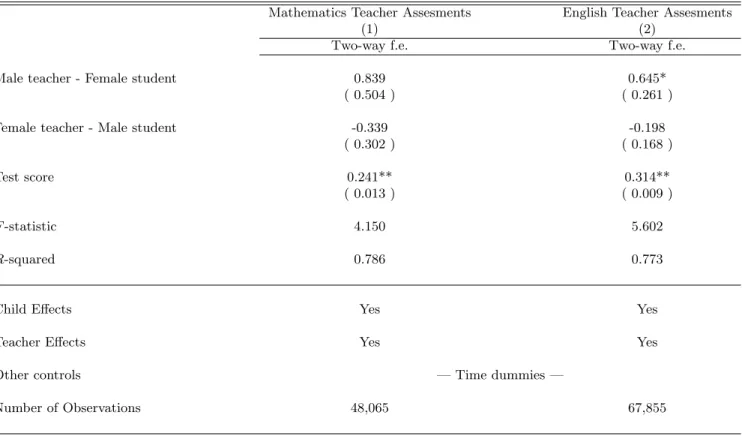
3.5 Do Female Teachers Give Better Assessments to Girls?
It has not been found that teachers give significantly higher grades to children of their own gender conditional on test scores and on children’s and teachers’ constant characteristics. However, it may be possible that this average effect for both male and female teachers is due to the combination of opposite effects for same-gender teacher–pupil pairings.
I therefore put forward a specification in which heterogenous effects are allowed. In the same way as in Section 3.4,
ai,f,t = µJ(i,f,t)+δyi,f,t
+αmale(Male Teacher and Male Pupil)i,f,t +αfemale(Female Teacher and Female Pupil)i,f,t
+ui,f +εi,f,t (6)
Pupili’s assessmentai,f,tin fieldfin periodtdepends on test scoresyi,f,t, a (Male Teacher and Male Pupil)i,f,t,Male dummy, a (Female Teacher and Female Pupil)i,f,t,Femaledummy, child effectsui, and teacher effectsµJ(i,f,t).
Empirical results (presented in Table VIII) show that male teachers are more likely to give higher assessments to male children in mathematics, increasing them by 6.5% of a standard deviation. Other coefficients are not significant.
Theχ2 statistic is 15.28 (resp. 15.11) with ap-value of 0.0001 (resp. 0.0001).
9The “White teacher–Hispanic student” coefficient is significant. Moreover, aχ2 test rejects the equality of the “White teacher–Hispanic student” coefficient and the “White teacher–Black student”. The statistic equals 4.62 and the p-value is 0.0316.
4 Discussion
4.1 Are Disruptive Children Assigned to Teachers of Their Own Race?
The baseline model described in equations (1) and (2) is not identified if (i) the child’s behavior is implicitly part of teacher assessments and (ii) the child’s behavior makes it more likely to be taught by a teacher of the same race. This section shows that there is little correlation between being assigned a teacher of the same race and measures of behavior.
Studies in psychology have shown that family events are correlated with child behavior: children who witness domestic violence suffer from low self-esteem, anxiety, depression and behavior problems (Hughes, 1988); physically abused adolescents have significantly higher prevalence rates of depression, conduct disorder, internalizing and externalizing behavior problems, and social deficits (Pelcovitz, Kaplan, Goldenberg, Mandel, Lehane and Guarrera, 1994). Family events may therefore drive behavioral changes.
Moreover, the economics literature shows that teachers are not randomly assigned to students (Rothstein, 2008). Clotfelter, Ladd and Vigdor (2005) suggests that novice teachers are assigned to classrooms in a way that disadvantages black students. In this analysis, if students who become disruptive are assigned to same-race teachers then I overestimate the effect of same-race assessments. A good test is therefore to regress probabilities of being matched to a teacher of the same race on changes of behavior.
Columns 3 and 4 of Table IX show that there is no significant effect of behavior on the probability of being matched with a teacher of the same race.10 There is little correlation between behavior and same- race teaching when controlling for teacher fixed effects, and it disappears altogether when controlling for both child fixed effects and teacher fixed effects. This table is for mathematics, and a similar table is available for English teachers. The ECLS-K contains multiple measures of behavior reported by the teacher and by the parents. Table IX uses teacher-reported measures of behavior because they are likely to be more relevant than parental measures in the teacher assignment process.11
4.2 Can Measurement Error Explain the Results?
Test scores of multiple-choice questionnaires are usually noisy measures of underlying ability (Rudner and Schafer, 2001). Random error may be introduced in the design of the questionnaire; distractors (wrong options) may not be effective, or may be partially correct; and items may be either difficult or not difficult
10This is a linear probability model. Conditional logits allow for the estimation of discrete models with controls for unobservable heterogeneity, and their estimation yields similar results. Conditional logits do not allow the introduction of both student and teacher unobserved heterogeneity.
11Parental measures could be used, with no significant effect on the findings. Results are available on request.
enough. Measurement error may be also be due to children’s behavior, such as sleep patterns, illness, careless errors when filling out the questionnaire, and misinterpretation of test instructions.
Measurement error in test scores could cause bias in my estimation of the effect of same-race/same- gender teachers on assessments. More precisely, most teachers are (non-hispanic) white, and most minority teachers are either hispanic or African American. The Same Race variable will therefore be correlated with the gap between white and black and between white and hispanic children. This means that the effect of same-race assessments could be overestimated. It is therefore important to check whether measurement error could be a potential story for a significant effect of same-race teachers on assessments in Table IV.
A first hint that measurement error may be an explanation comes from the second row of Table IV.
The coefficient of test scores in all regressions is lower than 1, although one would naturally expect this coefficient to be equal to 1, given that both assessments and test scores have a standard deviation of 10.
But constraining this coefficient to be equal to 1 does not significantly alter the coefficients of interest (first row of Table IV)12.
So what measurement error can explain the baseline estimates? Assume that test scores are noisy measures of the child’s underlying ability:
yi,f,t=yi,f,t∗ +νi,t. (7)
I assume that measurement error is classical (i.e. νi,t is not correlated with ability). In other words, (7) assumes that ability is as precisely measured for low-performing children, average children, and high- performing children.
For the sake of clarity, I drop fixed effects in the so-called structural equation:
ai,f,t=µ+δy∗i,f,t+αrSame Racei,f,t+εi,f,t, (8)
where teachers’ assessments are based on true abilityyi,f,t∗ rather than test scoresyi,f,t. The econometrician does not observe y∗i,f,tand so must estimate equation (8) by regressing on yi,f,t. Then, both the estimate of δ and the estimate ofαr will be biased:
ˆ
αr,OLS =αr+δ·λθ, (9)
where
12Results available on request.
θ = var(ν)/[var(ν) + var(y∗)] and (10)
λ = cov(Same Race, y∗)
var(Same Race)(1−corr(Same Race, y∗)2). (11) Here θ is the size of the measurement error. If, as suggested, Same Race and test scoresy are positively correlated, thenλ >0 and the effect α of same-race teachers on assessments will be overestimated. This result is in the same spirit as developments from the literature on measurement error and statistical discrimination (see e.g. Phelps, 1972).
Given the relative sizeθof the measurement error, one could estimate the unbiased effect of same-race teachers on assessments. Indeed, the corrected value of the test score may be built as follows:
˜
yi,f,t=θ·E[y·,f,t |Same Race] + (1−θ)·yi,f,t. (12)
The estimation of specification (1) on the corrected test score ˜y will then give an unbiased estimate of the effectα of same-race teachers on assessments, conditional on test scores.
But the size of measurement error is unknown, so I estimate the parameter of interestαusing different values ofθ. The lowest size of the measurement error will give an estimate of the measurement error that is required to explain our results.
Results for the baseline specifications with corrected test scores are presented in Table X. For mathe- matics test scores, a measurement error of 30% is required to make the coefficient nonsignificant. Between 40 and 50% of measurement error is required to cancel the point estimate. For English, the required amount of measurement error is smaller. 10% makes the coefficient nonsignificant, and a measurement error of about 30 to 40% cancels the point estimate. In short, in maths, a significant amount of mea- surement error would be necessary to cancel coefficients. Even though this statistic does not exclude a potential confounding effect of measurement error, it suggests that only a large amount of measurement error would alter our conclusions.
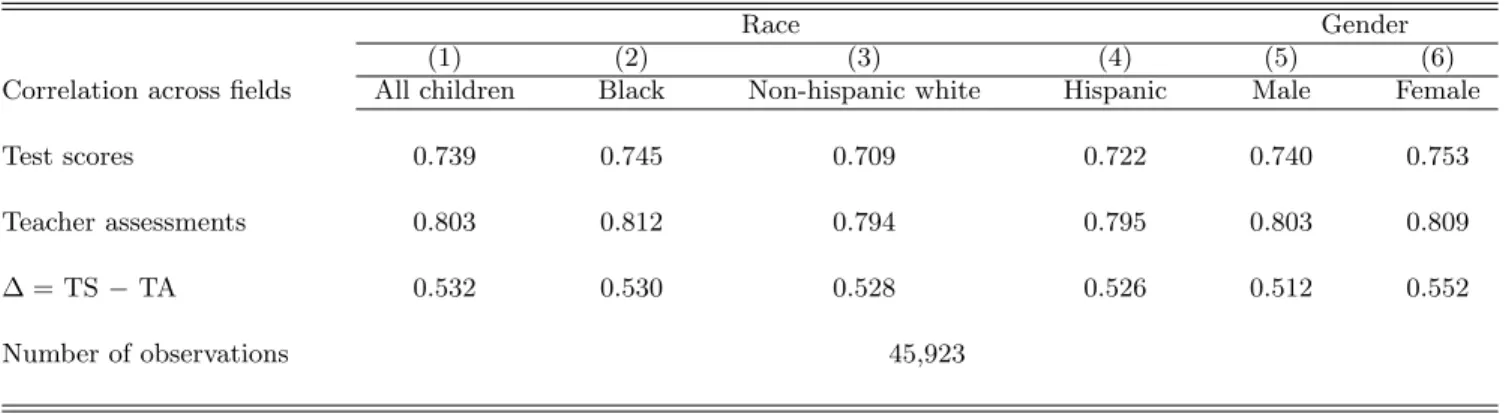
4.3 Are Teacher Assessment–Test Score Gaps Correlated Across Topics?
So far, the analysis has been carried out separately for English and mathematics. It could be fruitful, though, to investigate whether teachers’ perceptions are correlated across topics. More precisely: Are the differences between test scores and teacher assessments correlated in English and in mathematics? On the
one hand, if the gap between assessments and test scores reflects teachers’ perceptions, then these gaps should be correlated across topics. From kindergarten to third grade, it is indeed the same teacher who fills out teacher assessment forms in both English and mathematics. On the other hand, if the difference between teacher assessments and test scores reflects only measurement error, then their correlation across topics should be low.
Defining the gaps between assessments and test scores:
∆i,Mathematics,t = ai,Mathematics,t−yi,Mathematics,t ,
∆i,English,t = ai,English,t−yi,English,t .
Table XI shows the correlation of teacher assessment–test score gaps across fields, race by race and gender by gender. We remark that the correlation is significant and above .5 for all races expect Pacific Islanders. Moreover, the correlation is remarkably stable across races (ranging from .445 to .552), indi- cating that teachers’ perceptions are correlated across fields regardless of race and gender. These figures also suggest that random noise is not likely to explain the main results of this paper.
4.4 Stereotype Threats
Another — important — identification issue arises because students may truly perform better in the classroom when matched to a teacher of the same race. In this case, it is likely that behavior in the classroom will be affected by same-race teaching. There is evidence that stereotype threats can impair both academic performance and psychological engagement with academics (Aronson, Fried and Good, 2002).
Wheeler and Petty (2001) reviewed literature on the link between stereotype activation and behavior.
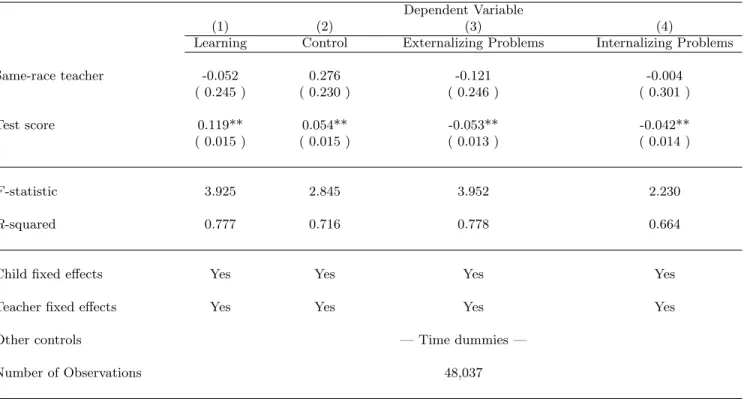
Hence five regressions were performed as a test for stereotype threat:
bki,f,t=mJ(i,f,t)+d·yi,f,t+θi,f +ar·Same Racei,f,t+ei,f,t, (13) where bki,f,t is the kth behavioral measure of pupil i in field f in period t (other notation is as before).
The interpretation of fixed effects is slightly different than in the previous sections, though. Here, bki,f,t is reported by the teacher and the teacher effect mJ(i,f,t) is seen as the average behavioral assessment of teacher J(i, f, t). The θi,f term is the pupil’s average difference between cognitive performance and behavior.
Results are reported in Table XII. There is no significant effect of same-race assessment on behavior,
conditional on test scores in any of the four behavioral dimensions.13 This suggests that the child’s behavior is not significantly affected by same-race teaching conditional on test scores. Stereotype threats are therefore not likely to explain the main results of this paper. These results do not, however, rule out an unconditional effect of same-race teaching on behavior (as in Dee, 2005a).
4.5 Increase in Same-Race Teachers for Minority Children Along the Curriculum
There are many more minority teachers in grade 5 than in kindergarten. As a result, minority children are increasingly likely to move from a teacher of another race to a teacher of their own race as they move from kindergarten to grade 5. Moving from/to a teacher of the same race will therefore be correlated with the child’s race. This is a potential identification issue in specifications 1 and 2. I will therefore design a specification that allows for some correlation between race, gender, and mobility patterns.
Table XIII shows the average characteristics of children who experience different mobility patterns.
‘00100’ means that the child had a teacher of the same race in spring grade 1 and a teacher of a different race in the other four periods (fall kindergarten, spring kindergarten, spring grade 3 and spring grade 5).
Mobility is strongly correlated with race and ethnicity. Only 4% of white children have never been taught by a teacher of the same race, whereas 25% of African American children have always been taught by a teacher of a different race. Column 1 of Table IX shows that although gender is not correlated with same-race teaching, minority pupils are less likely to be matched with a teacher of their own race in the early years of elementary education. There is indeed a correlation between race and mobility patterns, which is not controlled for in specification 1.14
It is possible to condition on the whole history of teacher-student matchings as in Card and Sullivan (1988), which inspired Table XIII. Here, I perform a simpler test, introducing child and teacher fixed effects in the first differenced equation. This allows for some correlation between mobility and children’s observed and unobserved characteristics.
∆ai,f,t = δ∆yi,f,t+αr∆Same Racei,f,t+ui,f +µJ(i,f,t)+νi,f,t, (14)
∆ai,f,t = δ∆yi,f,t+αg∆Same Genderi,f,t+ui,f +µJ(i,f,t)+νi,f,t. (15)
13One behavioral measure, Self-Control and Peers, could not be used as a dependent variable because missing observations would have significantly reduced the sample size.
14Take the first-differenced version of baseline specification 1. Taking the difference removes the individual fixed effect, which includes race and gender. The specification is therefore not identified if race is correlated with Same Racei,f,t+1− Same Racei,f,t, which is nonzero when the student moves from/to a same-race to a different-race teacher.
Notation is as before; ui,f is a child fixed effect, and µJ(i,f,t) is a teacher fixed effect. These two specifications may then account for the observed correlation between race, included in ui,f, and mobility patterns ∆Same Racei,f,tand ∆Same Genderi,f,t. However, a major disadvantage of this specification, is the increased standard errors that it generates.
Table XIV show the results for specifications (14) and (15). A striking fact is that, although standard errors are wider, point estimates are remarkably similar to the estimates of specifications (1) and (2).
Columns 4 and 8 show the estimates for same race pairings on English and math assessments. The effect is not significant for mathematics; it is similar to the baseline estimates (7% in column 4 of Table (IV), and 8% in column 4 of Table XIV). The estimate for English assessments is both significant and close to the baseline estimate: children paired with a teacher of the same race have an assessment that is 4% of a standard deviation higher than other children.
Overall, mobility based on constant observed and unobserved characteristics such as ability, race or gender does not seem to affect baseline estimates.
4.6 Reverse Causality: Do Teacher Assessments Have An Effect on Test Scores?
Baseline results suggest that teachers give significantly higher assessments to children of their own race.
However other stories could explain this result. Teacher assessments may be driving test scores as in the Pygmalion experiment (Rosenthal and Jacobson, 1968), such that expectations do affect educational outcomes. In this scenario, the effect of same-race teaching goes from teacher assessments to test scores, and not vice versa. The following specifications test for potential reverse causality, and empirical results suggest that these stories are not relevant.
Hence, in this falsification test, test scores and teacher assessments are reversed: assessments explain test scores rather than the other way around.
yi,f,t = µJ(i,f,t)+δai,f,t+ui,f +αrSame Racei,f,t+εi,f,t, (16)
yi,f,t = µJ(i,f,t)+δai,f,t+ui,f +αgSame Genderi,f,t+εi,f,t. (17)
Notation is as in the baseline specifications (1) and (2). Results are presented in Table XV: Although the OLS estimates are significantly negative, the effect of same-race teaching becomes nonsignificant when adding a child fixed effect in both the mathematics and English specifications. The effect is also
nonsignificant when controlling for both child and teacher fixed effects. This suggests that reverse causality is unlikely to be a viable alternative story.15
5 How Do Teachers Order Assessments?
Results suggest that teachers give higher assessments to children of their own race. Are assessments still ranked the same way as test scores? Even if the absolute value of teacher assessments is biased, the ranking of teacher assessments in the classroom might still reflect the ranking of children’s cognitive skills.
5.1 Relative versus Absolute Grading
I computed the child’s rank in test scores and teacher assessments within surveyed children in the class- room. Teachers fill out assessment questionnaires only for surveyed children; when no discrimination occurs, the ordering of teacher assessments should be similar to the ordering of test scores.
In the econometric specification, the rank in teacher assessments depends on the rank in test scores, a teacher fixed effect, and a child fixed effect as well as a variable indicating whether the teacher is of the same race or gender:
Rank in ai,f,t = µJ(i,f,t)+δRank in yi,f,t+ui,f+αrSame Racei,f,t+εi,f,t, (18) Rank in ai,f,t = µJ(i,f,t)+δRank in yi,f,t+ui,f+αgSame Genderi,f,t+εi,f,t. (19)
Rank in ai,f,t is the rank in teacher assessments within surveyed children of the classroom for child i in field f in period t as before. Rank inyi,f,t is the rank in test scores within surveyed children of the classroom; µJ(i,f,t) is a teacher effect, and ui,f is a child effect. The coefficients of interest areαr and αg. Results are presented in Table XVI. The OLS estimates of same-race teachers are between 0.09 ranks (mathematics) and 0.119 ranks (English). Controlling for child fixed effects, the teacher race effect falls and remains significant only in English (0.06 ranks). This suggests that some children get better rankings regardless of the teacher’s race. Two-way fixed-effects results are not significant in mathematics and English.
15This assumes that eitheryi,f,t=µJ(i,f,t)+δai,f,t+ui,f+αrSame Racei,f,t+εi,f,torai,f,t=µJ(i,f,t)+δyi,f,t+ui,f+ αrSame Racei,f,t+εi,f,t is the underlying structural equation. But if both equations hold the test doesn’t allow us to disentangle the two effects. This is then a simultaneous equation problem, and an instrument for test scores or assessments is needed.
Combining these results with the baseline results: teachers tend to give betterassessments to children of their race and ethnicity, but they do not seem to alter theranking of students of their race or gender.
5.2 A Small Model of Relative Grading
In fact, relative ranking could potentially explain my main results. I design a small model that explains that identification issue and then test the hypothesis on the dataset. The results do not support ranking as a driving force of my results.
For the sake of clarity, I will design a model that does not capture teacher-student interactions (al- though it could be extended to include them). It can be extended to teacher-student interactions. Assume that teachers order students on a rigid scale and don’t care about the absolute value of the assessments.
Blacks could be overassessed whenever (i) they are more likely to be compared with other black kids than with white kids and (ii) black kids have, on average, lower test scores. If black students are more likely to be compared with underachievers when matched to a teacher of the same race than when not, then the effect of same-race assessments might simply reflect ranking and not teachers’ perceptions.
I design a small model to explain this effect. Each classroom has two students, who can be either black or white. The teacher assessment of a student is either a= a or a = a depending on the child’s ranking in the test scores in the classroom. Each child can be either black (r=b) or white (r=w). The overall fraction of white kids in the population is π. I will use primes to designate the child’s peer (e.g., the peer’s race isr0).
The probability of getting a high assessment when black and when the test score isy depends on the distribution of test scores and the de facto segregation pattern.
P(a=a|r=b, y) = P(y > y0|r =b, y)
= P(y > y0|r =b, y, r0 =b)P(r0 =b|r =b, y) +P(y > y0 |r =b, y, r0 =w)P(r0 =w|r=b, y)
= P(y > y0|r =b, r0 =b)P(r0=b|r =b) +P(y > y0 |r =b, y, r0 =w)P(r0 =w|r=b)
I assume that there is no correlation between the test score and the probability of being matched to a black pupil. Assuming that there is no correlation between test scores in a classroom (i.e. no peer
effects, which is an assumption that can be relaxed), let’s say that the distribution of test scores isfb(y) for blacks and fw(y) for whites. Moreover, the segregation pattern can be described by a single number p=P(r0 =b|r=b) that doesn’t change with test scores, r0⊥y|r. Then
P(a=a|r=b, y) = Fw(y)·(1−p) +Fb(y)·p
and, symmetrically for whites,
P(a=a|r=w, y) = Fw(y)·(1−p0) +Fb(y)·p0
wherep0=P(r0=b|r =w) = 1−ππ (1−p). This leads to the following effect of race on assessments:
δa(y) = P(a=a|r=w, y)−P(a=a|r=b, y)
= [Fw(y)−Fb(y)](p−p0).
If white children have uniformly better test scores and if there is some degree of de facto segregation, thenFb(y)> Fw(y) for ally andp > p0. This leads to lower assessments for white children (i.e. δ <0).
This makes clear that, even in the absence of any form of teacher misperception, there can be effects of the child’s race on teacher assessments. This result relies on the relationship between teacher assessments and classroom composition and is therefore testable.
5.3 Controlling for Peers in the Baseline Equation
My regressions, of course, regress assessments on the interaction between the teacher’s race and the student’s race, and not simply on the latter. However, relative grading might still be a cause of spurious results if the Same Race dummy is correlated with classroom composition. In other words, there is a bias if students who move from a same-race teacher to a teacher of a different race are more likely to move to a classroom with worse peers, conditional on child and teacher fixed effects. In this case, peers’
test scores are correlated with the Same Race dummy, which invalidates the causal interpretation of the identification strategy.
I design two falsification tests. First, I regress a same-race teacher dummy on the average test score in the classroom either conditional on either teacher or child fixed effects. Second, I include peers’ average test score as a control in the baseline regression.
Table XVII shows the regression of a same-race dummy on peers’ test scores. Column 1 shows that there is some correlation between peers’ average test score and being assigned to a teacher of the same race in mathematics. Lower-quality peers are, as expected, more likely to be encountered when students are taught by a teacher of the same race. It is interesting that this effect disappears in column 2, where I control for a child fixed effect in a conditional logit regression. That is, looking at a given child moving from a teacher of the same race to a teacher of another race, peers’ quality does not decline. Column 3 shows that controlling for teacher unobservables is not sufficient to control for peers’ characteristics.
Columns 4 to 6 present similar results for English teachers.
Table XVIII is another piece of evidence that suggests relative ranking is not the whole story. This table shows the results of the baseline regression of Table IV with an additional control for peers’ average test score. These two tables are similar, and the hypothesis that the coefficients of interest (column 8) are equal between those two tables cannot be rejected at 95%. After controlling for peers’ average test scores, child effects, teacher effects, and the test score, the result is that being assessed by a teacher of the same race increases test scores by 7.2% of a standard deviation in mathematics and by 4.4% of a standard deviation in English.
6 Conclusion
This paper uses a unique U.S. longitudinal data set that contains both teacher assessments and test scores.
I assess whether teachers give better assessments to children of their race or gender. Controlling for child and teacher unobservables, I found that teachers give better assessments to children of their own race but not of their own gender. This effect might be due to white teachers giving lower grades to black and to hispanic children. It should be noted that a conservative interpretation of the results cannot determine whether teachers overassess or underassess pupils of their own race. Finally, results show that behavior is not significantly affected by same-race teachers conditional on test scores, teacher effects and student effects. This suggests that stereotype threat does not explain our main results.
This is the first large-scale analysis of teacher assessments versus test scores that uses U.S. elementary education data. Results highlight that teachers’ races determine their perceptions of students’ skills.
Controlled experiments on teachers’ perceptions in U.S. classrooms are needed to assess both (i) how these perceptions affect children performance and (ii) how public policies (e.g. training) can change teachers’ perceptions of their students.
References
Abowd, J., Creecy, R. and Kramarz, F. (2002), Computing person and firm effects using linked longitu- dinal employer-employee dataset.
Abowd, J. M., Kramarz, F. and Margolis, D. N. (1999), ‘High wage workers and high wage firms’, Econometrica67(2), 251–334.
Acemoglu, D. and Angrist, J. (2000), How Large Are Human-Capital Externalities? Evidence from Com- pulsory Schooling Laws, NBER/Macroeconomics Annual, NBER.
Aronson, J., Fried, C. B. and Good, C. (2002), ‘Reducing the effects of stereotype threat on african amer- ican college students by shaping theories of intelligence’,Journal of Experimental Social Psychology .
Card, D. and Sullivan, D. (1988), ‘Measuring the effect of subsidized training programs on movements in and out of employment’,Econometrica 56(3), 497–530.
Clifford, M. and Walster, E. (1973), ‘The effect of physical attractiveness on teacher expectations’, Soci- ology of Education46(2), 248–258.
Clotfelter, C. T., Ladd, H. F. and Vigdor, J. L. (2005), ‘Who teaches whom? race and the distribution of novice teachers’,Economics of Education Review24, 377–392.
Coate, S. and Loury, G. C. (1993), ‘Will affirmative-action policies eliminate negative stereotypes?’, American Economic Review83(5), 1220–40.
Dee, T. S. (2004), ‘Teachers, race, and student achievement in a randomized experiment’,The Review of Economics and Statistics86(1), 195–210.
Dee, T. S. (2005a), ‘A teacher like me: Does race, ethnicity, or gender matter?’, American Economic Review95(2), 158–165.
Dee, T. S. (2005b), Teachers and the gender gaps in student achievement, NBER Working Papers 11660, National Bureau of Economic Research, Inc.
Efron, B. and Tibshirani, R. (1994), An Introduction to the Bootstrap, Chapman & Hall.
Fryer, R. G. and Levitt, S. D. (2006a), ‘The black-white test score gap through third grade’, American Law and Economics Review8(2).
Fryer, R. G. and Levitt, S. D. (2006b), Testing for racial differences in the mental ability of young children, NBER Working Papers 12066, National Bureau of Economic Research, Inc.
Heckman, J. J., Stixrud, J. and Urzua, S. (2006), ‘The effects of cognitive and noncognitive abilities on labor market outcomes and social behavior’,Journal of Labor Economics 24(3), 411–482.
Herrnstein, R. J. and Murray, C. (1994), The Bell Curve: Intelligence and Class Structure in American Life, Free Press.
Hughes, H. (1988), ‘Psychological and behavioral correlates of family violence in child witnesses and victims’,American Journal of Orthopsychiatry58, 77–90.
Kramarz, F., Machin, S. and Ouazad, A. (2007), What makes a test score? the respective contributions of pupils, peers and schools in achievement. mimeo.
Lavy, V. (2004), Do gender stereotypes reduce girls’ human capital outcomes? evidence from a natural experiment, NBER Working Papers 10678, National Bureau of Economic Research, Inc.
Pelcovitz, D., Kaplan, S., Goldenberg, B., Mandel, F., Lehane, J. and Guarrera, J. (1994), ‘Post-traumatic stress disorder in physically abused adolescents’, Journal of American Academy of Child and Ado- lescent Psychiatry33, 305–312.
Phelps, E. S. (1972), ‘The statistical theory of racism and sexism’,American Economic Review62(4), 659–
661.
Rosenthal, R. and Jacobson, L. (1968), Pygmalion in the Classroom, Holt, Rinehart and Winston, New York.
Rothstein, J. (2008), Teacher quality in educational production: Tracking, decay, and student achieve- ment. unpublished manuscript.
Rudner, L. M. and Schafer, W. D. (2001), ‘Reliability’, ERIC Digest .
Steele, C. and Aronson, J. (1998), ‘Stereotype threat and intellectual test performance of african ameri- cans’,Journal of Personality and Social Psychology69(5), 797–811.
Wheeler, S. and Petty, R. (2001), ‘The effects of stereotype activation on behavior: A review of possible mechanisms’,Psychological Bulletin .