Integrated analysis of epigenetic and genetic changes during MDS
progression
DISSERTATION ZUR ERLANGUNG DES DOKTORGRADES
DER NATURWISSENSCHAFTEN (DR. RER. NAT.) DER FAKULTÄT FÜR BIOLOGIE UND VORKLINISCHE MEDIZIN DER UNIVERSITÄT REGENSBURG
vorgelegt von Sandra Pohl (geb. Hoiß)
aus Kösching
im Jahr
2018
Das Promotionsgesuch wurde eingereicht am:
15.06.2018
Die Arbeit wurde angeleitet von:
Prof. Dr. Michael Rehli
Unterschrift:
____________________________
I LIST OF FIGURES ... IV LIST OF TABLES ... VI
1 INTRODUCTION ... 1
1.1 H
EMATOPOIESIS... 1
1.2 C
ONCEPT OF EPIGENETICS... 2
1.2.1 Histone code ... 3
1.2.1.1 Histone acetylation ... 4
1.2.1.2 Histone methylation ... 4
1.2.2 DNA methylation... 5
1.2.2.1 DNA methyltransferases and TET enzymes ... 5
1.2.2.2 Methyl-CpG binding proteins ... 7
1.2.2.3 Crosstalk between DNA methylation and histone modifications ... 9
1.2.3 Non-coding RNAs ... 10
1.3 M
YELODYSPLASTIC SYNDROMES... 11
1.3.1 Pathogenesis of MDS ... 12
1.3.1.1 Gene mutations ...13
1.3.1.2 Cytogenetic aberrations ...15
1.3.1.3 Role of DNA methylation in MDS ...16
1.3.1.4 Differences between adult and pediatric MDS ...17
1.3.2 Clonal evolution during disease progression ... 17
2 RESEARCH OBJECTIVES ...19
3 MATERIALS AND EQUIPMENT...20
3.1 E
QUIPMENT... 20
3.2 C
ONSUMABLES... 22
3.3 C
HEMICALS... 23
3.4 E
NZYMES,
KITS AND PRODUCTS FOR MOLECULAR BIOLOGY... 23
3.5 A
NTIBODIES... 25
3.6 A
NTIBIOTICS... 25
3.7 C
ELL LINES... 25
3.8 E.
COLI STRAINS... 25
3.9 P
LASMIDS... 26
3.10 O
LIGONUCLEOTIDES... 26
3.10.1 PCR primers ... 26
3.10.2 qPCR primers ... 27
3.10.3 RT-qPCR primers ... 28
3.10.4 Sequencing primers ... 28
3.11
GBLOCKS®
GENE FRAGMENTS... 29
II
4 METHODS ...32
4.1 G
ENERAL CELL AND BACTERIA CULTURE METHODS... 32
4.1.1 Cell line culture ... 32
4.1.1.1 Assessing cell number and vitality ...32
4.1.1.2 Culture conditions and passaging ...32
4.1.1.3 Freezing and thawing cells ...33
4.1.1.4 Transfection of THP-1 cells with DEAE dextran ...33
4.1.1.5 Measuring Luciferase activity ...34
4.1.2 Bacterial culture ... 34
4.1.2.1 Bacterial growth medium ...34
4.1.2.2 Glycerol stocks ...35
4.1.2.3 Transformation of chemically competent E.coli ...35
4.1.2.4 Isolation of human white blood cells ...35
4.1.2.5 Isolation of human mononuclear cells by density gradient centrifugation ...36
4.2 G
ENERAL MOLECULAR BIOLOGICAL METHODS... 36
4.2.1 Preparation and analysis of DNA ... 36
4.2.1.1 Isolation of plasmid DNA from E. coli ...36
4.2.1.2 Isolation of genomic DNA from mammalian cells ...36
4.2.1.3 Fragmentation of genomic DNA and chromatin ...37
4.2.1.4 Agarose gel electrophoresis ...37
4.2.1.5 Molecular cloning of vectors ...38
4.2.1.6 Reporter gene assays ...38
4.2.1.7 Gibson assembly ...39
4.2.1.8 Restriction endonuclease digestion ...39
4.2.1.9 Ligation reaction ...40
4.2.1.10 Quantification of DNA ...40
4.2.1.11 Purification of DNA fragments by gel extraction ...40
4.2.1.12 Polyethylene glycol precipitation of DNA ...40
4.2.1.13 Polymerase chain reaction ...41
4.2.1.14 In vitro methylation of DNA ...43
4.2.1.15 Sanger Sequencing ...44
4.2.1.16 Methyl-CpG-immunoprecipitation (MCIp) ...44
4.2.1.17 Chromatin immunoprecipitation (ChIP) ...45
4.2.1.18 Library preparation for next generation sequencing ...51
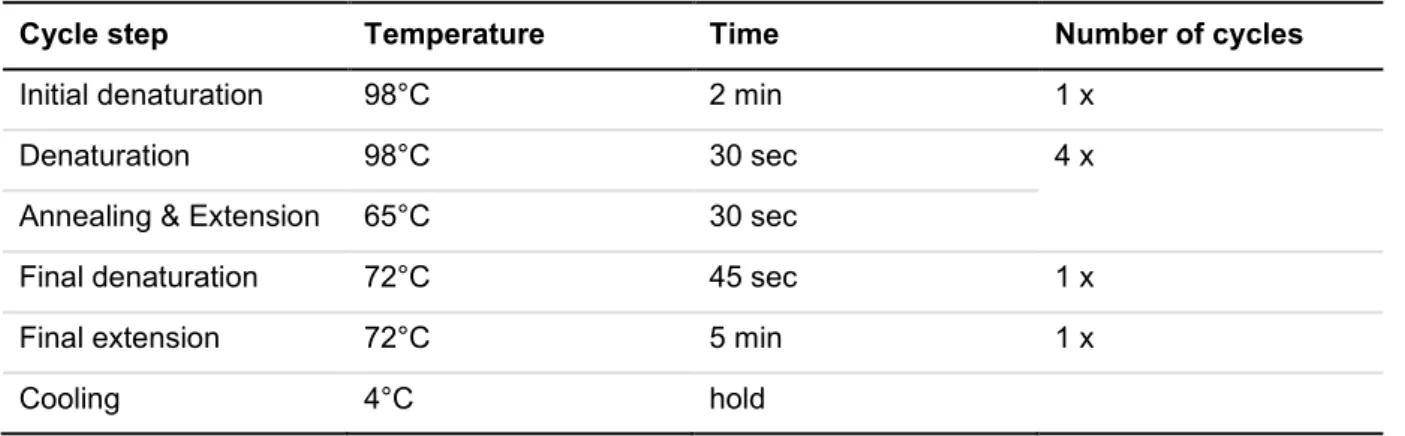
4.2.1.19 Next generation sequencing on the Illumina platform ...60
4.2.1.20 Targeted bisulfite sequencing ...61
4.2.2 Preparation and analysis of RNA ... 68
4.2.2.1 Isolation of total RNA ...68
4.2.2.2 Reverse transcription quantitative real-time PCR (RT-qPCR) ...68
4.2.3 Analyses of NGS data sets ... 69
4.2.3.1 Targeted bisulfite sequencing data ...69
4.2.3.2 MCIp-seq data ...77
III
5.1 A
DULTMDS ... 83
5.1.1 Comprehensive analysis of DNA methylation data of all patients ... 85
5.1.1.1 Identification of DMRs in patients during disease progression ...85
5.1.1.2 Identification of DMRs in comparison to CD34+ cells ...86
5.1.2 Comprehensive analysis of DNA methylation in consecutive samples... 92
5.1.2.1 Detailed analysis of patient P02 ...93
5.1.2.2 Detailed analysis of patient P13 ...99
5.1.2.3 Detailed analysis of patient P15 ...103
5.1.2.4 Detailed analysis of patient P19 ...108
5.1.2.5 Detailed analysis of patient P20 ...112
5.1.2.6 Detailed analysis of patient P53 ...116
5.2 P
EDIATRICMDS... 121
5.2.1 DNA methylation analysis in pediatric MDS ... 121
5.2.2 Changes of DNA methylation during disease progression in pediatric MDS ... 127
5.2.2.1 Detailed analysis of patient D770 – a case with progression ...128
5.2.2.2 Detailed analysis of patients with stable disease ...133
5.3 C
OMPARISONPB
ANDKM ... 135
6 DISCUSSION & PERSPECTIVES ... 139
6.1 E
PIGENETIC AND GENETIC CHANGES INMDS ... 139
6.1.1 Comparison of DNA methylation data in adult MDS patients in order to identify common DMRs ... 140
6.2 I
NTEGRATED ANALYSIS OF EPIGENETIC AND GENETIC CHANGES IN PEDIATRICMDS
PATIENTS145 6.3 C
OMPARABILITY OFDNA
METHYLATION DATA IN PAIRED SAMPLES OF PERIPHERAL BLOOD AND BONE MARROW... 149
6.4 P
ERSPECTIVES... 150
7 SUMMARY ... 152
8 ZUSAMMENFASSUNG ... 153
9 REFERENCES... 154
10 ABBREVIATIONS ... 169
11 APPENDIX ... 175
11.1 A
PPENDIXI – G
ENE REPORTER ASSAYS WITHDMR
S OBTAINED IN ADULTMDS
PATIENTS... 176
11.2 A
PPENDIXII – R
EPORTER GENE ASSAY FROM PEDIATRICMDS
PATIENTD770 ... 180
11.3 A
PPENDIXIII – DNA
METHYLATION ANALYSES AND CLINICAL DATA FROM LONGITUDINALMDS
PATIENTS... 181
ACKNOWLEDGMENT ... 187
IV
F
IGURE1-1 - N
ORMAL HEMATOPOIESIS... 2
F
IGURE1-2 - P
OST-
TRANSLATIONAL HISTONE MODIFICATIONS... 3
F
IGURE1-3 - D
ISTRIBUTION OF ACTIVE AND REPRESSIVE HISTONE MARKS... 4
F
IGURE1-4 – T
HEDNA
METHYLTRANSFERASE FAMILY... 6
F
IGURE1-5 – T
HET
EN-E
LEVEN-T
RANSLOCATION(TET)
PROTEIN FAMILY... 6
F
IGURE1-6 - C
YCLE OFDNA
METHYLATION AND DEMETHYLATION... 7
F
IGURE1-7 - M
EMBERS OF THEM
ETHYL-C
PG-
BINDING(MBP)
PROTEIN FAMILY... 8
F
IGURE1-8 - A
LTERATIONS IN STEM AND PROGENITOR CELLS IN DIFFERENTMDS
RISK CLASSES... 12
F
IGURE1-9 – M
UTATION FREQUENCY OF GENES IN MYELODYSPLASTIC SYNDROMES... 13
F
IGURE1-10 - I
MPACT OF THE TRANSCRIPTION FACTORGATA2 ... 15
F
IGURE1-11 - M
ECHANISM OF LENALIDOMIDE INMDS
PATIENTS WITH DEL5
Q... 16
F
IGURE1-12 - C
LONAL EVOLUTION FROMMDS
TO SAML ... 18
F
IGURE4-1 - N
EXT GENERATION SEQUENCING TECHNOLOGY... 60
F
IGURE4-2 - D
EFINITION OF THE ACTIVE MYELOID REGULOME FOR TARGETED ENRICHMENT... 67
F
IGURE5-1 – D
ISTRIBUTION OF DIFFERENTIALLY METHYLATED REGIONS BETWEEN ALL PATIENTS... 85
F
IGURE5-2 - A
NALYSIS OFDMR
S BETWEENCD34+
CELLS AND ADULTMDS
PATIENTS... 87
F
IGURE5-3 – G
ENOMIC DISTRIBUTION OF COMMONDMR
S IN COMPARISON TOCD34+
CELLS... 88
F
IGURE5-4 - B
AR PLOT OF GENE REPORTER ASSAYS IN ADULTMDS
PATIENTS... 91
F
IGURE5-5 - PCA
OF ALL ADULTMDS
PATIENTS WITH CONSECUTIVE SAMPLES AND CONTROLS... 93
F
IGURE5-6 – DNA
METHYLATION ANALYSIS AND ASSOCIATED EPIGENETICS OF PATIENTP02
IN COMPARISON TOCD34+
CELLS... 95
F
IGURE5-7 - H
ISTOGRAM OFDNA
METHYLATION IN DIFFERENT GENOMIC REGIONS USING PUBLICLY AVAILABLE DATA SETS(P02) .. 97
F
IGURE5-8 - DNA
METHYLATION ANALYSIS BETWEEN TIME POINTS AND COMPARISON WITH GENETIC AND CLINICAL DATA... 98
F
IGURE5-9 - DNA
METHYLATION ANALYSIS AND ASSOCIATED EPIGENETICS OF PATIENTP13
IN COMPARISON TOCD34+
CELLS.... 101
F
IGURE5-10 - H
ISTOGRAM OFDNA
METHYLATION IN DIFFERENT GENOMIC REGIONS USING PUBLICLY AVAILABLE DATA SETS(P13) ... 101
F
IGURE5-11 - DNA
METHYLATION ANALYSIS OF PATIENTP13
AND COMPARISON WITH GENETIC AND CLINICAL DATA... 102
F
IGURE5-12 - DNA
METHYLATION ANALYSIS AND ASSOCIATED EPIGENETICS OF PATIENTP15
IN COMPARISON TOCD34+
CELLS.. 105
F
IGURE5-13 - H
ISTOGRAM OFDNA
METHYLATION IN DIFFERENT GENOMIC REGIONS USING PUBLICLY AVAILABLE DATA SETS(P15) ... 105
F
IGURE5-14 - DNA
METHYLATION ANALYSIS OF PATIENTP15
AND COMPARISON WITH GENETIC AND CLINICAL DATA... 107
F
IGURE5-15 - A
METHYLATION ANALYSIS AND ASSOCIATED EPIGENETICS OF PATIENTP19
IN COMPARISON TOCD34+
CELLS... 110
F
IGURE5-16 -H
ISTOGRAM OFDNA
METHYLATION IN DIFFERENT GENOMIC REGIONS USING PUBLICLY AVAILABLE DATA SETS(P19) 110
F
IGURE5-17 - DNA
METHYLATION ANALYSIS OF PATIENTP19
AND COMPARISON WITH GENETIC AND CLINICAL DATA... 111
V F
IGURE5-19 -H
ISTOGRAM OFDNA
METHYLATION IN DIFFERENT GENOMIC REGIONS USING PUBLICLY AVAILABLE DATA SETS(P20) 114
F
IGURE5-20 - DNA
METHYLATION ANALYSIS OF PATIENTP20
AND COMPARISON WITH GENETIC AND CLINICAL DATA... 115
F
IGURE5-21 - DNA
METHYLATION ANALYSIS AND ASSOCIATED EPIGENETICS OF PATIENTP53
IN COMPARISON TOCD34+
CELLS.. 118
F
IGURE5-22 -H
ISTOGRAM OFDNA
METHYLATION IN DIFFERENT GENOMIC REGIONS USING PUBLICLY AVAILABLE DATA SETS(P53) 118 F
IGURE5-23 - DNA
METHYLATION ANALYSIS OF PATIENTP53
AND COMPARISON WITH GENETIC AND CLINICAL DATA... 120
F
IGURE5-24 – T-SNE
WITH GLOBALDNA
METHYLATION DATA IN42
PEDIATRICMDS
PATIENTS ANDW
ILCOXON TEST... 123
F
IGURE5-25 - G
ENOME BROWSER SNAPSHOT OF THEDMR
LOCATED IN ZIC5 ... 126F
IGURE5-26 - T-SNE
WITH GLOBALDNA
METHYLATION DATA IN8
PEDIATRICMDS
PATIENTS WITH LONGITUDINAL SAMPLES... 128
F
IGURE5-27 – T
IME LINE WITH CLINICAL DATA OF PATIENTD770
DURING DISEASE PROGRESSION... 129
F
IGURE5-28 - S
CATTER PLOTS OF GLOBALDNA
METHYLATION DATA FROM PATIENTD770
AND CONTROL MONOCYTES... 130
F
IGURE5-29 -
K-MEANS CLUSTERING OF PATIENT SPECIFIC REGIONS AND ANNOTATION OF EPIGENETIC DATA INHSC
S... 131
F
IGURE5-30 - B
OX PLOT OF GENE REPORTER ASSAYS IN PATIENTD770
AND GENOME BROWSER OFVENTX
REGION... 132
F
IGURE5-31 - DNA
METHYLATION ANALYSIS AND CLINICAL DATA OF PATIENTD151 ... 134
F
IGURE5-32 - C
OMPARISON OF GLOBALDNA
METHYLATION IN PERIPHERAL BLOOD AND BONE MARROW SAMPLES... 136
F
IGURE5-33 - G
ENOME BROWSER TRACK OFHOXA
CLUSTER FORMDS
PATIENTS AND HEALTHY DONORS... 138
F
IGURE11-1 - G
ENOME BROWSER TRACK OF SELECTED REGION FORRUNX1
GENE REPORTER ASSAY... 176
F
IGURE11-2 - G
ENOME BROWSER TRACK OF SELECTED FIRST REGION FORFOXO3
GENE REPORTER ASSAY... 177
F
IGURE11-3 - G
ENOME BROWSER TRACK OF SELECTED SECOND REGION FORFOXO3
GENE REPORTER ASSAY... 178
F
IGURE11-4 - G
ENOME BROWSER TRACK OF SELECTED REGION FORZFPM1
GENE REPORTER ASSAY... 179
F
IGURE11-5 – B
AR PLOT OF GENE REPORTER ASSAY IN PEDIATRICMDS
PATIENTD770 ... 180
F
IGURE11-6 - DNA
METHYLATION ANALYSES AND CLINICAL DATA FROM PATIENTD271 ... 181
F
IGURE11-7 - DNA
METHYLATION ANALYSES AND CLINICAL DATA FROM PATIENTD342 ... 182
F
IGURE11-8 - DNA
METHYLATION ANALYSES AND CLINICAL DATA FROM PATIENTD569 ... 183
F
IGURE11-9 - DNA
METHYLATION ANALYSES AND CLINICAL DATA FROM PATIENTD762 ... 184
F
IGURE11-10 - DNA
METHYLATION ANALYSES AND CLINICAL DATA FROM PATIENTD801 ... 185
F
IGURE11-11 - DNA
METHYLATION ANALYSES AND CLINICAL DATA FROM PATIENTD807 ... 186
VI
T
ABLE3-1 - L
IST OF ANTIBODIES... 25
T
ABLE4-1 - A
NTIBIOTICS FOR SELECTIVE BACTERIAL CULTURE... 34
T
ABLE4-2 - P
ARAMETERS FOR FOCUSED ULTRASONICATION WITHC
OVARIS... 37
T
ABLE4-3 - A
GAROSE CONCENTRATIONS FOR DIFFERENT SEPARATION RANGES... 38
T
ABLE4-4 - R
EACTION COMPOSITION FORG
IBSON ASSEMBLY... 39
T
ABLE4-5 - R
EACTION COMPOSITION FOR STANDARDPCR ... 41
T
ABLE4-6 - C
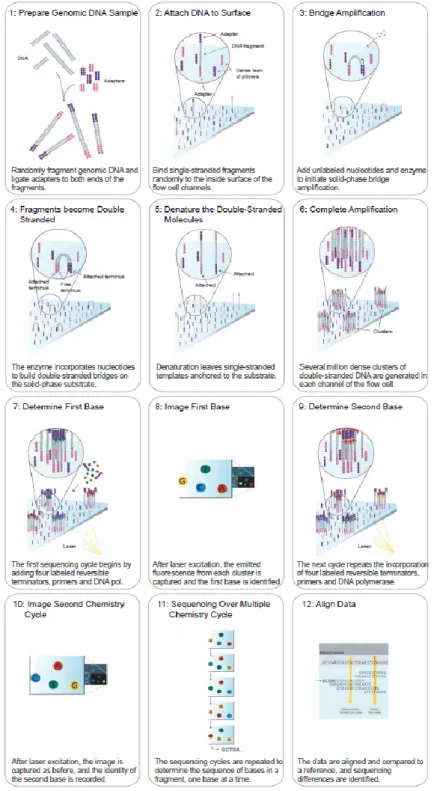
YCLING PROTOCOL FOR STANDARDPCR ... 42
T
ABLE4-7 - R
EACTION COMPOSITION FOR QPCR ... 42
T
ABLE4-8 - C
YCLING PROTOCOL FOR QPCR ... 43
T
ABLE4-9 - R
EACTION COMPOSITION FOR IN VITRO METHYLATION... 43
T
ABLE4-10 -
QPCR
CONTROL LOCI FORMCI
P... 44
T
ABLE4-11 - R
EACTION COMPOSITION FOR END REPAIR(NGS
LIBRARY PROTOCOLI) ... 51
T
ABLE4-12 - R
EACTION COMPOSITION FORA-
OVERHANG INTRODUCTION(NGS
LIBRARY PROTOCOLI) ... 52
T
ABLE4-13 - R
EACTION COMPOSITION FOR ADAPTER LIGATION(NGS
LIBRARY PROTOCOLI) ... 52
T
ABLE4-14 - R
EACTION COMPOSITION FORPCR
ENRICHMENT(NGS
LIBRARY PROTOCOLI) ... 53
T
ABLE4-15 – C
YCLING PROTOCOL FORPCR
ENRICHMENT(NGS
LIBRARY PROTOCOLI) ... 53
T
ABLE4-16 - R
EACTION COMPOSITION FOR END REPAIR(NGS
LIBRARY PROTOCOLII) ... 54
T
ABLE4-17 - R
EACTION COMPOSITION FORA-
OVERHANG INTRODUCTION(NGS
LIBRARY PROTOCOLII) ... 54
T
ABLE4-18 - R
EACTION COMPOSITION FOR ADAPTER LIGATION(NGS
LIBRARY PROTOCOLII) ... 55
T
ABLE4-19 - R
EACTION COMPOSITION FORPCR
ENRICHMENT(NGS
LIBRARY PROTOCOLII) ... 55
T
ABLE4-20 - C
YCLING PROTOCOL FORPCR
ENRICHMENT(NGS
LIBRARY PROTOCOLII) ... 55
T
ABLE4-21 - R
EACTION COMPOSITION FORPCR
ENRICHMENT(NGS
LIBRARY PROTOCOLIII) ... 56
T
ABLE4-22 – C
YCLING PROTOCOL FORPCR
ENRICHMENT(NGS
LIBRARY PROTOCOLIII) ... 57
T
ABLE4-23 - C
YCLING PROTOCOL PART2
FORPCR
ENRICHMENT(NGS
LIBRARY PROTOCOLIII) ... 57
T
ABLE4-24 - R
EACTION COMPOSITION FOR END REPAIR REACTION(NGS
LIBRARY PROTOCOLIV) ... 58
T
ABLE4-25 - R
ECOMMENDED ADAPTER WORKING CONCENTRATIONS... 58
T
ABLE4-26 - R
EACTION COMPOSITION FOR ADAPTER LIGATION(NGS
LIBRARY PROTOCOLIV) ... 58
T
ABLE4-27 - R
EACTION COMPOSITION FORPCR
ENRICHMENT(NGS
LIBRARY PROTOCOLIV) ... 59
T
ABLE4-28 - C
YCLING PROTOCOL FORPCR
ENRICHMENT(NGS
LIBRARY PROTOCOLIV) ... 59
T
ABLE4-29 - P
ARAMETERS FOR FOCUSED ULTRASONICATION WITHC
OVARIS FOR TARGETEDB
IS-S
EQ... 61
T
ABLE4-30 - R
EACTION COMPOSITION FOR END REPAIR REACTION(T
ARGETED BISULFITE SEQUENCING) ... 62
T
ABLE4-31 - R
EACTION COMPOSITION FORA-
TAILING REACTION(T
ARGETED BISULFITE SEQUENCING) ... 62
T
ABLE4-32 - R
EACTION COMPOSITION FOR LIGATION REACTION(T
ARGETED BISULFITE SEQUENCING) ... 63
VII
T
ABLE4-34 - C
YCLING PROTOCOL FORPCR
ENRICHMENT(T
ARGETED BISULFITE SEQUENCING) ... 64
T
ABLE4-35 - R
EACTION COMPOSITION FOR HYBRIDIZATION REACTION(T
ARGETED BISULFITE SEQUENCING) ... 64
T
ABLE4-36 - G
UIDE FOR WASHING BEADS(T
ARGETED BISULFITE SEQUENCING) ... 65
T
ABLE4-37 - R
EACTION COMPOSITION FORP
OST-C
APTURELM-PCR (T
ARGETED BISULFITE SEQUENCING) ... 65
T
ABLE4-38 - C
YCLING PROTOCOL FORP
OST-C
APTURELM-PCR (T
ARGETED BISULFITE SEQUENCING) ... 65
T
ABLE4-39 - R
EACTION COMPOSITION FORRT-
QPCR... 68
T
ABLE5-1 - C
LINICAL DATA OF SIX ADULTMDS
PATIENTS... 84
T
ABLE5-2 - GO
ANALYSIS OF COMMONDMR
S WITH LOSS OFDNA
METHYLATION IN COMPARISON TOCD34+
CELLS... 89
T
ABLE5-3 - GO
ANALYSIS OF COMMONDMR
S WITH GAIN OFDNA
METHYLATION IN COMPARISON TOCD34+
CELLS... 90
T
ABLE5-4 - C
LINICAL DATA AND MUTATIONAL FREQUENCIES OF42
PEDIATRICMDS
PATIENTS... 122
T
ABLE5-5 - GO
TERM ANALYSIS OFDMR
S BETWEEN PEDIATRICMDS
PATIENTS OF THE TWO CLUSTERS... 125
T
ABLE5-6 - C
LINICAL DATA OF PEDIATRICMDS
PATIENTS WITH CONSECUTIVE SAMPLES... 127
T
ABLE5-7 - C
LINICAL DATA OF HEALTHY DONORS ANDMDS
PATIENTS... 135
1
1 Introduction
1.1 Hematopoiesis
The formation of all cellular blood components from hematopoietic stem cells (HSCs), which reside in the bone marrow, is called hematopoiesis. These important cells are capable to self-renew and have the potential to differentiate into diverse precursor cells ensuring continuous sustenance with all blood cells
1. Hematopoiesis in vertebrates begins in the extraembryonic yolk salc and placenta with erythroid progenitors having no pluripotency and no self-renewal potential. This first so called primitive wave or embryonic hematopoiesis is followed by the definitive wave (adult hematopoiesis), involving multipotent HSCs born in the aorta-gonad-mesonephros (AGM) region and placenta followed by migration to the fetal liver and bone marrow
1,2. Development of all blood cell lines takes place in a hierarchical manner, with Long-term HSC (LT-HSC) and Short-term HSCs (ST-HSC) on top giving rise to various progenitor cells accompanied by successive loss of self-renewal capacity. The multipotent progenitor (MPP) either commits to the lymphoid or myeloid lineage, generating the common myeloid progenitor (CMP) or the granulocyte-monocyte-lymphoid progenitor (GMLP), respectively. The last progenitors in the hierarchy, involving the megakaryocyte-erythrocyte progenitor (MEP), granulocyte- monocyte progenitor (GMP) and the common lymphoid progenitor (CLP) finally generate functional blood cells
3,4(see Figure 1-1).
Regulation of hematopoiesis is carried out by two categories of transcription factors, one for formation
and function of hematopoietic stem cells (HSCs) and one for cell lineage specific differentiation. The
first class includes transcription factors like MLL (mixed lineage-leukemia gene), RUNX1 (Runt-related
transcription factor 1), ETV6 (Ets variant 6) or LMO2 (LIM domain only 2). Transcription factors like
PU.1 (Spi-1 Proto-Oncogene), GATA (GATA Binding Protein) or C/EBP (CCAAT/Enhancer Binding
Protein) are involved in expression of lineage-specific genes and are assigned in the second class of
before mentioned TFs. Alterations in this regulatory network of transcription factors, either due to
mutations or altered signal transduction result in loss of differentiation potential and uncontrolled cell
proliferation. This state can lead to the formation of leukemia, whereas one has to distinguish between
acute or chronic ones as well as between myeloid or lymphoid leukemia
4,5.
2
Figure 1-1 - Normal hematopoiesisLT- and ST-HSCs give rise to various types of progenitor cells, finally leading to functional blood cells. LT-HSC:
Long-term HSC, ST-HSC: Short-term HSC, MPP: multipotent progenitor, CMP: common myeloid progenitor, MEP: megakaryocyte-erythrocyte progenitor, GMP: granulocyte-monocyte progenitor, GMLP: granulocyte- monocyte-lymphoid progenitor, CLP: common lymphoid progenitor (modified from Blank et al.3).
1.2 Concept of epigenetics
In 1942, Conrad Waddington initially defined the term „epigenetics“ as „the branch of biology which
studies the causal interactions between genes and their products which bring the phenotype into
being”
6. Nowadays this refers to a variety of processes that have heritable effects on gene expression
programs without changes in DNA sequence during mitosis or meiosis. These processes are essential
in multiple normal cellular processes, like embryonic development, imprinting or differentiation
7,8. Gene
expression is controlled by four different epigenetic mechanisms, involving posttranslational histone
modifications, non-coding RNAs (ncRNAs)
9, chromosomal architecture and DNA methylation
10.
Besides genetic changes, many common diseases such as cancer are caused by alterations in gene
expression due to epigenetic changes. Hence, integrated analysis of epigenetic and genetic changes
may help to figure out where diseases, especially cancer, originate
11. The present work mainly focuses
on DNA methylation, where cancer cells often show aberrant patterns which can be addressed in
some cases by medical treatment.
3
1.2.1 Histone code
In eukaryotes, DNA is packed into chromatin, which consists of DNA, histone proteins and non-histone proteins
12,13. The complex of DNA and histones is designated as nucleosome. This basic subunit of chromatin consists of 147 base pairs (bp) of DNA that is ~1.7 times wrapped around a histone octamer comprised of two copies each of histones H2A, H2B, H3 and H4
14. The arrangement of the nucleosomes resembles a structure similar to beads on a string linked by short stretches of DNA, the so called linker DNA
15. A flexible and non-structured N-terminal tail that protrudes from the nucleosome is subject to extensive post-translational modifications (PTMs)
16,17. Those different chemical modifications of histones, also known as histone marks, are important for transcriptional regulation. Depending on the influence of adjacent modifications, the “histone code” can be decoded in different ways, meaning that one specific histone modification can have either activating or repressive consequences
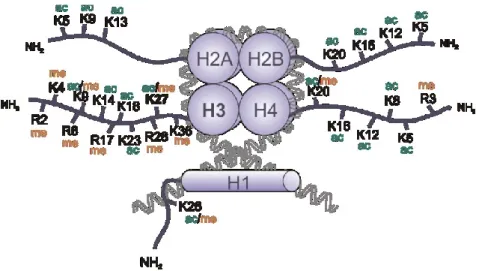
18,19. There are several different histone modifications, including acetylation, methylation, phosphorylation, deamination, β-N-acetylglucosamination, ADP ribosylation, ubiquitylation and sumoylation, that can be found on over 60 distinct histone positions
20,21(see Figure 1-2). The two histone modifications, acetylation and methylation, are the most important ones regulating the transcriptional state and are therefore highlighted in the following sections.
Figure 1-2 - Post-translational histone modifications
The N-terminal tails of the four core histones H2A, H2B, H3 and H4 are subject of acetylation (ac) and methylation (me) on lysine (K) and arginine (R) residues. Moreover, histone tails can be phosphorylated, sumoylated and ubquitinylated, not only at lysine and arginine but also at serine and threonine residues (adopted from Bhartiya et al.22).
4
1.2.1.1 Histone acetylation
Histone acetylation is set and erased by histone acetyltransferases (HATs) and histone deacetylases (HDACs), respectively
7. This modification occurs on lysine residues and is associated with active transcription (see Figure 1-3). The neutralizing effect of acetylation on the positive charge of histones weakens the interaction between the negatively charged DNA and histones resulting in an open chromatin structure. Due to this accessible state, transcription can be promoted by binding of several bromodomain-containing factors
23.
1.2.1.2 Histone methylation
Histone methylation mainly occurs on the two basic residues lysine and arginine and is controlled by histone methyl transferases (HMTs) and histone demethylases, that possess stronger site specificity than HAT or HDAC
20,24,25. In contrast to histone acetylation, histone methylation is associated with activation or repression, depending on the influence of the neighborhood. Another thing one has to keep in mind is that histone methyltransferases can methylate their target residues to a different extend. Lysine residues can be mono-, di- and trimethylated, whereas arginine can be monomethylated as well as symmetrically or unsymmetrically dimethylated
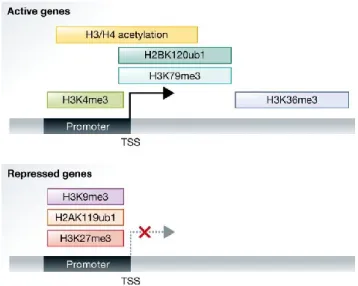
21,26. Histone H3 methylation including H3K4, H3K36 and H3K79 are associated with active transcribed chromatin, while di- as well as trimethylation of H3K9 and H3K27 is linked to transcriptional repression
13,27(see Figure 1-3). Important examples of both groups are H3K4me3 that marks promoters of actively transcribed genes, whereas H3K27me3 is associated with transcriptional repressed genes
28.
Figure 1-3 - Distribution of active and repressive histone marks
Active genes are associated with H3 and H4 acetylation, trimethylation of H3K4, trimethylation of H3K79, trimethylation of H3K36 and ubiquitylation of H2B on lysine 120. Repressed genes typically carry trimethylation of H3K27, trimethylation of H3K9 and ubiquitylation of H2A on lysine 119 (adopted from Zhang et al.28).
5
1.2.2 DNA methylation
5-methylcytosine, also known as “the fifth base” of DNA is produced by the attachment of a methyl group (CH
3) to the 5’ carbon atom of the base cytosine, catalyzed by DNA methyltransferases (DNMTs)
29. DNA methylation mainly occurs in CpG dinucleotides (cytosines adjacent to guanines) but can also be observed at non-CpG sites, such as CpA, CpT, and CpC, primarily found in embryonic stem (ES) cells, induced pluripotent stem cells (iPS cells), neurons, oocytes and glial cells
30. CpG dinucleotides are not equally distributed throughout the genome and are underrepresented compared to other dinucleotides possibly because of the higher tendency of 5-methylcytosine for deamination
31. Deamination of cytosine gives rise to uracil and is recognized as foreign, which is then repaired subsequently. In contrast, deamination of 5-methylcytosine results in the formation of the naturally occurring base thymidine and is not replaced resulting in loss of cytosines throughout the genome.
CpG dinucleotides are enriched in so called CpG islands (CGIs) that are often associated (37%) with promoter regions and are preferentially unmethylated in comparison to CpG dinucleotides located beyond CGIs. Basically, the methylation status of CpGs influences regulation of gene expression and is involved in several biological processes such as embryonic development
32,33, genomic imprinting
34,35, mammalian X-chromosome inactivation
35–37or tissue-specific gene expression
38–40. Misregulation of DNA methylation may result in aberrant DNA methylation patterns and can lead to different diseases, particularly hematopoietic malignancies such as acute myeloid leukemia or myelodysplastic syndromes
41–43, underpinning the important role of DNA methylation.
1.2.2.1 DNA methyltransferases and TET enzymes
There are five different DNA methyltransferases in mammals belonging to three distinct families, namely DNMT1, DNMT2 and DNMT3
44–46. DNMT3a and DNMT3b are de novo methyltransferases targeting former unmethylated CpG dinucleotides and are important during embryonic development.
DNMT1, also known as maintenance methyltransferase, shows a higher preference for
hemimethylated DNA and reestablishes DNA methylation patterns after DNA replication
45,47,48.
Recognition and recruitment of DNMT1 to hemimethylated CpGs during replication is carried out by
the cofactor UHRF1 (ubiquitin like with PHD and ring finger domains 1)
47,49. The last two remaining
members of mammalian DNMTs do not methylate DNA. DNMT2 was shown to methylate RNA
molecules, while DNMT3L is catalytically inactive and furthermore highly expressed in germ and ES
cells probably acting as a cofactor. But all have a common structure consisting of an N-terminal
regulatory domain and a C-terminal catalytic domain, with DNMT2 as exception lacking the N-terminal
domain. Moreover they share ten characteristic sequence motifs, most of them being highly conserved
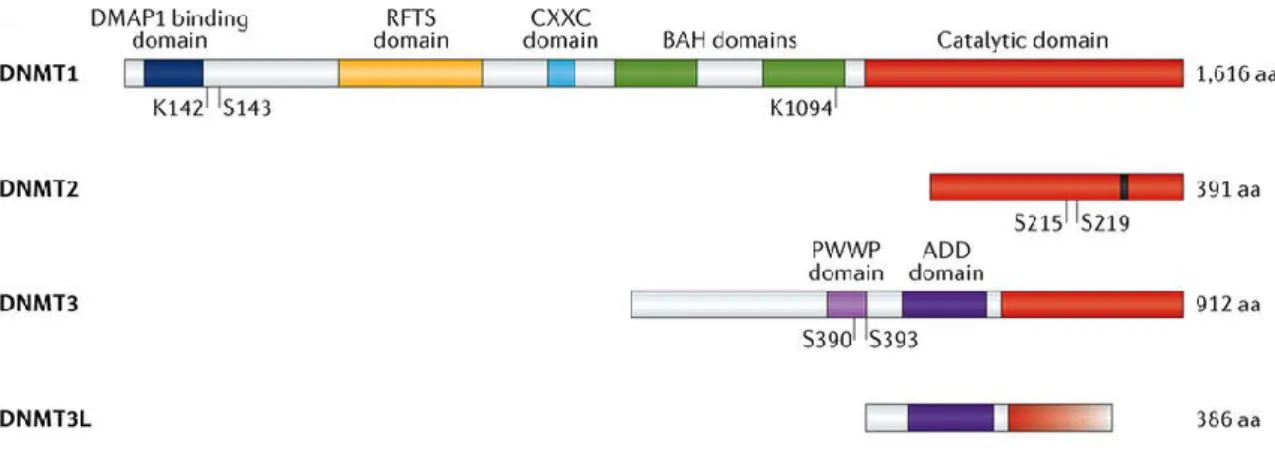
(see Figure 1-4)
46,50,51.
6
Figure 1-4 – The DNA methyltransferase familyThe four different mammalian DNA methyltransferases share a conserved catalytic domain (red), with DNMT3L as exception lacking the C-terminal part of this catalytic domain. The regulatory domain of DNMT1 consists of four different domains, namely the DMAP1 binding (blue), the RFTS (yellow), the CXXC (light blue) domain and two BAH (green) domains. DNMT3 isoforms contain a PWWP (light purple) and ADD (purple) domain, whereas DNMT3L is lacking the latter domain. DMAP1: DNA methyltransferase 1-associated protein 1, RFTS: replication foci targeting sequence, CXXC: cysteine-rich zinc finger, BAH: bromo-adjacent homology, PWWP: proline- tryptophan-tryptophan-proline, ADD: ATRX–DNMT3–DNMT3L (modified from Lyko et al.46).
Although in general DNA methylation is a stable and heritable modification, locally, DNA methylation patterns undergo dynamic changes including both, methylation and demethylation in a tissue specific manner
52–55. Demethylation of 5mC can occur in several ways, either passively by inhibition of the DNA methylation machinery and subsequent dilution of methylation during replication (passive DNA methylation) or actively by removal of methyl groups mediated by Ten-Eleven-Translocation proteins (active DNA methylation). This TET protein family comprises three members, TET1, TET2 and TET3, which have a common core catalytic domain required for oxidation of 5mC (see Figure 1-5). This core catalytic domain consists of a conserved double-stranded β-helix (DSBH) domain, a cysteine-rich domain as well as Fe(II) and 2-oxoglutarate (2-OG) binding sites and is responsible for binding to CpGs
56.
Figure 1-5 – The Ten-Eleven-Translocation (TET) protein family
The core catalytic domain of all TET enzymes consists of a cysteine-rich (Cys) domain, binding sites for the cofactors Fe(II) and 2-oxoglutarate and the DSBH (conserved double-stranded β-helix) domain.
TET1 and TET3 have an additional CXXC domain on their N-terminus important for binding to DNA (adopted from Rasmussen et al.56).
7 TET proteins iteratively oxidize 5mC to 5-hydroxymethylcytosine (5hmC), 5- formylcytosine (5fC) and 5-carboxylcytosine (5caC) (see Figure 1-6). The last two mentioned variants of cytosine can be replaced by an unmodified cytosine via base excision repair (BER) or thymine DNA glycosylase (TDG)-mediated excision.
Alternatively, the two deaminases APOBEC3 and AID can convert 5hmC into 5-hydroxymethyluracil (5hmU) which is then replaced by an unmodified cytosine via TDG/BER
57–61.
Figure 1-6 - Cycle of DNA methylation and demethylation
Cytosine is methylated via DNA methyltransferases to 5mC and this in turn is demethylated by repeated oxidation through TET oxygenases including the intermediates 5-hydroxymethylcytosine (5hmC), 5-formylcytosine (5fC) and 5-carboxylcytosine (5caC). The two oxidized forms 5fC and 5caC can be removed via TDG (thymine DNA glycosylase) mediated excision or BER and replaced by an unmodified cytosine. Involvement of the two deaminases AID and APOBEC leads to the formation of 5-hydroxymethyluracil (5hmU) from 5hmC and subsequent conversion into cytosine via base excision repair (BER) (modified from Kunimoto et al.62).
1.2.2.2 Methyl-CpG binding proteins
Transcriptional repression of genes through DNA methylation is caused by two different mechanisms.
Firstly, the methyl group may prevent binding of sequence specific transcription factors (TFs) required for gene expression. The second possibility involves the recruitment of Methyl-CpG-binding proteins (MBPs) which either prevent binding of other factors or directly influence repression
37,48,63.
In the early 90s, the first two proteins possessing affinity for methylated DNA were described. MeCP1
and MeCP2 are both able to bind methylated CpGs, whereas MeCP1 requires a group of at least
twelve methylated sites for strong binding and MeCP2 only a single methyl-CpG pair
64,65. Later it was
8 shown that MeCP1 is a big complex containing MBD2 as well as all NuRD (Nucleosome Remodeling Deacetylase) components and represses transcription by recruitment of histone deacetylases and corepressor proteins
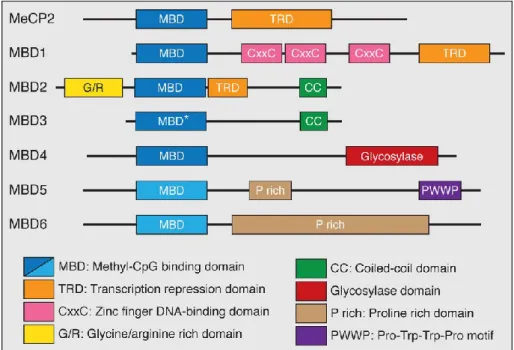
66–68. Today, the MBD family consists of seven members: MeCP2, MBD1, MBD2, MBD3, MBD4, MBD5 and MBD6 (see Figure 1-7). Despite their shared conserved Methyl-CpG binding domain, only MeCP2, MBD1, MBD2 and MBD4 are able to bind methylated DNA
69.
Figure 1-7 - Members of the Methyl-CpG-binding (MBP) protein family
The MBD family comprises MeCP2, MBD1-MBD6 with MeCP2 as founding member. All MBPs contain a highly conserved methyl-binding domain (MBD) for binding methylated DNA, whereas MBD3 has a point mutation (*) in this domain. In addition, MeCP2, MBD1 and MBD2 have a common transcriptional repressor domain (TRD).
MBD1 also contains 3 cysteine rich zinc fingers (CXXC) and MBD2 harbors a glycine-arginine (GR) repeat as well as a C-terminal coiled-coil (CC) domain. This CC domain can also be found in MBD3. Besides the conserved MBD, MBD4 contains a C-terminal DNA glycosylase domain important for DNA repair. The last two members, MBD5 and MBD6, contain proline rich domains (P rich) while MBD5 has an additional PWWP motif that binds methylated histones (modified from Wood et al.70).
Structural analyses of MeCP2 identified two important domains, the MBD and the transcriptional repressor domain (TRD). The same is true for MBD1, but it contains three additional cysteine-rich domains (CXXC) where one of those is able to bind unmethylated DNA, therefore allowing repression of methylated and unmethylated DNA. MBD2 is a component of the MeCP1 complex and harbors a CpG-density dependent binding affinity. Structurally, it is characterized by two additional domains, the glycine/arginine rich domain (G/R) and the coiled-coil (CC) domain
71,72.
MBD3 is exceptional among the MBD protein family in that harboring a point mutation in the Methyl-
CpG binding domain resulting in loss of methyl-CpG binding capacity. Furthermore, MBD3 represents
a subunit of the NuRD complex
73. Another outstanding feature among MBPs is the glycosylase
domain of MBD4 allowing involvement in DNA repair
66,69,70. The last two remaining members, MBD5
9 and MBD6, are not able to bind methylated DNA and localize preferentially to pericentric heterochromatin
74.
Besides the MBD proteins, the group of the so called DNA methylation readers includes the Kaiso family proteins and the SRA (SET- and Ring finger-associated) domain family. They can be differentiated due to their lack of the MBD domain. In contrast, Kaiso harbors several C-terminal zinc finger domains facilitating the binding to methyl-CpGs. Kaiso is also able to bind to an unmethylated specific consensus sequence, the Kaiso binding sequence (KBS), making it a bifunctional protein
75–77. The last group of DNA methylation readers, the SET- and Ring finger-associated protein family, comprises the two members UHRF1 and UHRF2 which are known to bind hemimethylated DNA
66.
1.2.2.3 Crosstalk between DNA methylation and histone modifications
Gene expression is regulated by DNA methylation as well as histone modifications, while DNA methylation is a stable long-term repressive mark compared to histone modifications. Since these two mechanisms do not act independently, interaction partners are necessary facilitating the epigenetic crosstalk. Both, Polycomb (PcG) and Trithorax (TrxG) group proteins, are the main interaction partners and are maintaining the balance of stable repression and activation of gene expression
49,78. They are evolutionarily conserved and working antagonistically to enable the correct expression of genes necessary for cell differentiation and developmental processes
79. It was shown that recruitment of these two protein groups to chromatin is carried out by regulatory elements, called PcG and TrxG response elements (PREs and TREs)
80.
The Polycomb group proteins (PcGs) are responsible for gene silencing and can be divided into two main complexes, Polycomb repressive complex 1 (PRC1) and PRC2. Polycomb repressive complex 1 consists of chromobox-domain (CBX) proteins and one member each of the PCGF (Polycomb group ring fingers) family, RING1 family and the HPH family. Polycomb repressive complex 2 contains three core members, namely EZH1 or EZH2 (enhancer of zeste), EED (embryonic ectoderm development) and SUZ12 (suppressor of zeste 12)
81. The SET domain containing methyltransferases, EZH1 and EZH2, are able to catalyze mono-, di- and trimethylation of H3K27, a histone mark associated with transcriptional repression. In turn, H3K27me3 acts as a binding platform for PRC1 that establishes a compact chromatin structure repressing gene transcription
82–84.
The Trithorax group acts like a PcG antagonist by activating gene expression due to different mechanisms. This is carried out by different members of the TrxG proteins: ATP-dependent chromatin remodeling complexes, SET domain containing factors and histone modifying proteins whose interaction is resulting in a more accessible chromatin structure facilitating transcription
85,86.
As mentioned before, histone modifications and DNA methylation are interconnected and one
example for such interplay is the PcG-mediated silencing through DNA methylation. The EZH2 subunit
of PRC2 catalyzes trimethylation of H3K27 functioning as the first layer of repression and due to
interaction of EZH2 with DNA methyltransferases (DNMTs) the second and more stable layer of
repression is set
49,87. This phenomenon is often seen in different cancer types, where PcG targets are
more frequently de novo methylated leading to aberrant DNA methylation patterns
88–90. Moreover, the
aforementioned Methyl-CpG binding proteins (MBPs) participate on the epigenetic crosstalk between
10 DNA methylation and histone modifications. MeCP2 for example interacts with histone deacetylases and the Sin3 corepressor complex via its TR domain leading to transcriptional repression. Another example is MBD1 which may act as a transcriptional repressor by binding to methylated DNA. On the other hand, unmethylated DNA is specifically bound by CXXC finger protein 1 (CFP1), a subunit of the Set1 complex and thus leading to H3K4 trimethylation at bound CpG islands representing a chromatin environment favoring transcription
88,91–93.
Another crosstalk between histone modifications and DNA methylation can be observed between H3K36me3 and DNMT3. Trimethylation of histone H3 at lysine residue 36 is preferentially found in gene bodies of actively transcribed genes and is mediated by the histone methyltransferase SETD2 (SET domain containing 2)
94. This methyltransferase is recruited by RNA polymerase II during transcriptional elongation to maintain a repressive chromatin state preventing spurious transcription of cryptic promoters or transposon remnants
95–97. The repressive histone mark H3K36me3 is then recognized by DNMT3 enzymes and subsequent DNA methylation of gene bodies take place
95,98.
1.2.3 Non-coding RNAs
Besides DNA methylation and histone modifications, non-coding RNAs (ncRNAs) are regulatory elements of chromatin structure and gene expression, thus providing a third epigenetic mechanism
99. In contrast to tRNA (transfer RNA) and rRNA (ribosomal RNA), ncRNAs are only transcribed and not translated into proteins. They can be divided into small (< 200 nt) and long ncRNAs ( > 200 nt), while small ncRNAs include the most prominent ones like microRNA (miRNA), small nucleolar RNA (snoRNA) and PIWI-interacting RNA (piRNA)
99,100. The best studied class of ncRNAs, miRNA, are involved in post-transcriptional gene silencing by the RISC (RNA-induced silencing) complex or complementary interaction with mRNA
101,102. Besides regulation of a variety of biological processes, long non-coding RNAs are also known to function in epigenetic regulation
103. This epigenetic regulation typically results in transcriptional repression with the lncRNA Xist (X-inactivation specific transcripts) as prime example. After transcription from the inactive X chromosome, XIST binds to the Polycomb Repressive Complex 2 and trimethylation of histone H3K27 takes place, overall resulting in inactivation of the marked copy
100,104,105.
Nowadays, light was shed on lncRNAs due to their dysregulated expression and consequential role in cancer development or progression. One example is the lncRNA HOTAIR which normally represses homeobox genes (HOX) by recruitment of PRC2 and LSD1 (Lysine-specific histone demethylase 1).
Overexpression of HOTAIR has been found in breast cancer, hepatocellular carcinoma or colorectal
cancer playing a role in the initiation and progression of these different cancer types
103,104,106,107.
11
1.3 Myelodysplastic syndromes
Myelodysplastic syndromes (MDS) comprise a heterogeneous group of clonal hematopoietic neoplasms characterized by ineffective hematopoiesis resulting in peripheral blood (PB) cytopenias and an increased risk for leukemic evolution
108–110. About 30% of patients are progressing towards acute myeloid leukemia (AML)
111. MDS predominantly occurs in patients older than 65 and shows an incidence in the general population of about 30 – 50 cases per 1.000.000 individuals per year
108,109. In contrast, myelodysplastic syndromes are rather rare in children with an annual incidence of 0.5 – 4 per 1.000.000 individuals
112.
Based on the WHO classification of 2016, MDS can be divided into six different clinical subtypes: MDS
with single lineage dysplasia (MDS-SLD), MDS with multilineage dysplasia (MDS-MLD), MDS with ring
sideroblasts (MDS-RS), MDS with isolated del(5q), MDS with excess blasts (MDS-EB) and MDS,
unclassifiable (MDS-U)
113. Concerning the highly variable prognosis the IPSS-R (International
Prognostic Scoring System-Revised) represents an useful and important system for prognostication of
MDS patients which classifies patients into different groups including very low risk, low risk,
intermediate, high risk and very high risk
108. Regarding the quantitative alterations in these subtypes,
low risk and high risk group patients show a remarkable expansion of hematopoietic stem cells with
the highest expansion rates seen in high risk MDS patients. In addition, low risk MDS subtypes show a
marked increase of common myeloid progenitors (CMPs) and a decrease of megakaryocyte-erythroid
progenitors (MEPs) resulting in cytopenias. High risk MDS is furthermore characterized by MEP
expansion and a higher risk to develop acute myeloid leukemia
114(see Figure 1-8).
12
Figure 1-8 - Alterations in stem and progenitor cells in different MDS risk classesThis simplified model compares differentiation in healthy and low risk / high risk MDS cells. In patients with MDS, genetic and epigenetic alterations in long-term hematopoietic stem cells (LT-HSCs) are observed. Expansion of CMPs (common myeloid progenitor) and decrease of MEPs (megakaryocyte-erythroid progenitor), resulting in cytopenias, are characteristic for low risk MDS patients. High risk MDS is associated with GMP (granulocyte- macrophage progenitor) expansion as well as a greater increase of LT-HSCs and ST-HSCs (short-term HSCs), frequently resulting in acute myeloid leukemia (adopted from Shastri et al.114).
1.3.1 Pathogenesis of MDS
Cytogenetic and molecular genetics are well studied for myelodysplastic syndromes and are important
for progression and prognosis, whereas epigenetic changes are rarely characterized. With the
emergence of cost-effective high-throughput sequencing, mutational profiling improved understanding
of the heterogeneous disease MDS and is incorporated with increasing frequency into clinical routine
investigations
115. With this approach, it was found that over 90% of patients with MDS show genetic
lesions, including mutations, deletions or copy number variations
109,116. Moreover, about 50% of MDS
patients show cytogenetic abnormalities
117. One has to keep in mind that heterogeneity of MDS is not
only induced by genetic aberrations but also by the co-occurrence of cytogenetic and epigenetic
alterations and for that reason following chapters will focus on those three underlying “roots” of MDS.
13
1.3.1.1 Gene mutations
Several studies identified a set of genes frequently mutated in myeloid malignancies that has been further investigated by targeted approaches
116,118,119.
These include genes involved in different cellular processes, like RNA splicing factors, transcription factors, cohesin components, factors important for DNA methylation and histone modification as well as signal transduction molecules
115(see Figure 1-9).
Figure 1-9 – Mutation frequency of genes in myelodysplastic syndromes
Recurrently mutated genes in MDS can be classified into different biological categories with mutations in splicing factors and DNA methylation factors resembling the most common ones with 55% to ~40%, respectively.
Examples for every category are listed on the right side of the bar (adopted from Kennedy et al.115).
1.3.1.1.1 RNA splicing
Mutations affecting the RNA splicing machinery occur in almost 60% of patients with MDS, among SF3B1, SRSF2, U2AF1 and ZRSR2 being the most common ones. SF3B1 (Splicing Factor 3b Subunit 1) shows the highest mutational rate with 28% and is strongly associated with ring sideroblasts and a better overall survival (OS)
108,120–124. In 12 % of patients with MDS mutations in SRSF2 (Serine And Arginine Rich Splicing Factor 2) can be observed, which are often found together with other mutations such as RUNX1, IDH2 and ASXL1 and have a poorer OS
125. Other components of the RNA splicing machinery are mutated at lower frequencies.
In general, mutations in splicing factors were characterized by mutual exclusiveness, that means more
than one mutation is almost not seen in a single neoplasia. Furthermore, mutations tend to appear in
early stages of the disease and have a heterozygous character. Besides the success of understanding
the importance of splicing factor mutations in MDS for pathogenesis and therapy, major questions
about their biological consequences remain
108,126–128.
14
1.3.1.1.2 Epigenetic regulators
Mutations in factors regulating DNA methylation and histone modifications are the second most affected genes in myelodysplastic syndromes. Mutated epigenetic regulators bring along a higher risk for alterations in transcriptional processes that can be retained during cell division and the establishment of a stable MDS clone
125,129. Mutations in genes involved in DNA methylation processes can be observed in DNMT3A and TET2 with a mutational frequency of 2 – 8% and 21 %, respectively.
Mutations in the DNA methyltransferase 3A are known to be loss-of-function, often co-occurring with mutations in SF3B1 and U2AF1 but are not the decisive factor alone for development of MDS. On the other hand, these mutations are associated with a poorer overall survival and a higher risk for leukemia development
108,130,131. TET2 is acting as an opponent of DNMT3A and is the second most mutated gene in patients with MDS
108,132. Several studies showed that impaired function of TET2 increases HSC self-renewal rate and promotes differentiation into myelomonocytic direction.
Furthermore, TET2 mutations are often found in early stages of the disease suggesting to be one possible initiator of MDS
133,134. Mutations in the metabolic enzymes IDH1 and IDH2 are directly influencing TET2 activity by production of 2-hydroxyglutarate, inhibiting the hydroxylation of 5mC.
Moreover IDH1/2 and TET2 mutations are mutually exclusive
115,130,134,135.
The two histone modifying enzymes, ASXL1 and EZH2, are also recurrently mutated in MDS with about 14% and 6%, respectively
108. ASXL1 is involved in histone methylation via interaction with PRC2 components and is associated with a poor overall survival in MDS
136. EZH2 is a component of the PRC2 complex and also a predictor of poor prognosis. In addition to mutations of EZH2, chromosomal aberrations of chromosome 7 or 7q can lead to the deletion of EZH2 (located on 7q36.1) and thereby also play a role in the pathogenesis of MDS
130,136,137.
1.3.1.1.3 Transcription factors
With about 18% of mutation frequency, transcription factors (TFs) are a minor class of genes affected in patients with myelodysplastic syndromes. Mutated transcription factors are important for lineage- specific gene expression and mutations are commonly observed in hematologic malignancies, both myeloid and lymphoid ones
115.
One example is RUNX1, which regulates hematopoiesis and is mutated in about 6% of MDS patients.
Moreover RUNX1 mutations are associated with more advanced diseases, a decreased overall
survival and chromosome 7 abnormalities (-7 / 7q-)
129,138,139. Another component mutated in MDS and
important for hematopoietic development is the zinc finger transcription factor GATA2 which is highly
expressed in hematopoietic stem cells (see Figure 1-10). Important roles are the regulation of HSC
survival and self-renewal and therefore disruption of this balance can contribute to
leukemogenesis
132,140. RUNX1 and GATA2 can be mutated in both ways, somatic or germline,
whereas somatic mutations are only present in 1-2% of MDS patients
116. (Germline) GATA2 mutations
are related with several diseases including familial MDS/AML, MonoMAC syndrome (monocytopenia
and mycobacterial infection), Emberger syndrome, DCML (dendritic cell, monocyte, B and NK
lymphoid deficiency) and pediatric MDS
140,141. In addition to that, familial cases of MDS/AML with
GATA2 mutations show a high incidence of monosomy 7 and trisomy 8
142.
15
Figure 1-10 - Impact of the transcription factor GATA2Involvement of GATA2 is essential during transition from hemogenic endothelium to hematopoietic stem cells (HSCs). Later on, GATA2 is important for HSC proliferation and self-renewal as well as for lineage development (adopted from Wlodarski et al.140).
1.3.1.2 Cytogenetic aberrations
For prognostication of MDS patients, the karyotype plays an important role and is determined in clinical routine. About 50% of patients were found to have cytogenetic aberrations which are known to be of poor prognosis. The most common ones are isolated deletions of 5q and loss of chromosome 7
129,132,143. In 10 - 15% of patients with MDS, partial or complete deletions of the long arm of the chromosome 5 are observed and represent a separate MDS subtype according to the WHO classification. Deletion of 5q leads to haploinsufficiency of CSNK1A1 (casein kinase 1 α 1) and results in upregulation of WNT signaling as well as stem cell expansion
132,144,145. Nevertheless, patients with isolated del(5q) have a good prognosis and can be treated with lenalidomide
129,146.
The underlying mechanism of the immunomodulatory agent lenalidomide includes binding to the CRL4
CRBNE3 ubiquitin ligase, altering its substrate affinity and inducing selective degradation of the CSNK1A1 gene product, CK1α. Loss of CK1α results then in activation of p53-mediated apoptosis
115,132,147,148(see Figure 1-11).
Another frequently observed cytogenetic aberration in MDS is the deletion of 7q and/or monosomy 7
which is associated with poor prognosis. This chromosomal alteration leads to haploinsufficiency of
several genes, like CUX1, EZH2 and MLL3 that may contribute to disease pathogenesis
132,149–152.
16
Figure 1-11 - Mechanism of lenalidomide in MDS patients with del5q(A) CRBN (cereblon), the substrate adaptor of the E3 ubiquitin ligase, shows low affinity for CK1α, whereas presence of lenalidomide increases affinity and therefore catalyzes ubiquitination and degradation of CK1α.
(B) Due to the lack of one copy of CSNK1A1 and a resulting lower CK1α level, HSCs have a clonal advantage over wildtype cells at baseline. Lenalidomide treatment selectively depletes CK1α in all HSCs, whereas in 5q- cells levels drop under baseline resulting in apoptosis. On the other side, wildtype cells retain enough CK1α for survival (adopted from Sperling et al.132).
1.3.1.3 Role of DNA methylation in MDS
Specific DNA methylation patterns are responsible for sustaining genomic stability and normal gene expression. Several studies showed that MDS and AML are associated with altered DNA methylation pattern suggesting an important role for this epigenetic modification in pathogenesis of MDS
153–157. Changes in DNA methylation comprise global hypomethylation as well as hypermethylation of CpG islands in promoter regions, such as those of tumor suppressor genes
158.
Application of hypomethylating agents (HMAs), like the nucleoside analogs 5-azacitidine (Vidaza®)
and 5-aza-2’-deoxycytidine (Decitabine, Dacogen®), induce clinic response in a distinct subset of
MDS patients and delays progression to AML
159,160. These two azanucleosides show either cytotoxicity
due to incorporation into DNA or RNA or hypomethylation of DNA through inhibition of DNA
methyltransferases resulting overall in antitumoral effects
161. Recently published work also suggests
immunomodulatory effects of 5-azacitidine
162,163. In summary, DNA methylation changes somehow
play a role in myelodysplastic syndromes, but how this epigenetic mechanism is exactly involved in
disease pathogenesis and progression is still unclear.
17
1.3.1.4 Differences between adult and pediatric MDS
The very heterogeneous group of clonal hematopoietic disorders is observed in adults as well as in children, but several morphological, clinical and cytogenetic differences exist.
First, the clinical incidence in older adults is much higher with 30 – 50 / 10
6per year than in children with 0.5 – 4 / 10
6 108,112. Clinical characteristics in adult MDS patients are isolated anemia and mostly hypercellular bone marrow (BM) compared to bilineage cytopenia and hypocellularity of BM in pediatric MDS. Regarding cytogenetics, MDS with del(5q) are much more frequently found in adults compared to children. Here deletions of chromosome 7 or 7q are the most frequent cytogenetic aberrations
112,164. On genetic level, mutations in adult MDS patients are mainly observed in DNMT3A, ASXL1, TET2 and SF3B1, while children often exhibit mutations in the GATA2, SAMD9
165or FANC (Fanconi anemia) members
166. Differences between MDS in adults and children are also made in clinical treatment options. In pediatric MDS the treatment of choice represents hematopoietic stem cell transplantation (HSCT), the only curative therapy. Contrary, adult MDS patients are treated due to the severity, low / intermediate risk or high risk, either supportive, immunomodulatory with lenalidomide or with hypomethylating agents, intensive chemotherapy and HSCT
112,164.
1.3.2 Clonal evolution during disease progression
The emergence of next-generation sequencing greatly expanded our knowledge about the pathogenesis of myelodysplastic syndromes and other malignant disorders, whereas mechanisms during disease progression are not well studied at all.
MDS progression is a dynamic event characterized by increasing malignant potential and clonal evolution, whereas the origin of this disease lies within acquired mutations in hematopoietic stem cells (HSCs)
167. Here one has to differentiate between MDS and clonal hematopoiesis with indeterminate potential (CHIP) which can be distinguished due to the presence or absence of hematopoietic dysplasia in bone marrow, respectively
168,169.
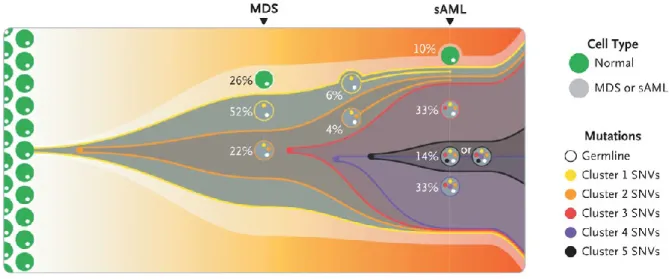
The progression from MDS to secondary AML (sAML) was shown to be associated with the presence of mutations as well as the clonal architecture of these mutations. Founding clones are predominantly associated with mutations of epigenetic modifiers (e.g. ASXL1, TET2) and RNA splicing factors (e.g.
SF3B1, SRSF2). Daughter clones tend to acquire mutations in signaling cascade factors, transcription factors or show cytogenetic lesions
170. In general, it could be shown that sAML clones derive from a MDS founding clone and both entities show the same clonality despite different bone marrow blast counts (Figure 1-12). Each new clone during tumor progression carries all preexisting pathogenic and nonpathogenic mutations
171. Furthermore, disease progression and thus complex clonal architecture was correlated with phenotype progression into worse WHO categories
170.
Epigenetic changes during disease progression of myelodysplastic syndromes have been scarcely
explored so far. One study examined the epigenetic heterogeneity of 138 AML patients in comparison
to their genetic landscape during disease progression. They showed that genetic and epigenetic
18 patterns arise independent during leukemic progression, but both of them playing a unique significant function
172.
In summary, the sequential acquisition of mutations and cytogenetic aberrations result in clonal evolution of MDS and is probably not associated with underlying epigenetic patterns.
Figure 1-12 - Clonal evolution from MDS to sAML
A model of the clonal evolution from myelodysplastic syndromes (MDS) to secondary acute myeloid leukemia (sAML) is represented by this fish plot. The first clone exhibiting mutations is indicated with yellow and is present in 52 % of the bone marrow cells. This clone is characterized by Cluster 1 somatic single-nucleotide variants (SNVs). Cells indicated in orange originated from clone 1 and are labeled as clone 2 with specific Cluster 2 SNVs.
Clone 2 evolved three subsequent subclones (red, purple and black) through serial acquisition of SNVs and is the dominant clone in the sAML sample (adopted from Walter et al.171).