Hydrogels in charged solvents
Peter Koˇsovan, Christian Holm, Tobias Richter
Institute for Computational Physics
Pfaffenwaldring 27 D-70569 Stuttgart Germany
27. May 2013
Tobias Richter (ICP, Stuttgart) Hydrogels 27. May 2013 1 / 21
Outline
Outline
1 Introduction
2 Motivation
3 Simulation Setup
4 Results
5 Conclusions
6 References
Introduction
Hydrogels are charged polymer-networks
Hydrogels can swell tremendously in aqueous solutions Swelling behavior can be influenced by external parameters
Pressure pH
Concentration of electrolytes
Tobias Richter (ICP, Stuttgart) Hydrogels 27. May 2013 3 / 21
Motivation
Experiment [1]
Johannes H¨ opfner at KIT was
investigating the desalination capacity of Hydrogels
Poly-acrylic-acid Idea:
Swelling Hydrogel in salty water solution
extract Hydrogel from salt solution Deswell/Compress Hydrogel and squeeze out the incorporated water
Figure 1: Experimental setup,
taken from [1]
Motivation
Experimental Results The process is reversible Desalination capacity per cycle is up to 35% [1]
Open Questions
How does the desalination work on the microscopic level
What influences the desalination capacity
Crosslinking density Charge density
Figure 2: Salt concentration of the extracted water, taken from [1].
Tobias Richter (ICP, Stuttgart) Hydrogels 27. May 2013 5 / 21
Motivation
Experimental Results The process is reversible Desalination capacity per cycle is up to 35% [1]
Open Questions
How does the desalination work on the microscopic level
What influences the desalination capacity
Crosslinking density Charge density
Figure 2: Salt concentration of the
extracted water, taken from [1].
Motivation
Experimental Results The process is reversible Desalination capacity per cycle is up to 35% [1]
Open Questions
How does the desalination work on the microscopic level
What influences the desalination capacity
Crosslinking density Charge density
Figure 2: Salt concentration of the extracted water, taken from [1].
Tobias Richter (ICP, Stuttgart) Hydrogels 27. May 2013 5 / 21
Simulation Setup
Simulation setup
Tetrafunctional polymer-network with 16 chains and 8 nodes and equally spaced charged on the chains
Periodic boundary conditions Explicit counterions
Langevin thermostat → Brownian dynamics
Simulation in (NVT) and (µVT) ensemble as well as testing those together with the “npt-isotropic” barostat in ESPResSo
Translation of experiment to computer simulation
1 Determine chemical potential and pressure in salt solution
2 Determine equilibrium swelling and internal salt concentration at a certain external salt concentration c s → fixed external chemical potential
equilibrium conditions p = p
salt(c
s) and
µ
i= µ
?iSimulation Setup
Simulation setup
Tetrafunctional polymer-network with 16 chains and 8 nodes and equally spaced charged on the chains
Periodic boundary conditions Explicit counterions
Langevin thermostat → Brownian dynamics
Simulation in (NVT) and (µVT) ensemble as well as testing those together with the “npt-isotropic” barostat in ESPResSo
Translation of experiment to computer simulation
1 Determine chemical potential and pressure in salt solution
2 Determine equilibrium swelling and internal salt concentration at a certain external salt concentration c s → fixed external chemical potential
equilibrium conditions p = p
salt(c
s) and µ
i= µ
?iTobias Richter (ICP, Stuttgart) Hydrogels 27. May 2013 6 / 21
Simulation Setup
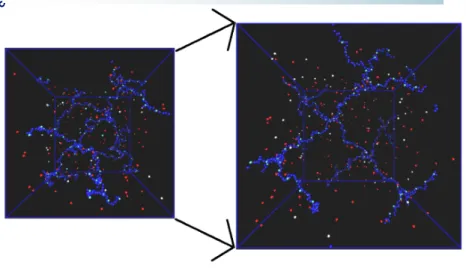
Figure 3: Snapshot of the simulated system
Simulation Setup
Simulation in the grand canonical ensemble Using the (NVT) ensemble simulation ESPResSo already provides Adding particle exchange with external reservoir → Monte Carlo steps Acceptance probability according to [2]
acc(N → N + 1) = min
1, V
Λ 3 (N + 1) exp (−β (−µ out + ∆U ))
(1)
acc(N → N − 1) = min
1, Λ 3 N
V exp (−β (µ out + ∆U ))
(2)
Rewritten acceptance rates
acc(N → N + 1) = min
1, 1
% in exp (−β (−µ ex out − 1/β ln % out + ∆U ))
(3) acc(N → N − 1) = min (1, % in exp (−β (µ ex out + 1/β ln % out + ∆U ))) (4)
Tobias Richter (ICP, Stuttgart) Hydrogels 27. May 2013 8 / 21
Simulation Setup
Simulation in the grand canonical ensemble
acc(N → N + 1) = min
1, V
Λ 3 (N + 1) exp (−β (−µ out + ∆U ))
(1)
acc(N → N − 1) = min
1, Λ 3 N
V exp (−β (µ out + ∆U ))
(2)
Elimination of Λ
with µ out = µ ex out + k B T ln(% out Λ 3 )
Rewritten acceptance rates
acc(N → N + 1) = min
1, 1
% in
exp (−β (−µ ex out − 1/β ln % out + ∆U ))
(3)
acc(N → N − 1) = min (1, % in exp (−β (µ ex out + 1/β ln % out + ∆U ))) (4)
Simulation Setup
Simulation in the grand canonical ensemble
acc(N → N + 1) = min
1, V
Λ 3 (N + 1) exp (−β (−µ out + ∆U ))
(1)
acc(N → N − 1) = min
1, Λ 3 N
V exp (−β (µ out + ∆U ))
(2)
Rewritten acceptance rates
acc(N → N + 1) = min
1, 1
% in
exp (−β (−µ ex out − 1/β ln % out + ∆U ))
(3) acc(N → N − 1) = min (1, % in exp (−β (µ ex out + 1/β ln % out + ∆U ))) (4)
Tobias Richter (ICP, Stuttgart) Hydrogels 27. May 2013 8 / 21
Simulation Setup
−2
−1.5
−1
−0.5 0 0.5 1
10 −4 10 −3 10 −2 10 −1 10 0 10 1 µ ex [k B T]
c s [mol/L]
Widom method extended Debye Hückel Experiment
Figure 4: Chemical potential obtained with for Bjerrum-length equal 2 together with a
fit of the extended Debye-H¨ uckel model and experimental activity coefficients
measurements done by Truesdell [3].
Simulation Setup
−2
−1.5
−1
−0.5 0 0.5 1
10 −4 10 −3 10 −2 10 −1 10 0 10 1 µ ex [k B T]
c s [mol/L]
Widom method extended Debye Hückel Experiment
Figure 4: Chemical potential obtained with for Bjerrum-length equal 2 together with a fit of the extended Debye-H¨ uckel model and experimental activity coefficients measurements done by Truesdell [3].
µ DB = −
√ 2πλ
3 2
b
√ % 1 + 8πa ? √
% (5)
Tobias Richter (ICP, Stuttgart) Hydrogels 27. May 2013 9 / 21
Simulation Setup
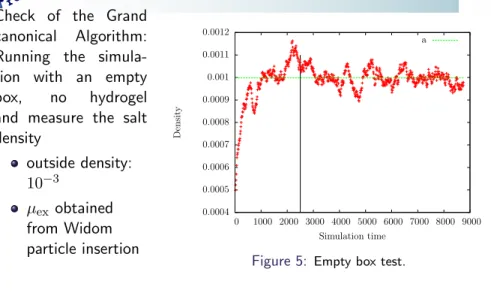
Check of the Grand canonical Algorithm:
Running the simula- tion with an empty box, no hydrogel and measure the salt density
outside density:
10 −3
µ ex obtained from Widom particle insertion
0.0004 0.0005 0.0006 0.0007 0.0008 0.0009 0.001 0.0011 0.0012
0 1000 2000 3000 4000 5000 6000 7000 8000 9000
Density
Simulation time a
Figure 5: Empty box test.
Simulation Setup
Check of the Grand canonical Algorithm:
Running the simula- tion with an empty box, no hydrogel and measure the salt density
outside density:
2.7e − 3 µ ex obtained from Widom particle insertion
1.4e-03 1.6e-03 1.8e-03 2.0e-03 2.2e-03 2.4e-03 2.6e-03 2.8e-03 3.0e-03 3.2e-03
0 5000 10000 15000 20000
cin
t
79 1/4
1.5e-03 2.0e-03 2.5e-03
0 500 1000 1500
Figure 5: Development of the salt concentration inside a hydrogel (N=79 f=1/4 c
s= 0.1mol/L ˆ =2.7e − 3)
Tobias Richter (ICP, Stuttgart) Hydrogels 27. May 2013 10 / 21
Simulation Setup
Determining the pressure dependence on Volume for a given external salt solution
0.009 0.0095 0.01 0.0105 0.011 0.0115 0.012
30 32 34 36 38 40 42 44
Internal pressure
Box length [ σ ] N=59 f=1/4 external pressure Fit
Figure 6: Total pressure dependence on volume for a salt solution with concentration
Simulation Setup
Donnan Theory
Philipse et. al derived an equation for colloid system in contact with an infinite reservoir of salt [4].
% −
% ext
= − % c
2% ext
+ s
1 + % c
2% ext
2
, (6)
% − is the salt concentration in the hydrogel
% c = mN f V
hg
, m is the number of polymer chains and N the number of monomers per chain, f is the charge fraction of the hydrogel
Tobias Richter (ICP, Stuttgart) Hydrogels 27. May 2013 12 / 21
Simulation Setup
Osmotic Donnan Model
Combining Donnan theory for the salt partitioning with an equation for the pressure balance
Equation of state
Minimal model: the chains in the hydrogel behave as ideal gaussian chains
(i) : mN f
V hg + % − = % + (7)
(ii) : % 2 ext = % − % + (8)
(iii) :
% + + % − − 1 N b 2 R e
k B T + p ext = 2% ext k B T (9)
Simulation Setup
Osmotic Donnan Model
Combining Donnan theory for the salt partitioning with an equation for the pressure balance
Equation of state
Minimal model: the chains in the hydrogel behave as ideal gaussian chains
p in = p out p osm in + p elastic + p extern = p osm salt
(i) : mN f
V hg
+ % − = % + (7)
(ii) : % 2 ext = % − % + (8)
(iii) :
% + + % − − 1 N b 2 R e
k B T + p ext = 2% ext k B T (9)
Tobias Richter (ICP, Stuttgart) Hydrogels 27. May 2013 13 / 21
Simulation Setup
Osmotic Donnan Model
Combining Donnan theory for the salt partitioning with an equation for the pressure balance
Equation of state
Minimal model: the chains in the hydrogel behave as ideal gaussian chains
(i) : mN f
V hg + % − = % + (7)
(ii) : % 2 ext = % − % + (8)
(iii) :
% + + % − − 1 N b 2 R e
k B T + p ext = 2% ext k B T (9)
Results
Equilibrium swelling
0 50 100 150 200 250 300 350 400 450
0.05 0.1 0.15 0.2 0.25 0.3
Swelling degree
cs [mol/L]
N=39 f=1/8 theory N=39 f=1/8 N=39 f=1/4 theory N=39 f=1/4 N=39 f=1/2 theory N=39 f=1/2
0 100 200 300 400 500 600 700 800
0.05 0.1 0.15 0.2 0.25 0.3
Swelling degree
cs [mol/L]
N=59 f=1/4 theory N=59 f=1/4 N=59 f=1/2 theory N=59 f=1/2
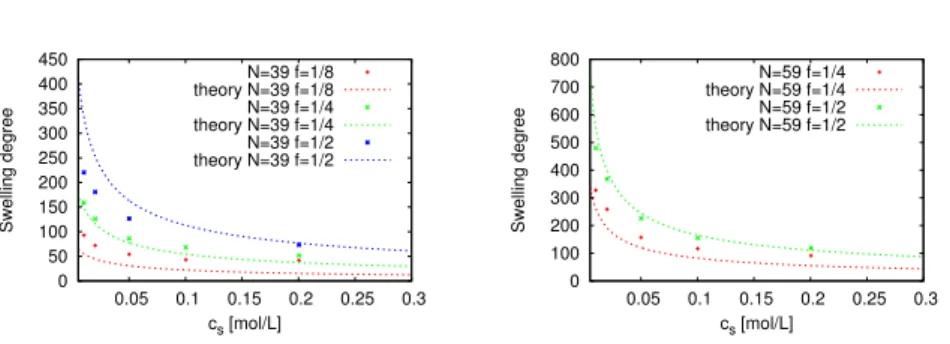
Figure 7: Dependence of the equilibrium swelling degree on the salt concentration of the external reservoir. The dashed lines are the predictions of the osmotic Donnan model.
Tobias Richter (ICP, Stuttgart) Hydrogels 27. May 2013 14 / 21
Results
Donnan theory
0 0.001 0.002 0.003 0.004 0.005 0.006 0.007 0.008 0.009 0.01
0 0.02 0.04 0.06 0.08 0.1 0.12 0.14 cint [mol/L]
f cp [mol/L]
Donnan 0.01 mol/L N=39 N=59 N=79 f=1/8 f=1/4 f=1/2
0.035 0.04 0.045 0.05 0.055 0.06 0.065 0.07 0.075 0.08 0.085 0.09
0.02 0.04 0.06 0.08 0.1 0.12 0.14 0.16 0.18 0.2 0.22 0.24 cint [mol/L]
f cp [mol/L]
Donnan 0.1 mol/L N=39 N=59 N=79 f=1/8 f=1/4 f=1/2
Figure 8: Testing the Donnan prediction for the salt partitioning against the simulation for two intermediately high salt concentrations: left: 0.01 mol/L, right: 0.1 mol/L.
% −
= − % c +
s 1 +
% c 2
, (10)
Results
0.29 0.295 0.3 0.305 0.31 0.315 0.32 0.325
0.11 0.12 0.13 0.14 0.15 0.16 0.17 0.18 0.19 cint [mol/L]
f cp [mol/L]
Donnan 0.37 mol/L N=59 f=1/4
0.13 0.135 0.14 0.145 0.15 0.155 0.16 0.165 0.17
0.1 0.11 0.12 0.13 0.14 0.15 0.16 0.17 0.18 cint [mol/L]
f cp [mol/L]
Donnan 0.1 mol/L N=59 f=1/4
Figure 9: Testing the Donnan prediction for salt partitioning for c
s= 0.37mol/L (left) and 0.2 mol/L with randomly placed charges on the hydrogel with N=59 f=1/4.
Tobias Richter (ICP, Stuttgart) Hydrogels 27. May 2013 16 / 21
Results
Donnan theory in the limit of no electrostatics (λ
B= 0)
0.1 0.11 0.12 0.13 0.14 0.15 0.16 0.17
0.05 0.1 0.15 0.2 0.25 0.3
cint [mol/L]
f cp [mol/L]
Donnan 0.2 mol/L N=39 N=59 N=79 f=1/8 f=1/4 f=1/2
Results
Simulation in µpT
Figure 11: Pressure versus volume for the N=59 f=1/4 hydrogel. The circles indicate the start configurations for testing simulations in (µpT ).
0.0094 0.0095 0.0096 0.0097 0.0098 0.0099 0.01 0.0101 0.0102 0.0103
28 30 32 34 36 38 40 42 44
pressure
Box length [σ] external pressure
0.0015 0.002 0.0025 0.003 0.0035 0.004 0.0045 0.005 0.0055
0 5000 10000 15000 20000 25000 30000 cin
t
Above Below
Figure 12: Left: The final volumes that were obtained using the (µpT ) ensemble simulation for the two different start configurations. Right: The salt density inside the hydrogels for the simulations in (µpT ).
Tobias Richter (ICP, Stuttgart) Hydrogels 27. May 2013 18 / 21
Results
Simulation in µpT
0.0094 0.0095 0.0096 0.0097 0.0098 0.0099 0.01 0.0101 0.0102 0.0103
28 30 32 34 36 38 40 42 44
pressure
Box length [σ] external pressure
0.0015 0.002 0.0025 0.003 0.0035 0.004 0.0045 0.005 0.0055
0 5000 10000 15000 20000 25000 30000 cin
t
Above Below
Figure 11: Left: The final volumes that were obtained using the (µpT ) ensemble
simulation for the two different start configurations. Right: The salt density inside
the hydrogels for the simulations in (µpT ).
Conclusions
Conclusions
The equilibrium swelling for hydrogels in various external salt concentrations could be determined
The Osmotic Donnan model and the simulations qualitatively agree The Donnan theory for the salt partitioning show increasing
deviations for increasing charge fractions of the hydrogel
The linear charge density on the hydrogel chains breaks the assumption of homogeneity
This seems to remain true even for very high salt concentrations (strong screening of the electrostatics) and randomly placed charges on the hydrogel backbone
In the case of no electrostatics (the salt behaves almost as ideal gas) the donnan theory and the simulations fully agree
The barostat in combination with the grand canonical ensemble does not work to predict the equilibrium swelling volume
Tobias Richter (ICP, Stuttgart) Hydrogels 27. May 2013 19 / 21
Conclusions
Outlook
Improvement of the “Donnan”–model
Poisson-Boltzmann Cell model to treat the elastic properties in an electrolyte solution
Track down the origin of the deviations
Having a closer look at the distribution of ions around the chains in
the hydrogel
References
[1] Johannes H¨ opfner, Christopher Klein, and Manfred Wilhelm.
A novel approach for the desalination of seawater by means of reusable poly(acrylic acid) hydrogels and mechanical force.
Macromol. Rapid Commun., 31:1337, 2010.
[2] Daan Frenkel and Berend Smit.
Understanding Molecular Simulation.
Academic Press, San Diego, second edition, 2002.
[3] Alfred H. Truesdell.
Activity coefficients of aqueous sodium chloride from 15
◦to 50
◦c measured with a glass electrode.
Science, 161(3844):884–886, 1968.
[4] A Philipse and A Vrij.
The donnan equilibrium: I. on the thermodynamic foundation of the donnan equation of state.
Journal of Physics: Condensed Matter, 23(19):194106, 2011.
Tobias Richter (ICP, Stuttgart) Hydrogels 27. May 2013 21 / 21
![Figure 1: Experimental setup, taken from [1]](https://thumb-eu.123doks.com/thumbv2/1library_info/3996777.1540195/4.544.3.523.59.325/figure-experimental-setup-taken-from.webp)
![Figure 2: Salt concentration of the extracted water, taken from [1].](https://thumb-eu.123doks.com/thumbv2/1library_info/3996777.1540195/6.544.303.500.83.239/figure-salt-concentration-extracted-water-taken.webp)
![Figure 2: Salt concentration of the extracted water, taken from [1].](https://thumb-eu.123doks.com/thumbv2/1library_info/3996777.1540195/7.544.19.503.32.325/figure-salt-concentration-extracted-water-taken.webp)

![Figure 4: Chemical potential obtained with for Bjerrum-length equal 2 together with a fit of the extended Debye-H¨ uckel model and experimental activity coefficients measurements done by Truesdell [3].](https://thumb-eu.123doks.com/thumbv2/1library_info/3996777.1540195/14.544.95.485.45.280/chemical-potential-obtained-bjerrum-experimental-coefficients-measurements-truesdell.webp)
![Figure 4: Chemical potential obtained with for Bjerrum-length equal 2 together with a fit of the extended Debye-H¨ uckel model and experimental activity coefficients measurements done by Truesdell [3].](https://thumb-eu.123doks.com/thumbv2/1library_info/3996777.1540195/15.544.87.489.33.264/chemical-potential-obtained-bjerrum-experimental-coefficients-measurements-truesdell.webp)


