Received date 23 May 2016 Accepted date 14 June 2016 Published date 29 June 2016 http://www.aimspress.com/
Research article
Submarine Salt Karst Terrains
Christopher Talbot 1,* and Nico Augustin 2
1 Hans Ramberg Tectonic Laboratory, Uppsala University, 752 36, Uppsala, Sweden Present address: 14 Dinglederry, Olney, MK46 5ES, UK
2 GEOMAR Helmholtz Centre for Ocean Research Kiel, Kiel, Germany
* Correspondence: Email: christopher.talbot@geo.uu.se; Tel: +1234 714 140
Abstract: Karst terrains that develop in bodies of rock salt (taken as mainly of halite, NaCl) are special not only for developing in one of the most soluble of all rocks, but also for developing in one of the weakest rocks. Salt is so weak that many surface-piercing salt diapirs extrude slow fountains of salt that that gravity spread downslope over deserts on land and over sea floors. Salt fountains in the deserts of Iran are usually so dry that they flow at only a few cm/yr but the few rain storms a decade so soak and weaken them that they surge at dm/day for a few days. We illustrate the only case where the rates at which different parts of one of the many tens of subaerial salt karst terrains in Iran flows downslope constrains the rates at which its subaerial salt karst terrains form. Normal seawater is only 10% saturated in NaCl. It should therefore be sufficiently aggressive to erode karst terrains into exposures of salt on the thousands of known submarine salt extrusions that have flowed or are still flowing over the floors of hundreds of submarine basins worldwide. However, we know of no attempt to constrain the processes that form submarine salt karst terrains on any of these of submarine salt extrusions. As on land, many potential submarine karst terrains are cloaked by clastic and pelagic sediments that are often hundreds of m thick. Nevertheless, detailed geophysical and bathymetric surveys have already mapped likely submarine salt karst terrains in at least the Gulf of Mexico, and the Red Sea. New images of these two areas are offered as clear evidence of submarine salt dissolution due to sinking or rising aggressive fluids. We suggest that repeated 3D surveys of distinctive features (± fixed seismic reflectors) of such terrains could measure any downslope salt flow and thus offer an exceptional opportunity to constrain the rates at which submarine salt karst
terrains develop. Such rates are of interest to all salt tectonicians and the many earth scientists seeking hydrocarbons associated with salt bodies.
Keywords: salt; karst terrains; submarine; Gulf of Mexico; Red Sea
1. Introduction
Thousands of salt diapirs surface on sea floors and extrude submarine sheets of salts of various ages that have gravity spread downslope in hundreds of basins worldwide in the past or are still doing so at present [1]. Although thick piles of sediments bury many of these submarine salt extrusions, slumping or submarine currents likely expose the salt on parts of many others. As normal seawater is only 10% saturated in NaCl [2] it is sufficiently aggressive to dissolve at least local salt karst terrains in many of these submarine salt extrusions. In addition to submarine salt karst terrains dissolved from above, we include as a special category: submarine salt karst terrains dissolved by fluids rising through salt bodies that erode chimneys in the overlying sediments beneath pockmarks on the sea floor [3].
The rates that potential submarine salt karst terrains develop could be constrained by long-term high-resolution submarine geodetic surveys. Assuming a lack of permanent moorings in the area, each of these could consist of a wave glider on the surface communicating to an array of 35 seafloor transponders or beacons. Wave gliders hold their precisely known positions and measure the position of the seafloor transponders with sufficient precision to register relative lateral and vertical displacements of the seafloor beacons of 1.5 cm/year.
This work opens by outlining an analysis of a subaerial karts terrain on a salt extrusion in Iran to illustrate its potential for constraining rates of salt flow and dissolution. It goes on to review some of the evidence for submarines salt karst terrains flowing downslope in two representative basins: the well known Gulf of Mexico and the less well known Red Sea. It presents new images as evidence for submarine slat dissolution and discusses the likely differences between subaerial and submarines salt karst terrains. It ends by advocating constraining the rates at which submarine salt extrusions flow and dissolve from above or below. Such rates should be of interest to all salt tectonicians and geologists seeking hydrocarbons offshore.
2. A subaerial salt karst terrain
Zarei et al [4] analysed the simple hydrology of one of the 180 or so extrusions of Hormoz salt in the Zagros Mountains of Iran. The Konarsiah salt extrusion at 28° 45’ N, 52° 25’ E is covered by residual soils of the insoluble components that remain in place as the extruding Hormoz salt is dissolved by the rain and snow melt. Solution pits in the surface of these soils enlarge as the soils
thicken in a topographic relief that grows as the dissolving salt flows downslope through surficial salt at an average rate of a few cm/y (Figure 1). The calculated age of the thickest, most distal soil constrained the average rate at which the underlying extruded salt flows downslope in two directions.
The average velocities constrained for salt flow are consistent with the rates of displacement of markers near the summit of Konarsiah measured at irregular intervals over five years [4].
Figure 1. Conceptual cartoon of how the global cycles of H2O and NaCl interact at Konarsiah (from Figure 9 in ref [4]).
Figure 1 summarizes our current understanding of how the global H2O and NaCl cycles interact to generate the karst topography on the active dynamic salt fountain of Konarsiah. As in all the ≈ 30 subaerial salt extrusions examined in Iran [5], the ductile confined diapiric salt with its uniform grain size of cm has risen from several km of confining pressure and dilates (“blows up”) as it de-stresses to a much weaker unconfined brittle solid as it approaches exposure near the crest of the fountain.
The many micro-fractures and several suites of macroscopic joints in this carapace of dilated elastic salt enable it to act as a permeable aquifer that is a few meters thick on the crest of this fountain and thickens downslope in various directions to ~30–32 meters at different termini.
About 70% of the long-term annual precipitation of 400 mm on Konarsiah probably evaporates and transpires and only about 20% runs off the surface [4]. About 10% of the precipitation percolates downslope through the surficial carapace of permeable de-stressed salt. This draining precipitation rapidly becomes brine that dissolve the underlying impermeable confined and flowing salt. The top of the salt dissolves at a rate near 5.4 mm/y, and its ~5 vol% of insoluble impurities accumulate vertically in place as a residual soil at 0.27 mm/y [4]. To reach different termini with thicknesses of 30–32 m requires the dissolution of salt thicknesses between 600 and 640 m in times between
~110,000 and 120,000 years. To reach the terminus 3,500 m from the crest to the WSW and 3,960 m to the SSW requires the salt to flow at average horizontal rates of between 29.5 and 35.6 mm/y[4].
This in turn requires the salt to rise out of the two subsurface vents at an average rate estimated to be near 72 mm/y. These order of magnitude calculations of rates of salt dissolution and downslope flow are acceptable in view of independent field measurements in the relatively humid NW Zagros Mountains [4]. All subaerially extruded salt has a distinctive bimodal grain size that renders it
weaker than diapiric salt with its uniform grain size; wet extruded salt also flows faster than dry salt [6]. When it is dry, the salt carapace is elastic and expands and contracts noisily about a dm/day in rapid response to weather induced temperature changes. Damp salt exposures become slippery within minutes of a light rainfall and flow quietly as a ductile fluid [7].
Figure 2. True scale profiles of Konarsiah and its four zones. (a) Dogleg ~N-S profile; (b) Qualitative graph of horizontal velocity of salt flow from the S, summit to SSW; (c) Cartoon profiles of karst features in soils (grey) and salt (white) in zones 1–4 (from Figure 4 in ref [4]).
Figure 3. An aerial photo laydown of Konarsiah showing the outlines of salt extruding over the surface (white lines) from the two vents (closed white lines) along a major strike slip fault in its country rocks (from Figure 6 in ref [4]).
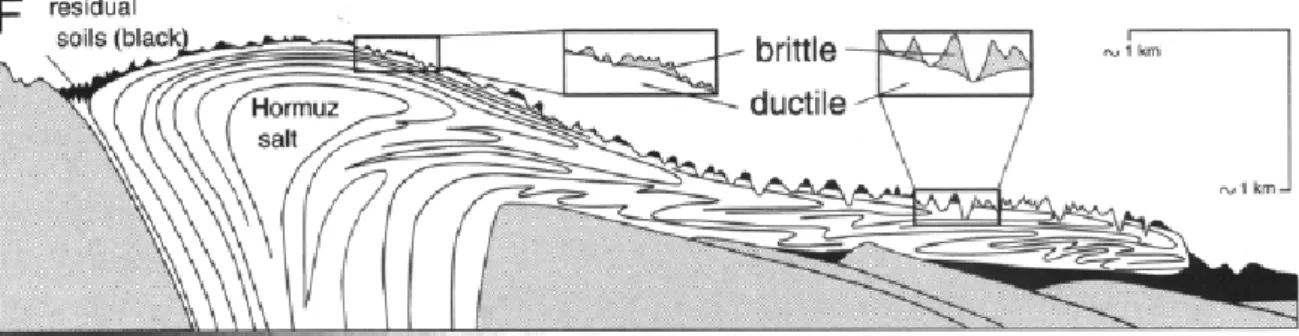
Figure 4. Cartoon indicating that the thicknesses of both the surficial de-stressed carapace and the topographic relief increase downslope as the surficial salt has been on the surface for longer the further it is carried downslope (from figure 7F in ref [5]).
Figure 4 illustrates that the relief of interfluves can be taken as a first order approximation of the thickness of the brittle dilated salt because the seasonal rivers erode down to impermeable confined flowing salt.
Talbot and Rogers [7] reported a particular straight line painted on one namakier (or subaerial salt glacier) as having moved half a meter downstream in a day. It has since become obvious that they were very lucky with their timing. This is because that same line moved only 2.5 m downstream at an average rate near 4 cm/y in the next twenty years. That 2.5 m advance included a few days when the salt surged downslope about 0.5 m/d, after being thoroughly wet by a few other storms and then shrank back upslope as it dried. Note that the wetting was far more important than the > 10°C temperature drop when the salt flowed.
Figure 5. Working model for slow normal flow and short rapid surges in namakierssupplied from a country-rock vent at an essentially steady rate (from Figure13 from ref [8]).
Figure 5 indicates how strong subaerial diapiric salt extrudes at a nearly constant rate high into a typical salt fountain where it is girdled by a thick and strong carapace of brittle salt (orange) when it is dry (most of the time). The next big storm (once in about 3–5 years) weakens the girdle so much (blue) that all the salt stored at high levels flows rapidly downslope in a salt surge that confuses interpretations of InSAR time series.
Talbot and Aftabi [9] used laboratory experiments to argue that the major recumbent folds in the top limb of the fundamental tank-track fold inside subaerial salt extrusions record changes in the ratios at which the diapiric salt extrudes and gravity spreads downslope. As rainfall is likely to change faster than the gravity and tectonic forces that drive subaerial salt extrusions, such budget- induced dynamic flow folds within subaerial salt extrusions offer a potential record of climate change over tens of millennia.
The lower slopes of diapirs of Hormoz salt close to the shoreline of the Gulf and forming salt islands offshore are capped by a few metres of what Bruthans et al [10] describe as submarine residua of unsorted, angular, matrix-supported clasts from the Hormoz Complex. These compacted deposits were deposited during a Gulf highstand from 9 to 6 kyr BP when seawater abraded but apparently did not dissolve the salt [10].
3. Submarine salt karst terrains
Normal seawater is only 10% saturated in NaCl [2]. This implies that normal seawater should be sufficiently aggressive to erode karst terrains into exposures of salt on the many submarine salt extrusions. The next twp sections describe two such potential terrains.
3.1. The Orca basin in the NE Gulf of Mexico
Tompkins and Shepherd [11] described an extraordinary submarine lake of hypersaline brines in the depths of the Orca basin, one of over 70 bowl-shaped intra-slope mini-basins in the huge allochthonous salt canopy in the northeast Gulf of Mexico. They focused on the remobilization of slope sediments from the flanks into the basin.
Pilcher and Blumstein [12] added details to this picture when they used wonderful modern 3D seismic images of the Orca basin (Figures 6–8). They confirmed that clay rich slope sediments in the NE flank slumped to “expose” Louann salt to dissolution. In fact the < 6 m resolution of a 25 km2 area of rugose salt upslope of the brine lake was not quite sufficient to be sure of salt exposure.
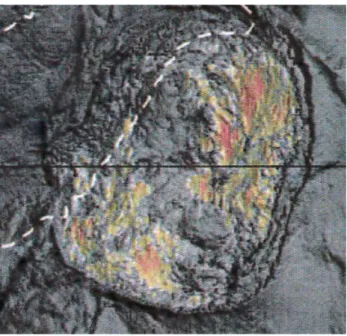
Figure 6. Seabed structural map of the Orca Basin with the brine lake inside the dashed line The area marked K may be a submarine salt karst as seen in Figure 8 (from figure 3 in [12]).
Figure 7. W-E profile across the Orca basin with 5 times vertical exaggeration along black line in Figure 6 (from figure 4 in [12]).
Figure 8. Blow up of the potential a submarine salt karst (the area marked K in Figure 6) on a seabed maximum amplitude map for the area of salt exposed (?) (in yellow and red) on SE flank overlooking the brine lake to NW of dashed white line (from figure 5 in [12]). Areas of slumping, and faulting are also visible. Black WE line locates part of profile shown in Figure 7.
Nevertheless, their assumption that dense anoxic brines dissolved mainly from the area shown in Figure 8 flow downslope to pond in the depth of the basin as a 123 square km lake of hypersaline brine up to 220 m deep, seems very credible (Figure 6). The time averaged addition of salt to the brine lake is near 0.5 million t/yr. The 13.3 cubic km volume of the lake represents the dissolution of 3.62 billion tons of Louann salt, enough to flood Manhattan to depth of 155 m [12].
3.2. Rate of salt dissolution
The deepest black muds recording anoxia in the Orca brine lake are 7900 ± 170 years old so the average dissolution rate of ~458,000 t/yr with a background sedimentation rate is about 1 m/1000 yr [12].
The dissolution of ~1.65 billion tons from the 25 km2 of salt exposed by slumping of Jurassic Louann salt exposed after ~160 Ma in the subsurface implies an average thickness of 66 m of salt has been removed (Figure 8). The average rate of salt dissolution is estimated at 10 m/1000y. This is at the faster end of published dissolution rates for salt and faster than the likely upwelling rate of the salt [12]. These authors argued that salt dissolution in temporarily exposures of the salt canopy in the Gulf of Mexico must have been significant since the mini-basins began to subside in the Paleogene. Pilcher and Blumstein [12] also considered that the networks of rugose ridges and valleys in the exposed submarine salt they studied (Figure 8) are “very similar to those seen in subaerial salt” (Figure 3).
The Green Knoll diapir
Figure 9. (A) Azimuth plot of dissolved and collapsed (?) upper slopes of the Green Knoll beneath the Gulf of Mexico (part of figure 7 in [13], scale recently kindly provided by Frank Peel) for comparison with (to right) plug 38 or Bustanou on the Gulf coast of Iran: (A) Relief from GeoMapApp (B) InSAR map from [14] and (C) profile along line in A (with vertical scale twice horizontal) from GeoMapApp.
Nibbelink [15] hypothesised that deep currents in the Gulf of Mexico are sufficiently strong to erode the sediments overlying the salt and dissolve any exposed salt. This hypothesis was confirmed by the 3D seismic data set presented for the Green Knoll and Walker Ridge area in the Gulf of Mexico by [13]. Their deep-towed 3.5 kHz sub-bottom profiler and 100 kHz side-scan- sonar imaged furrows, anti-dunes and other current-induced features on the gulf floor on and around Green Knoll (Figure 9A). These furrows are nine meters deep and up to 35 m wide and sweep from the northeast around both the north and south sides of Green Knoll with the deepest furrows on the southeast corner and shadow zone on the leeward WSW side. Scott et al [13] inferred that the furrows were due to bottom currents of up to 2 knots (near 103 cm/sec) flowing to the southwest around Green Knoll. They also inferred that such currents are active over geologic time rather than over the 60–120 days taken to drill nearby wells.
The Green Knoll is a diapir of ductile Louann salt extruding as a slow fountain that reaches 610 m above the surrounding sea floor. The bottom currents either do not reach or have dissolved rather than furrowed the collapsed rugose salt exposed in the summit area of the Green Knoll (Figure 9A) that might well be an active submarine karst terrain. Indeed, the submarine summit area of Green Knoll looks more rugged than the summit areas of several on the subaerial salt fountains in Iran.
Thus the summit of plug 38 or Bustanou on the gulf coast of Iran (Figure 9B) appears to be smoother
than the only slightly higher Green Knoll (Figure 9A) despite the InSAR map (Figure 9Bb from [14]) indicating that Bustanou has been passive and eroding since it rose from Upper Cretaceous to Miocene times.
3.3. The Red Sea
The Red Sea has an ultraslow rift, spreading at rates between < 10 mm/yr in the north and 16 mm/yr at 18°N [16]. The axis along the > 500 km long multi-deep region between 23°N and 19°N is characterized by a sequence of en-echelon right steeping magmatic centres without visible transform faults [17]. Fault scarps locally higher than 1000 m enclose the central graben of the Red Sea. A row of volcanic deeps down to ~2860 m below sea level (bsl) separated by shallower Inter-trough zones 1,300–1,600 m bsl are buried by thick smooth-topped Pliocene salt glaciers that Mitchell et al [18], Augustin et al [17] and Feldens and Mitchell [19] called submarine namakiers. These are huge areas of sediments flowing over Miocene salt from the flanks of the oceanic rift downslope towards its centre-line Figure 10). The namakiers are covered in pelagic sediments hundreds of m thick [18]
while no evidence for salt dissolution was recognized from seafloor morphologies. However, since then Feldens and Mitchell [19] use high resolution bathymetry to described 6 major flows of Miocene evaporites (mainly salt and anhydrite) that can be 200–500 m thick, and 3–10 km wide flow downslope over young magnetic basalts recording the nascent spreading in the central Red Sea.
Miocene evaporites up to 3–4 km thick in places accumulated in very shallow water until the Red Sea began opening in Pliocene times. These authors show spectacular high-resolution images of along- and down slope ridges, steps over the basaltic basement, strike-slip shear zones and areas of rough topography they convincingly attribute to dissolution (see Figures 2–4 in [19]).
The local topographies of these flows and the orientation of longitudinal ridges and troughs indicate their downslope senses of flow. Where two namakiers meet in the central rift they form a suture along which the salt may turn to flow parallel to the axis (Figure 10). Many volcanic ridges and fault scarps terminate where smooth rounded lobes fronting salt flows around obstructions in basement (like volcanoes) to onlap them. The entire region between 23°N and 19°N shows signs of salt flow with no fault traces being seen in areas covered by salt that is up to 800 m thick [17]. Most normal faults, folds, and thrust fronts are parallel or perpendicular to the direction of maximum seabed gradient while strike-slip shears trend downslope.
Augustin et al [17] hypothesize that large (800–1,500 km2) semicircular 100–150 m deep embayments in the sea floor top the sources of valley filing salt flows where the evaporite pile was split by the 2 km deep graben allowing the salt to flow downslope en-masse. The headwalls retreat landward and the flow toes advance into the ever-expanding axial valley.
The Red sea deeps host the largest known volumes of hydrothermally precipitated metals (94 million tons). Such concentrations are dammed by evaporites flowing into an otherwise normal ultraslow spreading graben and isolating parts of its axis into deeps with highly saline fluids that
trap hydrothermal outflows (as was probably the case in the early stages of both the Atlantic and Tethys oceans).
Most of the hemipelagic sediments seem to have hydraulically sealed the underlying evaporites and prevented their widespread dissolution. However, the presence of hypasaline brine pools not only in the rift valley but also in shallower waters high up the rift flanks suggest significant salt dissolution under the sediments [20–22]. Thus small areas with irregular surface morphologies on the salt flows indicate the surface expression salt karst structures (as indicated in Figures 11, 12) comparable to structures found e.g. in the Gulf of Mexico (Figure 11).
Figure 10. High-resolution multi-beam echo sounding image of large submarine namakiers in the central Red Sea (after [17]). Arrows mark estimated salt flow directions, dotted white lines indicate salt flow fronts.
Figure 11. Terrain texture shaded bathymetric maps using technique described [23]. Potential submarine salt karst structures compared in blankets of allochthonous salt from the Gulf of Mexico (left column) and the Red Sea (right column).
Such irregular morphologies as dendritic erosion of steep slopes (Figure 11A-B), bow-shaped step-wise fault patterns (Figure 11C-D) and semicircular depressions with irregular rims (Figure 11E-F) in the Red Sea salt flows can be compared to structures in the Gulf of Mexico that are likely to result from salt dissolution. The significantly smaller sizes and fewer obvious salt karst structures in the Red Sea compared to the Gulf of Mexico might be explained by the much younger age of the Red Sea salt, thinner sediment covers (causing less diapirism) and higher seawater salinities that slow salt dissolution in the narrow Red Sea basin.
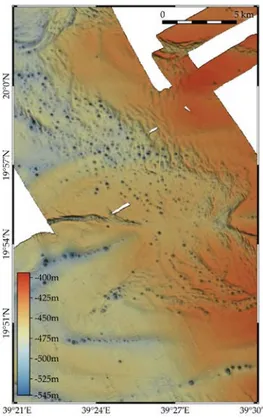
In addition to the above mentioned morphologies, Schmidt et al [24–26] report the occurrence of large pockmark fields at the eastern continental margin of the central Red Sea where pockmarks are aligned along closed linear depressions that lower the top of salt (Figure 12). Hydro-acoustic data do not show any activity of the pockmarks but shallow seismic profiles, interpreted by [3] and [27] reveal zones of acoustic turbidity under the pockmark area indicating the presence of free gas surfacing from the top of the salt. They also report that geochemical data indicate that the formation of the pockmarks is related to thermogenic hydrocarbons.
Even though the origin of the gas is not clear and may be situated within or beneath the evaporite sequence [27] fluids dissolving the salt may have travelled in one or both directions, up and/or downwards (even from or into the oceanic crust).
Figure 12. Mutibeam bathymetry of a shallow pockmark field in the continental margin of eastern Red Sea that may represent the surface expression of submarine salt karst due to rising fluids dissolving salt beneath local subsidence features on the seafloor.
3.4. Submarines salt karst terrains due to rising aggressive fluids?
Sub-circular depressions without positive rims around them occur in sediments above largely invisible salt sequences in the Red Sea. These depressions have been compared to pockmarks and attributed to fluids venting up underlying seismic chimneys (seldom above salt).
However, seismic profiles of all these negative topographic features show downward collapse with bedding truncated by slumping or shearing down their inner slopes. Any materials that rose up these chimneys must have been in solution. Even if hot or cold fluids did rise through these features, the only direct evidence is for material slumping or shearing downward into voids that were presumably flushed or dissolved. Such craters may also be the result of phreatic or phreato-magmatic explosions due to magmatic intrusion at or above the basement/salt boundary as has been suggested for the salt flooring the Danakil depression [28] a recently dammed and dry basin at the southern and of the Red Sea. However, there are recent reports of seismic images across large pipes with internal reflectors “showing a tendency to upbend” [29].
Karst terrains in limestones are still called such whether dissolution is by aggressive fluids draining downwards from onshore karst terrains or rising buoyantly in submarine karst terrains offshore [30–32]. We suggest considering submarine karst terrains developed in salt dissolved by upwelling fluids as a special category of submarine salt karst terrains.
4. Discussion
Wu et al [33] calculated that Individual salt sheets advanced many tens of km over the floor of the Gulf of Mexico at average rates between 1.5 and 275 mm/y during Miocene and Pleistocene times. Submarine salt sheets therefore can advance further and faster over saturated sediments than subaerial equivalents currently advance over dry rocks and sediments in the deserts of Iran.
Pilcher and Blumstein [12] reported that the topographies of drainage networks with rugose ridges and valleys they studied in exposed submarine salt are very similar to those seen in subaerial salt in Iran. The relief of drainage channels generally increases downslope on subaerial salt extrusions. However, a comparison of Figures 3 and 6 finds remarkably few signs of downslope flow along individual river channels on subaerial salt as reported in submarine salt bodies [12].
Below are our updated versions of speculations by Talbot and Pohjola [8] on the likely differences between subaerial and submarine salt karst terrains:
1) The pressure difference between confined diapiric salt de-stressing to free air on top of a subaerial mountain is much greater that that when confined diapiric salt de-stresses to sea water pressurised to depths of km. However, the stress difference between salt 10m deep beneath the crest of a submarine salt fountain and the surrounding seawater must still be significant. Therefore, even submarine salt is likely to de-stress and dilate, fracture and dissolve in a zone of unconfined salt on exposure to aggressive seawater, although probably not in a zone as thick as in mountain air. The zones of porous permeable brittle surficial salt expected to dilate the confined salt flowing
downslope on submarine salt extrusions are therefore likely to be far less well developed than those on subaerial salt extrusions.
2) The bimodal grain size of all subaerial extruded salt renders it significantly weaker than diapiric salt with its uniform grain size so that even confined subaerial extruded salt flows faster when wet than when dry [6]. According to [6], the fine grain sizes of mylonites formed within namakiers allow efficient solution-transfer creep to enable them to deform one to two orders of magnitude faster than coarser diapiric halite.
3) Salt extrusions flowed further and faster over the floor of the Gulf of Mexico [33] than subaerial equivalents in the deserts of Iran. This suggests that submarine Louann salt may be less viscous than subaerial Hormoz salt. Mitchell et al [18] speculated that the submarine flows of Red Sea salt up to 800 m thick could be at temperatures of 29–41 °C and might therefore flow ~1 m/yr. If this were the case, they would flow ~10 km from the walls of Thetis Deep in less than 10,000 years.
Feldens and Mitchell [19] compare their calculated Red sea salt flow speeds of several mm/year to those of onshore salt flows in Iran while adding that they must keep up with the Arabia-Nubia half spreading rates (implying flow rates of at least 5–6 mm/year).
4) The residual cap soils derived from the insoluble components of Hormoz salt that characterise subaerial salt extrusions in Iran appear to be missing from the submarine salt extrusions flooring much of the Gulf of Mexico. Instead, a pelagic rain of clay particles appears to rapidly compact to brittle shales. The top of salt is usually smooth except where it is disrupted by minor extensional faults. Such faults indicate not only that the cover of overlying shales is brittle but also imply that a surficial zone of salt is also brittle down to where such faults die (or sole?) out.
5) Salt extrusions in hot deserts surge when occasional storms of cool freshwater suddenly saturate and weaken their strong outer girdles of brittle dilated alt. Salt sheets perpetually bathed in seawater are likely to be permanently softened. However, they are unlikely to surge because any changes in physical properties (particularly salinity) of the surrounding seawater are likely to be relatively small and slow. The only sudden changes likely to disrupt any hot springs would be due to top-downward pressure effects of tsunamis or turbidity currents that would probably avoid their crests.
The clearest evidence for dissolution of submarine salt are the pools of hypersaline brines in the deeps of both the Red Sea and Gulf of Mexico. However, this dissolution could presumably be of salt beneath the sea floor rather than exposed on the sea floor.
5. Discussion
We have used evidence culled from the existing literatures with some new images of our own to argue here that normal seawater is sufficient aggressive to dissolve submarine karst terrains. A wave glider on the surface communicating to an array of seafloor transponders carefully located on areas of salt exposed on submarine salt extrusions should be able to constrain to within 1.5 cm/year any
relative lateral and/or vertical displacements of the seafloor beacons due to salt dissolution or flowing salt backing up behind obstructions. Such rates could then be used to constrain the rates of the processes that form any submarine salt karsts whether the dissolving fluids were falling or rising.
All these rates are of likely interest to salt tectonicians and the Earth scientists seeking hydrocarbons.
Acknowledgments
We thank Mike Hudec, Mehdi Zarei, and Neil Mitchell for several rounds of discussions about this topic. We also thank Robin Pilcher, Erik Scott and Frank Peel for correcting some of our mistakes while giving us permission (by e-mail) to reprint Figures 6–8 here from Pilcher and Blumstein (2007) and Figure 9A. We accept responsibility (and apologize) for any remaining mistakes in this work.
References
1. Hudec MR, Jackson MPA. (2007) Terra Infirma: understanding salt tectonics. Earth-Sci Rev 82: 1-28.
2. Frumkin A. (2013) Salt Karst. In: John F. Shroder, Frumkin, A. Treatise on Geomorphology, Vol.
6, Karst Geomorphology, San Diego: Academic Press, 407-24.
3. Feldens P, Schmidt M, Mücke I, et al. (2016) Expelled subsalt fluids form a pockmark field in the eastern Red Sea. Geo-Mar Lett 1-14.
4. Zarei M, Raeis E, Talbot, CJ. (2012) Karst development on a mobile substrate: Konarsiah salt, extrusion, Iran. Geol Mag 149 (3): 412-22.
5. Talbot CJ, (1998) Extrusions of Hormuz salt in Iran. In: Blundell, DJ. & Scott, AC. (Eds.) Lyell: the Past is the Key to the Present. Geological Society of London. Special Publications, 143: 315-34.
6. Schléder Z, Urai, JL. (2007) Deformation and recrystallization mechanisms in mylonitic shear zones in naturally deformed extrusive Eocene-Oligocene rocksalt from Eyvanekey plateau and Garmsar hills (Central Iran), J Struct Geol 29: 241-55.
7. Talbot CJ and Rogers E. (1980) Seasonal movements in an Iranian salt glacier. Science Wash 208: 395-7.
8. Talbot CJ, Pohjola V. (2009) Subaerial salt extrusions in Iran as analogues of ice sheets, streams and glaciers. Earth-Sci Rev 97: 167-95.
9. Talbot CJ, Aftabi P. (2004) Geology and models of salt extrusion at Qum Kuh, central Iran. J Geol Soc London 161: 321-34.
10. Bruthans J, Filippi M, Asadi N, et al. (2009) Surficial deposits on salt diapirs (Zagros Mountains and Persian Gulf Platform, Iran): Characterization, evolution, erosion and the influence on landscape morphology. Geomorphol 107: 195-209.
11. Tompkins RE, Shepherd LE. (1979) Orca Basin: Depositional processes, geotechnical properties and clay mineralogy of Holocene sediments within an anoxic hypersaline basin, northwest Gulf of Mexico. Mar Geol 33: 221-38.
12. Pilcher RS, Blumstein RD. (2007) Brine volume and salt dissolution rates in Orca Basin, northeast Gulf of Mexico. AAPG Bull 91: 823-33.
13. Scott E, Peel F, Taylor C, et al. (2001) Deep Water Gulf of Mexico Sea Floor Features Revealed Through 3D Seismic. Offshore Technology Conference.
14. Barnhart WD, Lohman RB. (2012) Regional trends in active diapirism revealed by mountain range-scale InSAR time series. Geophys Res Lett 39: L08309.
15. Nibbelink K. (1999) Modeling deepwater reservoir analogs through analysis of recent sediments using coherence, Seismic amplitude, and bathymetry data, Sigsbee escarpment, Green Canyon, Gulf of Mexico. Leading Edge 18(5): 550-61.
16. Chu D, Gordon R. (1998) Current plate motions across the Red Sea. Geophys J Int 135: 313-28.
17. Augustin N, Devey CW, van der Zwan FM, et al. (2014) The rifting to spreading transition in the Red Sea. Earth Planet Sci Lett 395: 217-30.
18. Mitchell NC, Ligi M, Ferrante V, et al. (2008) Submarine salt flows in the central Red Sea. Bull Geol Soc Am 122: 701-13.
19. Feldens P, Mitchell NC. (2015) Salt Flows in the central Red Sea. Chapter 8 in N.M.A. Rasul and O.C.F. Stewart (Eds), The Red Sea. Springer Earth System Science, Berlin.
20. Manheim F. (1974) Red Sea geochemistry. Initial Rep. Deep Sea Drill. Proj. 23, 975-98.
21. Pierret MC, Clauer N, Bosch D, et al. (2001) Chemical and isotopic (87Sr/86Sr, δ18O, δD) constraints to the formation processes of Red-Sea brines. Geochim Cosmochim Acta 65: 1259-75.
22. Batang ZB, Papathanassiou E, Al-Suwailem A, et al. (2012) First discovery of a cold seep on the continental margin of the central Red Sea. J Mar Syst 94: 247-53.
23. Brown L. (2014) Texture Shading: A New Technique for Depicting Terrain Relief, Presented at the ICA Mountain Cartography Workshop, 24. April 2014.
24. Schmidt M, Devey CW, Eisenhauer A. (Eds.). (2011) IFM-Geomar Report. 46: 1-80 Leibnitz- Institute of Marine Science IFM-Geomar. Kiel.
25. Schmidt M, Al-Farawati R, Al-Aidaroos A,et al. (2013) RV PELAGIA Fahrtbericht/Cruise Report 64PE350/64PE351. GEOMAR Report 5: 1-154.
26. Augustin N, Schmidt M, Devey CW, et al. (2014) The Jeddah Transect Project: Extensive mapping of the Red Sea Rift. Inter Ridge News 22: 68-73.
27. Mücke I. (2013) Geophysical and geochemical characterization of pockmarks of the central Red Sea (~19.5°N). Thesis, Faculty of Mathematics and Natural Sciences , Christian-Albrechts- Universität zu Kiel. Referees: Schmidt, M., Feldens, P. 49 pp.
28. Talbot CJ. (2008) Hydrothermal salt- but how much? Discussion. Marine & Petrol. Geology 25:
191-202.
29. Maestrelli D, Ali J, Iacopinii D, et al. (2015) Seismic expression of large-scale fluid escape pipes using time lapses seismic surveys: examples from the Loyal Field (Scotland, UK). Rend Online Soc Geol It Suppl. n. 1 al Vol. 37.
30. Land LA, Paull CK. (2000) Submarine karst belt rimming the continental slope in the Straits of Florida. Geo-Mar Lett 20:123-32.
31. Fleury, P, Bakalowicz M, de Marsily, G. (2007) Submarine springs and coastal karst aquifers: A review. J Hydrol 339: 279-92.
32. Bayari CS, Ozyurt NN, Oztan M, et al. (2011) Submarine and coastal karstic groundwater discharges along the southwestern Mediterranean coast of Turkey. Hydrogeol J 19: 399-414.
33. Wu S, Bally AW, Cramez C. (1990) Allochthonous salt, structure and stratigraphy of the northeastern Gulf of Mexico, Part 11; Structure. Mar Pet Geol 7: 334-70.
© 2016 Christopher Talbot, et al., licensee AIMS Press. This is an open access article distributed under the terms of the Creative Commons Attribution License
(http://creativecommons.org/licenses/by/4.0)
![Figure 1. Conceptual cartoon of how the global cycles of H 2 O and NaCl interact at Konarsiah (from Figure 9 in ref [4])](https://thumb-eu.123doks.com/thumbv2/1library_info/5484570.1684858/3.892.110.780.270.518/figure-conceptual-cartoon-global-cycles-interact-konarsiah-figure.webp)

![Figure 3. An aerial photo laydown of Konarsiah showing the outlines of salt extruding over the surface (white lines) from the two vents (closed white lines) along a major strike slip fault in its country rocks (from Figure 6 in ref [4])](https://thumb-eu.123doks.com/thumbv2/1library_info/5484570.1684858/5.892.168.730.139.916/figure-laydown-konarsiah-showing-outlines-extruding-surface-country.webp)
![Figure 7. W-E profile across the Orca basin with 5 times vertical exaggeration along black line in Figure 6 (from figure 4 in [12])](https://thumb-eu.123doks.com/thumbv2/1library_info/5484570.1684858/8.892.197.706.572.792/figure-profile-orca-basin-vertical-exaggeration-figure-figure.webp)
![Figure 9. (A) Azimuth plot of dissolved and collapsed (?) upper slopes of the Green Knoll beneath the Gulf of Mexico (part of figure 7 in [13], scale recently kindly provided by Frank Peel) for comparison with (to right) plug 38 or Bustanou on the Gulf](https://thumb-eu.123doks.com/thumbv2/1library_info/5484570.1684858/10.892.109.793.128.515/figure-azimuth-dissolved-collapsed-recently-provided-comparison-bustanou.webp)
![Figure 10. High-resolution multi-beam echo sounding image of large submarine namakiers in the central Red Sea (after [17])](https://thumb-eu.123doks.com/thumbv2/1library_info/5484570.1684858/12.892.157.749.360.909/figure-high-resolution-multi-sounding-submarine-namakiers-central.webp)
![Figure 11. Terrain texture shaded bathymetric maps using technique described [23]. Potential submarine salt karst structures compared in blankets of allochthonous salt from the Gulf of Mexico (left column) and the Red Sea (right column)](https://thumb-eu.123doks.com/thumbv2/1library_info/5484570.1684858/13.892.151.749.149.1044/terrain-bathymetric-technique-described-potential-submarine-structures-allochthonous.webp)