Edited by:
Eminy Hsiao-Yuan Lee, Institute of Biomedical Sciences Academia Sinica, Taiwan
Reviewed by:
Bai-Chuang Shyu, Academia Sinica, Taiwan Tzai-Wen Chiu, National Chiao Tung University, Taiwan
*Correspondence:
Winfried Schlee winfried.schlee@gmail.com
Received:
19 January 2017
Accepted:19 April 2017
Published:19 May 2017
Citation:
Neff P, Michels J, Meyer M, Schecklmann M, Langguth B and Schlee W (2017) 10 Hz Amplitude Modulated Sounds Induce Short-Term Tinnitus Suppression.
Front. Aging Neurosci. 9:130.
doi: 10.3389/fnagi.2017.00130
10 Hz Amplitude Modulated Sounds Induce Short-Term Tinnitus
Suppression
Patrick Neff
1, 2, Jakob Michels
3, Martin Meyer
1, 2, 4, Martin Schecklmann
5, Berthold Langguth
5and Winfried Schlee
5*
1
Neuroplasticity and Learning in the Healthy Aging Brain (HAB LAB), Department of Psychology, University of Zurich, Zurich, Switzerland,
2University Research Priority Program “Dynamics of Healthy Aging”, University of Zurich, Zurich, Switzerland,
3
Department of Medicine, University of Regensburg, Regensburg, Germany,
4Cognitive Psychology Unit, University of Klagenfurt, Klagenfurt, Austria,
5Department of Psychiatry and Psychotherapy, University of Regensburg, Regensburg, Germany
Objectives: Acoustic stimulation or sound therapy is proposed as a main treatment option for chronic subjective tinnitus. To further probe the field of acoustic stimulations for tinnitus therapy, this exploratory study compared 10 Hz amplitude modulated (AM) sounds (two pure tones, noise, music, and frequency modulated (FM) sounds) and unmodulated sounds (pure tone, noise) regarding their temporary suppression of tinnitus loudness. First, it was hypothesized that modulated sounds elicit larger temporary loudness suppression (residual inhibition) than unmodulated sounds. Second, with manipulation of stimulus loudness and duration of the modulated sounds weaker or stronger effects of loudness suppression were expected, respectively.
Methods: We recruited 29 participants with chronic tonal tinnitus from the multidisciplinary Tinnitus Clinic of the University of Regensburg. Participants underwent audiometric, psychometric and tinnitus pitch matching assessments followed by an acoustic stimulation experiment with a tinnitus loudness growth paradigm. In a first block participants were stimulated with all of the sounds for 3 min each and rated their subjective tinnitus loudness to the pre-stimulus loudness every 30 s after stimulus offset.
The same procedure was deployed in the second block with the pure tone AM stimuli matched to the tinnitus frequency, manipulated in length (6 min), and loudness (reduced by 30 dB and linear fade out). Repeated measures mixed model analyses of variance (ANOVA) were calculated to assess differences in loudness growth between the stimuli for each block separately.
Results: First, we found that all sounds elicit a short-term suppression of tinnitus
loudness (seconds to minutes) with strongest suppression right after stimulus offset
[F (6, 1331) = 3.74, p < 0.01]. Second, similar to previous findings we found that AM
sounds near the tinnitus frequency produce significantly stronger tinnitus loudness
suppression than noise [vs. Pink noise: t (27) = − 4.22, p < 0.0001]. Finally,
variants of the AM sound matched to the tinnitus frequency reduced in sound level
resulted in less suppression while there was no significant difference observed for
a longer stimulation duration. Moreover, feasibility of the overall procedure could be
confirmed as scores of both tinnitus loudness and questionnaires were lower after
the experiment [tinnitus loudness: t (27) = 2.77, p < 0.01; Tinnitus Questionnaire: t (27) = 2.06, p < 0.05; Tinnitus Handicap Inventory: t (27) = 1.92, p = 0.065].
Conclusion: Taken together, these results imply that AM sounds, especially in or around the tinnitus frequency, may induce larger suppression than unmodulated sounds. Future studies should thus evaluate this approach in longitudinal studies and real life settings.
Furthermore, the putative neural relation of these sound stimuli with a modulation rate in the EEG α band to the observed tinnitus suppression should be probed with respective neurophysiological methods.
Keywords: tinnitus, acoustic stimulation, sound therapy, amplitude modulation, frequency modulation, residual inhibition, entrainment, alpha
1. INTRODUCTION
Subjective tinnitus is defined as “the perception of sound(s) in the absence of an external sound source” (Eggermont and Roberts, 2004; Erlandsson and Dauman, 2013) and is deemed chronic after 12 months since first occurrence (Mazurek et al., 2010).
No less than 35% of the general (US) population are haunted by this phantom auditory perception at some point during their lifetime (Jastreboff, 1990). 10–15% report their tinnitus percept as being frequent or continuous and ∼ 1–2% suffer heavily under the condition (Langguth et al., 2013). With a steadily aging demographic, tinnitus is becoming increasingly prevalent and relevant (Hoffman and Reed, 2004; Nondahl et al., 2012). Besides the tantalizing phantom sound or comorbidities like depression, stress and anxiety (Langguth et al., 2013), tinnitus also impacts daily life functions in healthy aging as impaired hearing, sound localization and speech perception can lower the quality of life in tinnitus sufferers (Moon et al., 2015; Gilles et al., 2016; Hyvärinen et al., 2016).
In the majority of cases tinnitus manifests as a single tone, ringing or noise with a definable pitch and loudness, which is perceived bilaterally or with a slight preference to one side, or alternatively lateralized to one ear (Lockwood et al., 2002). Tinnitus pitch, laterality and loudness can be therefore considered as the main (subjective) perceptual parameters of interest in addition to maskability and residual inhibition by external sounds (Henry and Meikle, 2000). Usually, tinnitus is considered to be caused by either objective (Eggermont and Roberts, 2004; Schaette and Kempter, 2006; Mazurek et al., 2010) or hidden hearing loss (Weisz et al., 2006; Schaette and McAlpine, 2011; Adjamian et al., 2012; Xiong et al., 2013), where loss of cochlear hair cells in objective hearing loss has been shown to lead to maladaptive plasticity throughout the auditory pathway and brain. Tinnitus pitch seems to average near the frequency of maximal hearing loss, especially in sufferers with pure-tone tinnitus (Schecklmann et al., 2012). Related to this maladaptive plasticity, a similarity of tinnitus to phantom limb or general phantom (pain) perception following sensory deafferentation has also been proposed (De Ridder et al., 2011). Although models of pathogenesis and physiology are still being debated and are limited by an underlying inherent heterogeneity of the disorder, it can be stated with confidence that both the inner ear and the brain are involved (Jastreboff, 1990; Eggermont and Roberts,
2004; Adjamian et al., 2009; De Ridder et al., 2011, 2014; Vanneste and De Ridder, 2012; Elgoyhen et al., 2015).
Acoustic stimulations have been used in various forms to counteract or alleviate the malicious phantom percept (Jastreboff, 2007). From a clinical routine perspective, acoustic stimulation or sound therapies are proposed as symptom- oriented treatment options besides cognitive behavioral therapy and neuromodulation or -stimulation if chronic subjective tinnitus persists after standard clinical assessment and intervention (Langguth et al., 2013). Traditionally, masking approaches using broadband or narrow-band noise, or pure tones, were established first (Feldmann, 1971; Vernon, 1977;
Watanabe et al., 1997; Henry et al., 2004; Hazell and Wood, 2009). These maskers have also been administered in hearing aids (Vernon and Meikle, 2003) with slightly better effects than hearing aids without maskers as shown in a study by Henry et al. (2015). In recent times, two major acoustic stimulation techniques for long-term, daily intervention have been developed building on the model of lateral inhibition (Pantev et al., 2012;
Adamchic et al., 2014). Following peripheral hearing loss, central tonotopic map reorganization and hyperactivity in regions of the reorganization responsible for the tinnitus sensation (Eggermont and Komiya, 2000; Eggermont and Roberts, 2004), lateral inhibition is theorized to counteract or reverse this maladaptive hyperactivity. Pantev and colleagues therefore proposed to apply a notch filter in a single octave band around the tinnitus frequency to music. The energy of the sound signal at the edges of the notch filter is theorized to inhibit the frequencies around the tinnitus pitch therefore reversing the maladaptive plasticity, which has been shown to be effective in long-term intervention (Okamoto et al., 2010). The width of the notch filter did not significantly influence treatment effects in a further study (Wunderlich et al., 2015b) while the spectral contrast (i.e., increased sound pressure at frequencies neighboring the filter edges) seems to improve the treatment effects as shown in a further follow up study (Stein et al., 2015). Building on similar reasoning about frequencies neighboring the tinnitus pitch and lateral inhibition, Tass and colleagues (Tass et al., 2012) established a method where sine tones are presented in a randomized fashion around the tinnitus frequency for several hours a day with similar longitudinal therapeutic effects.
While the established approaches focus on the retraining
of auditory and related cortical structures in longitudinal
therapeutic interventions (Pantev et al., 2012; Adamchic et al., 2014), only few studies looked at the effect of sounds on the temporary suppression of tinnitus (Roberts et al., 2006, 2008; Reavis et al., 2012) to identify possible candidates for future tinnitus sound therapies. Acoustic stimulation with amplitude modulation (AM) and frequency modulation (FM) (Reavis et al., 2012; Tyler et al., 2014) has just recently entered this line of research building on results of electrical stimulation of the cochlea (Zeng et al., 2011). The results of these studies indicate that especially AM sounds in the higher, tinnitus-relevant frequencies of 3,000–9,000 Hz produce a more pronounced tinnitus suppression during and after the stimulation compared to their unmodulated pendants or white noise. In any case, longitudinal data on efficacy and long-term as well as momentary neuroplastic alterations of continuous modulated or patterned, sounds is missing.
Therefore, approaches showing efficacy and feasibility in single session experiments with short stimulation duration measuring tinnitus suppression (i.e., residual inhibition) should be tested in longitudinal, prospective placebo-controlled studies to assess long-term efficacy. While recent studies with AM and/or FM sounds, used 40 Hz for the modulation rate (Reavis et al., 2012;
Tyler et al., 2014), which is known to produce the largest neural responses in auditory cortex through entrainment as shown in auditory steady-state response (ASSR) paradigms (Picton et al., 2003), no former study tested the influence of lower modulation rates in different carrier sounds, including the tinnitus pitch, for tinnitus suppression. Of special interest here, several reviewed studies in Picton et al. (2003) could also show entrainment effects for different bands including the alpha frequency band.
Cortical auditory α activity has been shown to be decreased in tinnitus patients in MEG (Weisz et al., 2005; Schlee et al., 2014), EEG (Moazami-Goudarzi et al., 2010) and possibly also reduced in variability (Schlee et al., 2014). Looking at modulation depth of the stimuli and strength of (entrainment) effect as measured by EEG or MEG, several studies have reliably shown entrainment effects of monaural AM stimuli (100% modulation depth) superior to binaural AM stimuli (Picton et al., 2003;
Schwarz and Taylor, 2005; Draganova et al., 2008; Becher et al., 2015). A modulation rate in the α frequency band as well as monaural stimuli with a maximized entrainment effect may therefore enable a normalization of reduced auditory α and thereby concomitantly reduce the tinnitus percept. Based on this preliminary reasoning we here investigated the effects of AM sounds in the α band for tinnitus sound therapy. Yet, the focus of this study was set on the behavioral level to proof the concept and feasibility in the absence of neurophysiological methods.
In the exploratory study at hand, we therefore tested the influence of 10 Hz AM sounds (two pure tones, noise, music and FM sounds) and unmodulated sounds (pure tone, noise) on the temporary suppression of subjective tinnitus loudness in participants with tonal tinnitus in block 1 of the experiment. We hypothesize that all sounds may elicit a short-term suppression of tinnitus loudness (seconds to minutes) with strongest suppression right after stimulus offset (Roberts et al., 2006, 2008; Reavis et al., 2012;
Tyler et al., 2014). Given the different types of modulated
and unmodulated sounds with frequencies in or around the actual tinnitus pitch, we expect to find differential suppression patterns between the stimuli with AM sounds possibly eliciting enhanced suppression (Reavis et al., 2012).
Additionally, with the manipulation of stimulation length and loudness in block 2 of the experiment, we anticipate more pronounced or weaker effects of tinnitus loudness suppression, respectively.
2. METHODS 2.1. Participants
Patients with chronic tonal tinnitus (>12 months tinnitus duration), who had consulted the multidisciplinary Tinnitus Clinic of the University of Regensburg, were included in the study if their age was between 18 and 75 years. Patients with history or presence of severe and relevant somatic, neurological, or mental disorders were excluded. Intake of psychotropic medication or ongoing participation in tinnitus therapies were further exclusion criteria. The study was approved by the Ethics Committee of the University of Regensburg (16-101-0061). All participants gave written informed consent after a comprehensive explanation of the procedures.
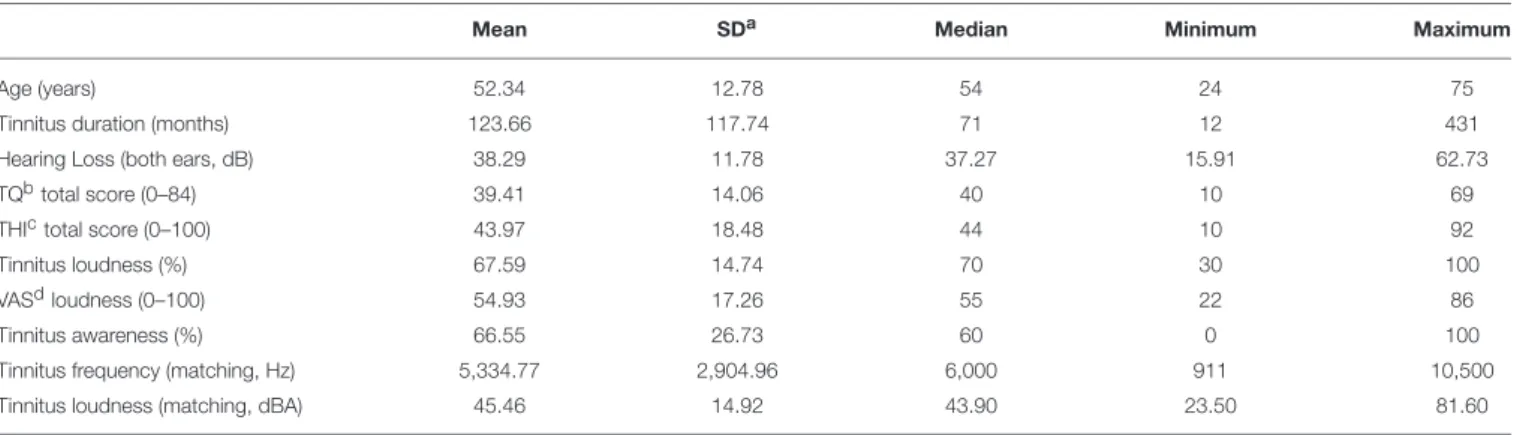
After signing the consent, form all participants completed the tinnitus questionnaire (TQ) (Hallam et al., 1988; Goebel and Hiller, 1994), the Tinnitus Handicap Inventory (THI) (Newman et al., 1996), and a visual analog scale (VAS) (Adamchic et al., 2012) with respect to tinnitus loudness (spanning from inaudibility to maximal imaginable loudness). The Tinnitus Sample Case History Questionnaire (TSCHQ) was used to gather clinical and demographic data of all patients (Langguth et al., 2007). Furthermore, hearing level was measured with a standard audiogram using frequencies ranging from 125 Hz to 8 kHz in octave steps with semi-octave steps between 2 and 4 (i.e., 3 kHz), and 4 and 8 kHz (i.e., 6 kHz), respectively (Madsen Midimate 622D; GN Otometrics, Denmark). Headphones used for audiometry, tinnitus matching, as well as for the stimulation procedure were quasi-linear in their frequency response over the whole audible spectrum (Sennheiser HDA 2000; Sennheiser, Germany).
Questionnaire scores and participants characteristics are listed in Table 1. The distribution of sexes in the sample was slightly skewed with 11 female and 18 male participants. 3 participants reported a purely left-sided, 2 participants a purely right-sided tinnitus. The majority of participants indicated some form of bilateral or diffuse tinnitus location, with 8 participants indicating tinnitus in both ears, 4 inside the head, 7 both ears with a tendency to the left side, and 4 with a tendency to the right side.
A specific tinnitus laterality was not considered as an inclusion criterion due to the diotic presentation of the stimuli. Hearing thresholds slightly differed between ears [right side: mean = 40.63, SD = 13.24; left side: mean = 39.46, SD = 12.17; t
(28)= 2.10, p = 0.044].
2.2. Tinnitus Matching
After filling in the questionnaires and audiometry, participants
were seated in front of a screen with a computer mouse and
TABLE 1 | Participants characteristics (n
=29).
Mean SD
aMedian Minimum Maximum
Age (years) 52.34 12.78 54 24 75
Tinnitus duration (months) 123.66 117.74 71 12 431
Hearing Loss (both ears, dB) 38.29 11.78 37.27 15.91 62.73
TQ
btotal score (0–84) 39.41 14.06 40 10 69
THI
ctotal score (0–100) 43.97 18.48 44 10 92
Tinnitus loudness (%) 67.59 14.74 70 30 100
VAS
dloudness (0–100) 54.93 17.26 55 22 86
Tinnitus awareness (%) 66.55 26.73 60 0 100
Tinnitus frequency (matching, Hz) 5,334.77 2,904.96 6,000 911 10,500
Tinnitus loudness (matching, dBA) 45.46 14.92 43.90 23.50 81.60
aSD, Standard Deviation;bTQ, Tinnitus Questionnaire (Goebel and Hiller, 1994);cTHI, Tinnitus Handicap Inventory (Newman et al., 1996);dVAS, visual analog scale.
instructed for the tinnitus matching via software. The matching procedure was designed around a sine tone generator (Meyer et al., 2014) where pitch (in single Hz resolution), amplitude and laterality (panning) could be defined and controlled using MAX software (MAX 7; Cycling’74, USA). First, the loudness and lateralization of the tinnitus was roughly defined followed by the actual pitch by the study personnel (Penner and Bilger, 1992; Henry and Meikle, 2000). Participants were then made familiar with the handling of the pitch dial on the graphical user interface and informed about the possibility to adjust the tinnitus pitch in 1 Hz steps while holding down the shift key on the keyboard. Following that, participants proceeded with the actual pitch matching self-reliantly. To ensure reliability and validity of the procedure, the final pitch indicated by the participant was shifted an octave down and up and checked with the participant, respectively, to control for possible octave confusion. Finally, the matched tone was evaluated in a short discussion with the study personnel and rated on a 5 point likert scale (1 = not at all matching the tinnitus percept, 5 = perfect fit). Frequency and loudness results of the matching procedure are listed in Table 1.
2.3. Sound Stimuli
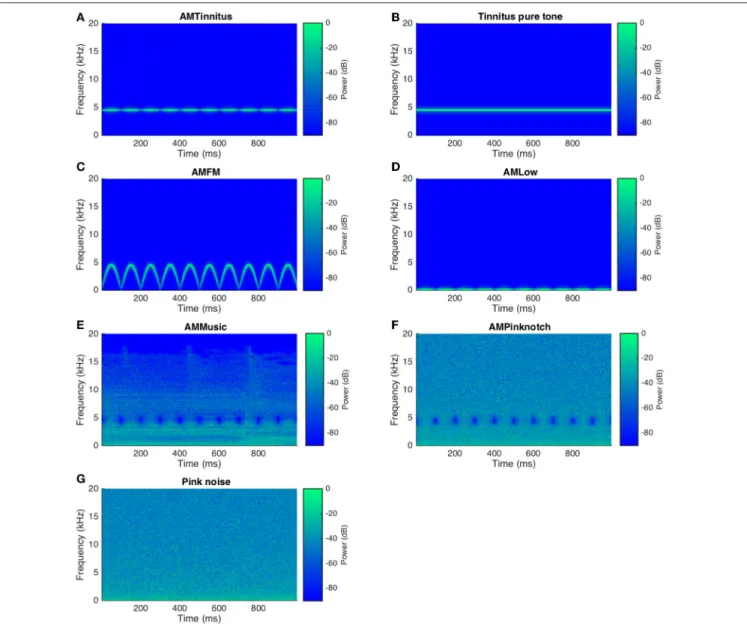
A set of 3 amplitude modulated, 2 notch filter amplitude modulated as well as 2 unmodulated sounds were prepared in MATLAB (Matlab R2015a; Mathworks, USA). Besides sine tones in 4 and noise in 2 conditions, a variety of popular music songs was provided to the participants out of which they could choose their favorite song for notch filter modulated presentation in one condition. A sum total of 7 acoustic stimuli or conditions with 3 min of duration was therefore produced for each participant for block 1. In the remainder of this manuscript, including tables and figures, we termed the different stimuli as follows: “AMTinnitus” for AM sounds centered at the tinnitus frequency (Figure 1A), “Tinnitus pure tone” for unmodulated sounds centered at the tinnitus frequency (Figure 1B), “AMFM”
for the AM FM sound (Figure 1C), “AMLow” for AM of the 108 Hz sound (Figure 1D), “AMMusic” for the AM of musical songs (Figure 1E), “AMPinknotch” for the filter AM of pink noise (Figure 1F), and “Pink noise” for the pink noise sound (Figure 1G). For block 2, participants could choose their favorite
stimulus, besides AM in the tinnitus frequency (AMTinnitus), after completing block 1. The AMTinnitus and the chosen stimulus were then manipulated in length, or loudness, or faded (linear fade out in the last minute of the stimulus) resulting in 3 conditions for two stimuli in block 2.
For AMTinnitus, a carrier sine tone was generated and amplitude modulated (100% modulation depth) with a sinusoidal function according to the following principle, where the first part of the equation represents the carrier sound and the second part the modulator. Note that the information in brackets in the legend of the equation is indicative of study-specific settings:
s = ca ∗ sin(2 ∗ π ∗ cf ∗ t) ∗ mia ∗ cos(2 ∗ π ∗ mf ∗ t + φ) (1) where:
s sinusoidally amplitude modulated sound ca carrier amplitude
cf carrier frequency ( = tinnitus frequency)
t time
mia modulator index/amplitude ( = 1) mf modulator frequency ( = 10 Hz)
φ phase
For the AMPinknotch and AMMusic sounds the target of the 10 Hz modulator was the notch filter amplitude. The notch filter used (Butterworth, filter order = 4) was centered around the matched tinnitus frequency with a filter bandwidth of 1 octave (Okamoto et al., 2010; Wunderlich et al., 2015a). With the filter amplitude modulation applied, the resulting sounds where rhythmically suppressed in the octave around the tinnitus frequency, giving the acoustic impression of a slight flutter in the stimulus.
For the AMFM sound, a FM sweep from 0 Hz up to the
tinnitus frequency with a modulation rate of 10 Hz served
as the carrier sound, which was then amplitude modulated
like AMTinnitus (i.e., 100% modulation depth). AMLow with
a low frequency carrier sound (108 Hz instead of tinnitus
frequency) was generated analogously to AMTinnitus. Finally,
the unmodulated stimuli, namely Tinnitus pure tone and Pink
noise, were generated. Possible transient artifacts were avoided in
the beginning and the end of the stimuli through ramping (linear
FIGURE 1 | Spectrograms of all sound stimuli (1 s snippets). For all of the plotted representative stimuli an arbitrary tinnitus frequency of 4,500 Hz was chosen and stimuli normalized to full digital displacement. The modulation rate was constant at 10 Hz in modulated sounds (A,C–F) whereas (B,G) represent the
unmodulated stimuli. Stimulus presentation was set to 3 min for all stimuli and block 1. In block 2 AMTinnitus (A) underwent loudness (loudness reduction by 30 dB and linear fade out) and temporal (duration of 6 min) manipulations resulting in 4 stimuli including the standard AMTinnitus stimulus from block 1.
fade with 100 ms window). Stimuli were then normalized in sound level and finally exported for the experimental procedure.
2.4. Acoustic Stimulation Procedure
All stimuli were presented at sound levels of 60 dB SL in block 1 (i.e., in broadband stimuli noise and music to the average hearing threshold, whereas in frequency specific stimuli the nearest frequency of the audiogram was chosen as reference for the level adjustment). For block 2, the AMTinnitus and the stimulus of choice were (1) presented for 6 min, (2) reduced in sound level (30 instead of 60 dB SL) and (3) processed with a linear sound level fade out in the last minute of the stimulus.
By varying these core parameters of stimulation length and
sound level in block 2, we tested differential tinnitus suppression patterns within single stimuli classes with a focus on AMTinnitus.
To ensure comfort and safety of the participants, 80 dBA was the upper limit for the sound level of all stimuli. Sound level was carefully checked with an SPL meter (NTi Audio XL2; NTi Audio, Lichtenstein) before actual stimulation. Participants were reminded of the option to interrupt the procedure whenever a sound was deemed uncomfortable at any point of the experiment.
For the acoustic stimulation procedure participants were
seated comfortably facing a window with a view on trees to avoid
distraction and ensure calmness. No particular instruction was
given to focus their attention on either the sound or tinnitus. The
presentation sequence of the stimuli was randomized in the two
blocks for each participant. Participants were instructed to relax during the acoustic stimulation and to rate the loudness of their tinnitus in percent, compared to the pre-stimulation loudness, after each stimulation at time points 0, 30, 60, 90, 120, 150, and 180 s. A similar approach of tinnitus loudness growth was used in the study by Reavis and colleagues (Reavis et al., 2012). However, we diverged from the former study by not measuring suppression during acoustic stimulation, having no reference tones in and after the stimulation and deploying a loudness regime tied to hearing loss with 60 dB SL (Reavis et al. (2012) presented stimuli slightly below matched tinnitus loudness). There was a short break between the blocks to maintain vigilance and comfort of the participants. At the end of the study after block 2, the VAS for tinnitus loudness and tinnitus questionnaires were again filled in by the participants. Participants were then thanked for their participation and finally dismissed.
2.5. Data Analysis
A repeated measures mixed model analysis of variance (ANOVA) was calculated with the factors time and condition as well as a random intercept per participant to assess the effect of temporary tinnitus suppression in the loudness growth paradigm. Post hoc tests of the ANOVA controlled for multiple comparisons contrasting the suppression profiles between the stimuli were performed using the Tukey method. Finally, paired two-tailed t-tests were used to compare tinnitus questionnaire scores and tinnitus loudness VAS before and after acoustic stimulation procedure. As the 3 variables subjected to the paired comparisons were considered within an independent analysis and not part of any primary outcome statistical model or search space, we refrained from a correction for multiple comparisons (e.g., bonferroni) for this secondary analysis. R statistic toolbox with the supplementary libraries “nlme” and “lsmeans” was used for all statistical calculations (R version 3.3.2; R Foundation for Statistical Computing, Austria).
3. RESULTS
3.1. Tinnitus Loudness Growth after Acoustic Stimulation
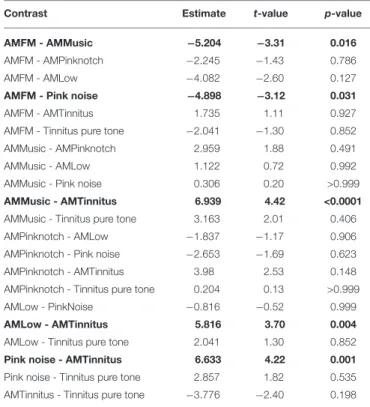
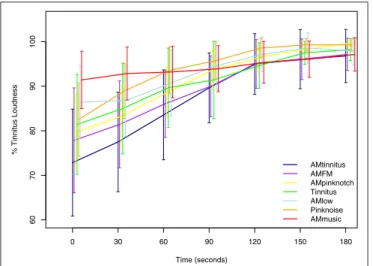
The results of the ANOVA for the tinnitus loudness growth curves of all stimuli in block 1 are shown in Table 2 and respective corrected post-hoc contrasts in Table 3. Notably, there was a significant effect of condition, time, and interaction condition*time on the tinnitus loudness. Mean tinnitus loudness suppression curves are plotted in Figure 2.
Post hoc contrasts between each of the 7 stimuli elicited significant differences (p < 0.05) for AMMusic vs. AMTinnitus [t
(27)= 4.42, p < 0.0001], Pink noise vs. AMTinnitus [t
(27)= 4.22, p = 0.001], AMLow vs. AMTinnitus [t
(27)= 3.70, p = 0.004], AMFM vs. AMMusic [t
(27)= − 3.31, p = 0.016], and AMFM vs. Pink Noise [t
(27)= − 3.12, p = 0.031], respectively.
These results are indicative of a pattern of enhanced tinnitus suppression of AMTinnitus and AMFM compared to Pink Noise, AMMusic, and AMLow [except AMFM vs. AMLow with t
(27)=
− 2.60, p = 0.127].
TABLE 2 | Results of ANOVA block 1 (n
=28).
numDF
adenDF
b F-value p-value(Intercept) 1 1,331 2,845.28 <0.0001
Condition 6 1,331 5.40 <0.0001
Time 1 1,331 185.81 <0.0001
Condition:Time 6 1,331 3.74 0.0011
anumDF, degrees of freedom of numerator;bdenDF, degrees of freedom of denominator.
TABLE 3 |
Post-hoccontrasts block 1 (n
=28, Tukey-adjusted).
Contrast Estimate
t-value p-valueAMFM - AMMusic
−5.204
−3.31 0.016
AMFM - AMPinknotch
−2.245 −1.430.786
AMFM - AMLow
−4.082 −2.600.127
AMFM - Pink noise
−4.898
−3.12 0.031
AMFM - AMTinnitus 1.735 1.11 0.927
AMFM - Tinnitus pure tone
−2.041 −1.300.852
AMMusic - AMPinknotch 2.959 1.88 0.491
AMMusic - AMLow 1.122 0.72 0.992
AMMusic - Pink noise 0.306 0.20 >0.999
AMMusic - AMTinnitus 6.939 4.42 <0.0001
AMMusic - Tinnitus pure tone 3.163 2.01 0.406
AMPinknotch - AMLow
−1.837 −1.170.906
AMPinknotch - Pink noise
−2.653 −1.690.623
AMPinknotch - AMTinnitus 3.98 2.53 0.148
AMPinknotch - Tinnitus pure tone 0.204 0.13 >0.999
AMLow - PinkNoise
−0.816 −0.520.999
AMLow - AMTinnitus 5.816 3.70 0.004
AMLow - Tinnitus pure tone 2.041 1.30 0.852
Pink noise - AMTinnitus 6.633 4.22 0.001
Pink noise - Tinnitus pure tone 2.857 1.82 0.535
AMTinnitus - Tinnitus pure tone
−3.776 −2.400.198
Degrees of freedom=1,331; Standard error =1.517; Significant differences are highlighted in bold.
To counteract possible effects of the stimulation sequence in block 1, we furthermore tested the data for order effects with no significant results for position [F
(1, 1317)= 0.05, p
= 0.832], condition
∗position [F
(6, 1317)= 0.94, p = 0.468], time*position [F
(1, 1317)= 3.05, p = 0.081], and interaction condition
∗time
∗position [F
(6, 1317)= 0.70, p = 0.646].
For block 2, we report the results for tinnitus loudness growth of the manipulated variations of AMTinnitus (long (6 min of duration), fade, and reduced sound level) with the addition of the data of AMTinnitus of block 1 (standard) in Table 4. Post- hoc contrasts are indicated in Table 5 and mean tinnitus loudness suppression curves are plotted in Figure 3. Of special interest and according to our expectations, longer stimulation (long, 6 min) resulted in a larger suppression compared to stimulations reduced in sound level [fade vs. long: t
(27)= 3.88, p = 0.00065;
reduced sound level vs. long: t
(27)= 4.00, p = 0.00041] but
no significant differences with the AMTinnitus stimulation for
60708090100
Time (seconds)
% Tinnitus Loudness
0 30 60 90 120 150 180
AMtinnitus AMFM AMpinknotch Tinnitus AMlow Pinknoise AMmusic
FIGURE 2 | Mean tinnitus loudness suppression after stimulus offset of all sound stimuli in block 1. Confidence intervals at 95% are plotted for each condition and time point. Notably, after 90–120 s tinnitus loudness suppression generally diminishes and curves of the different stimuli converge.
Significant differences between stimuli (conditions) are listed in Table 3.
TABLE 4 | Results of ANOVA for AMTinnitus in block 2 (n
=28).
numDF
adenDF
b F-value p-value(Intercept) 1 749 746.20 <0.0001
Condition 3 749 7.62 0.0001
Time 1 749 201.14 <0.0001
Condition:Time 3 749 2.70 0.0443
anumDF, degrees of freedom of numerator;bdenDF, degrees of freedom of denominator.
TABLE 5 |
Post-hoccontrasts block 2 (n
=28, Tukey-adjusted).
Contrast Estimate
t-value p-valueFade - Reduced sound level
−0.153 −0.120.999
Fade - Long 5.153 3.88 0.00065
Fade - Standard 3.265 2.46 0.067
Reduced sound level - Long 5.306 4.00 0.00041
Reduced sound level - Standard 3.418 2.57 0.050
Long - Standard
−1.887 −1.420.486
Degrees of freedom=749; Standard error=1.328; Significant differences are highlighted in bold.
3 min from block 1 [long vs. standard: t
(27)= − 1.42, p = 0.486]. Furthermore, AMTinnitus elicited marginally increased suppression compared to the faded stimulus [fade vs. standard:
t
(27)= 2.46, p = 0.067, trend] and the stimulus with reduced sound level [reduced sound level vs. standard: t
(27)= 2.57, p
= 0.050]. The comparison of the two stimuli with manipulated sound level resulted in no significant difference [fade vs. reduced sound level: t
(27)= − 0.12, p = 0.999].
60708090100
Time (seconds)
% Tinnitus Loudness
0 30 60 90 120 150 180
standard longer duration reduced sound level fade
FIGURE 3 | Mean tinnitus loudness suppression after stimulus offset of AMTinnitus and its variations in block 2. Confidence intervals at 95% are plotted for each condition and time point. Standard and longer duration of the stimulus are colored in blue whereas stimuli with reduced sound level or fade out are colored in green. Significant differences between stimuli (conditions) are listed in Table 5.
3.2. Responder Patterns and Overall Feasibility
The evaluation of the matched tinnitus pitch resulted in a mean of 4.0 (SD = 0.55, with 5 indicating perfect fit) highlighting the reasonable quality of the matching procedure. The response criterion for temporary tinnitus suppression was set to any suppression per stimuli (here at t0, right after the offset of the auditory stimulation) as similarly done before (Reavis et al., 2012). Applying this criterion, the following descriptive responder pattern emerges: In the AMTinnitus condition 19 out of 28 participants indicated a suppression at t0, in AMPinknotch 19/28, in AMFM 16/28, in Pink noise 16/28, in AMLow 13/28, in Tinnitus pure tone 13/28, and in AMMusic 8/20.
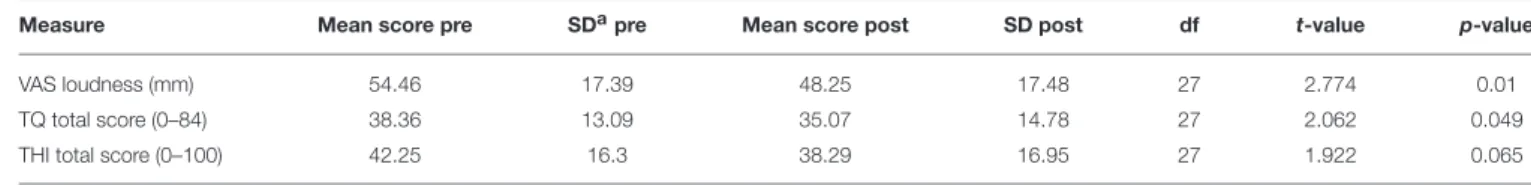
Differences in tinnitus loudness (VAS) and total scores of standardized questionnaires (TQ and THI) comparing assessments before and after experimental procedures are listed in Table 6 and summarized in the following: Tinnitus loudness (VAS) was significantly reduced after experimental procedures compared to the baseline assessment [t
(27)= 2.774, p = 0.01].
Furthermore, TQ and THI scores measuring tinnitus-related distress were also both lower after the experiment. While TQ scores are below the p-value threshold of p = 0.05, we can only report a trend for the THI [TQ: t
(27)= 2.062, p = 0.049; THI:
t
(27)= 1.922, p = 0.065]. It has to be noted though, that the effects reported here are based on the possible influence of all amplitude modulated sounds as well as unmodulated “control” sounds and this secondary analysis serves safety and feasibility purposes.
4. DISCUSSION
Acoustic stimulation or sound therapy is proposed as a main
treatment option for chronic subjective tinnitus (Langguth et al.,
TABLE 6 | Differences in tinnitus loudness and questionnaire scores before (pre) and after (post) experimental procedures.
Measure Mean score pre SD
apre Mean score post SD post df
t-value p-valueVAS loudness (mm) 54.46 17.39 48.25 17.48 27 2.774 0.01
TQ total score (0–84) 38.36 13.09 35.07 14.78 27 2.062 0.049
THI total score (0–100) 42.25 16.3 38.29 16.95 27 1.922 0.065
aSD, Standard Deviation.