https://doi.org/10.5194/bg-14-3603-2017-supplement
© Author(s) 2017. This work is distributed under the Creative Commons Attribution 3.0 License.
Supplement of
Impact of trace metal concentrations on coccolithophore growth and morphology: laboratory simulations of Cretaceous stress
Giulia Faucher et al.
Correspondence to:
Giulia Faucher (giulia.faucher@unimi.it)
The copyright of individual parts of the supplement might differ from the CC BY 3.0 License.
Tab.S1 Growth rate (d
-1), coccosphere and cell diameters (µm) and volume of the calcitic part (VCP; µm
3) of E. huxleyi at the end of our experiments for each replicate.
r1 0.54 0.57 0.56 0.57
r2 0.50 0.55 0.56 0.56
r3 0.52 0.58 0.56 0.56
Average 0.52 0.57 0.56 0.57
r=replicate
Control Low Medium High
r1 11.80 12.17 11.89 12.07
r2 11.59 12.01 11.86 12.09
r3 11.72 12.15 11.88 11.81
Average 11.70 12.11 11.88 11.99
Control Low Medium High
r1 9.36 9.01 8.97 9.01
r2 8.71 8.82 9.00 8.98
r3 9.02 8.96 9.09 8.95
Average 9.03 8.93 9.02 8.98
Control Low Medium High
r1 440.16 577.15 507.49 555.45
r2 473.89 538.06 501.00 551.27
r3 475.14 595.43 494.41 492.81
Average 463.06 570.21 500.97 533.18 Coccosphere Diameter
Cell Diameter
VCP
Control Low Medium High
r1 0.66 0.58 0.59 0.56
r2 0.66 0.58 0.60 0.59
r3 0.67 0.58 0.62 0.59
Average 0.66 0.58 0.60 0.58
r=replicate
Control Low Medium High
r1 7.25 6.60 6.58 6.09
r2 7.26 6.58 6.55 6.17
r3 7.24 6.56 6.67 6.16
Average 7.25 6.58 6.60 6.14
Control Low Medium High
r1 5.42 5.16 5.17 4.72
r2 5.51 5.10 5.16 4.78
r3 5.41 5.29 5.23 4.74
Average 5.45 5.18 5.19 4.74
Control Low Medium High
r1 116.84 77.42 75.59 60.61
r2 91.13 76.79 74.21 63.39
r3 95.08 72.24 82.43 64.89
Average 101.02 75.48 77.41 62.96 Coccosphere Diameter
Cell Diameter
VCP
Tab.S3 Growth rate (d
-1), coccosphere and cell diameters (µm) and volume of the calcitic part (VCP; µm
3) of C. pelagicus at the end of our experiments for each replicate.
r1 0.55 0.42 0.47 0.44
r2 0.56 0.43 0.42 0.44
r3 0.56 0.42 0.39 0.42
Average 0.56 0.42 0.43 0.43
r=replicate
Control Low Medium High
r1 19.70 17.01 16.96 16.98
r2 19.90 17.21 16.91 17.13
r3 19.85 17.15 17.27 16.45
Average 19.82 17.12 17.05 16.85
Control Low Medium High
r1 14.05 10.09 10.16 10.35
r2 16.57 10.13 10.11 10.34
r3 16.33 10.09 11.10 10.45
Average 15.65 10.10 10.46 10.38
Control Low Medium High
r1 1751.16 2112.43 2071.18 1919.11 r2 1806.95 2133.68 1966.05 2153.53 r3 1722.13 2062.28 2072.10 1789.59 Average 1760.08 2102.80 2036.44 1954.08
Coccosphere Diameter
Cell Diameter
VCP
Control Low Medium High
r1 0.54 0.57 0.56 0.57
r2 0.50 0.55 0.56 0.56
r3 0.52 0.58 0.56 0.56
Average 0.52 0.57 0.56 0.57
r=replicate
Control Low Medium High
r1 11.80 12.17 11.89 12.07
r2 11.59 12.01 11.86 12.09
r3 11.72 12.15 11.88 11.81
Average 11.70 12.11 11.88 11.99
Control Low Medium High
r1 9.36 9.01 8.97 9.01
r2 8.71 8.82 9.00 8.98
r3 9.02 8.96 9.09 8.95
Average 9.03 8.93 9.02 8.98
Control Low Medium High
r1 440.16 577.15 507.49 555.45
r2 473.89 538.06 501.00 551.27
r3 475.14 595.43 494.41 492.81
Average 463.06 570.21 500.97 533.18 Coccosphere Diameter
Cell Diameter
VCP
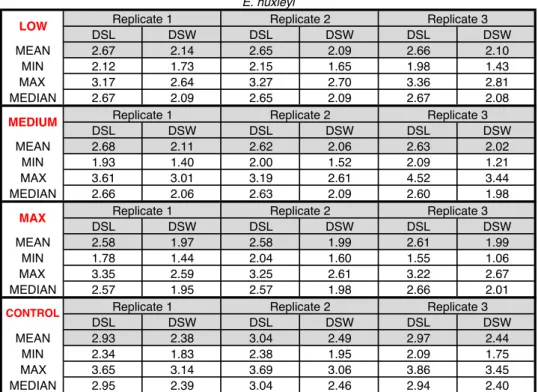
Table S5. E. huxleyi and G. oceanica coccolith distal shield length (DSL) and distal shield width (DSW):
mean, minimum (MIN), maximum (MAX) and median values (n=50 coccoliths measurements for each replicate) for every treatment, at the end of the experiment.
MEAN 2.67 2.14 2.65 2.09 2.66 2.10
MIN 2.12 1.73 2.15 1.65 1.98 1.43
MAX 3.17 2.64 3.27 2.70 3.36 2.81
MEDIAN 2.67 2.09 2.65 2.09 2.67 2.08
DSL DSW DSL DSW DSL DSW
MEAN 2.68 2.11 2.62 2.06 2.63 2.02
MIN 1.93 1.40 2.00 1.52 2.09 1.21
MAX 3.61 3.01 3.19 2.61 4.52 3.44
MEDIAN 2.66 2.06 2.63 2.09 2.60 1.98
DSL DSW DSL DSW DSL DSW
MEAN 2.58 1.97 2.58 1.99 2.61 1.99
MIN 1.78 1.44 2.04 1.60 1.55 1.06
MAX 3.35 2.59 3.25 2.61 3.22 2.67
MEDIAN 2.57 1.95 2.57 1.98 2.66 2.01
DSL DSW DSL DSW DSL DSW
MEAN 2.93 2.38 3.04 2.49 2.97 2.44
MIN 2.34 1.83 2.38 1.95 2.09 1.75
MAX 3.65 3.14 3.69 3.06 3.86 3.45
MEDIAN 2.95 2.39 3.04 2.46 2.94 2.40
DSL DSW DSL DSW DSL DSW
MEAN 4.02 3.46 4.12 3.61 4.15 3.63
MIN 3.06 2.47 3.30 2.70 3.27 2.79
MAX 4.84 4.55 5.30 4.90 5.38 4.95
MEDIAN 4.00 3.46 4.04 3.51 4.14 3.61
DSL DSW DSL DSW DSL DSW
MEAN 4.16 3.56 4.18 3.60 4.13 3.59
MIN 3.12 2.58 3.22 2.53 3.19 2.77
MAX 5.15 4.47 5.89 5.15 5.70 4.78
MEDIAN 4.17 3.51 4.14 3.55 4.06 3.48
DSL DSW DSL DSW DSL DSW
MEAN 3.96 3.34 3.89 3.30 4.06 3.47
MIN 3.13 2.57 3.18 2.47 3.34 2.80
MAX 5.09 4.75 5.32 4.64 5.73 5.21
MEDIAN 3.96 3.29 3.77 3.19 4.05 3.42
DSL DSW DSL DSW DSL DSW
MEAN 4.26 3.72 4.26 3.73 4.42 3.87
MIN 3.28 2.93 3.24 2.90 3.41 3.11
MAX 5.18 4.41 5.11 4.45 5.78 4.77
MEDIAN 4.25 3.76 4.27 3.73 4.37 3.85
CONTROL Replicate 1 Replicate 2 Replicate 3 MEDIUM Replicate 1 Replicate 2 Replicate 3
MAX Replicate 1 Replicate 2 Replicate 3
CONTROL Replicate 1 Replicate 2 Replicate 3
G. oceanica
LOW Replicate 1 Replicate 2 Replicate 3
MEDIUM Replicate 1 Replicate 2 Replicate 3
MAX Replicate 1 Replicate 2 Replicate 3
DSL DSW DSL DSW DSL DSW
MEAN 10.48 8.55 10.31 8.25 10.52 8.50
MIN 7.99 6.15 7.18 5.61 8.67 6.82
MAX 12.50 10.35 12.65 10.20 11.84 9.78
MEDIAN 10.53 8.61 10.47 8.38 10.60 8.62
DSL DSW DSL DSW DSL DSW
MEAN 10.17 8.28 10.04 8.16 9.88 8.07
MIN 8.65 6.68 7.38 5.59 6.99 5.62
MAX 11.65 9.57 12.68 10.05 12.21 9.68
MEDIAN 10.29 8.18 10.05 8.23 9.91 8.12
DSL DSW DSL DSW DSL DSW
MEAN 10.70 8.63 10.33 8.40 10.37 8.47
MIN 9.14 6.98 8.35 6.56 8.47 6.95
MAX 12.16 10.25 12.66 10.65 12.63 10.60
MEDIAN 10.57 8.60 10.30 8.40 10.43 8.60
DSL DSW DSL DSW DSL DSW
MEAN 12.99 11.33 12.52 10.91 12.78 11.00
MIN 11.43 10.00 11.01 10.00 11.15 10.08
MAX 14.85 13.86 14.66 12.80 14.15 11.62
MEDIAN 12.83 11.11 12.43 10.69 12.76 10.94
DSL DSW DSL DSW DSL DSW
MEAN 1.90 1.17 1.86 1.16 1.93 1.21
MIN 2.29 1.37 2.18 1.42 2.24 1.46
MAX 2.29 1.37 2.18 1.42 2.24 1.46
MEDIAN 1.87 1.18 1.87 1.17 1.94 1.20
DSL DSW DSL DSW DSL DSW
MEAN 1.86 1.13 1.87 1.17 1.87 1.18
MIN 1.65 0.89 1.56 0.98 1.61 0.97
MAX 2.11 1.27 2.16 1.49 2.15 1.53
MEDIAN 1.87 1.14 1.86 1.15 1.86 1.17
DSL DSW DSL DSW DSL DSW
MEAN 1.90 1.18 1.91 1.19 1.90 1.19
MIN 1.59 1.00 1.62 1.01 1.62 1.02
MAX 2.26 1.53 2.12 1.43 2.16 1.38
MEDIAN 1.89 1.18 1.91 1.18 1.90 1.20
DSL DSW DSL DSW DSL DSW
MEAN 1.90 1.17 1.86 1.16 1.93 1.21
MAX Replicate 1 Replicate 2 Replicate 3
CONTROL Replicate 1 Replicate 2 Replicate 3 P. carterae
LOW Replicate 1 Replicate 2 Replicate 3
MEDIUM Replicate 1 Replicate 2 Replicate 3
MAX Replicate 1 Replicate 2 Replicate 3
CONTROL Replicate 1 Replicate 2 Replicate 3
LOW Replicate 1 Replicate 2 Replicate 3
MEDIUM Replicate 1 Replicate 2 Replicate 3