Seasonal and Diurnal Patterns in Humpback Whale (Megaptera novaeangliae) Acoustic Presence off Namibia
Saisonale und tägliche Muster der akustischen Präsenz von Buckelwalen (Megaptera novaeangliae) vor Namibia
Bachelorarbeit
Zur Erlangung des akademischen Grades des Bachelor of Science (B.Sc.) Im Fach Biologie
Lys Kronenberger Matrikelnummer: 4442497
1. Gutachter: Prof. Dr. Wilhelm Hagen 2. Gutachter: Prof. Dr. Claudio Richter
Bremen, den 05. August 2019
Fachbereich 2 (Biologie/ Chemie) Ocean Acoustics Lab
I
Table of Contents
Abstract ... II Zusammenfassung ... III
1 Introduction ... 1
2 Material and Methods ... 7
2.1 Data collection... 7
2.2 Data analysis ... 8
2.2.1 Generalized automated detection and classification system (LFDCS) ... 9
2.2.2 Acoustic context filter ... 10
2.2.3 Manual acoustic analysis... 12
2.2.4 Characterization of diurnal patterns ... 15
2.2.5 Statistical Procedure ... 15
3 Results ... 16
3.1 Acoustic presence of humpback whales... 16
3.2 Humpback whale songs off Namibia ... 19
3.2.1 Occurrence of humpback whale songs ... 19
3.2.2 Diurnal pattern ... 22
3.2.3 Song analysis ... 24
4 Discussion ... 29
4.1 Seasonal trend ... 29
4.1.1 Acoustic presence ... 29
4.1.2 Song categories ... 32
4.2 Diurnal rhythm ... 32
4.3 Song structure ... 33
4.5 Conclusion ... 36
5 References ... 38
Acknowledge ... 39
Appendix ... 40
II
Abstract
The eastern Atlantic sector of the South Atlantic Hemisphere is highly frequented by migrating humpback whales. One humpback whale population migrates between the west coast of South Africa and the Antarctic. During migration some individuals feed opportunistically off Namibia within the productive waters of the Benguela Upwelling System. Humpback whales produce a variety of social sounds and songs during migration, feeding and reproductive activities. Therefore, passive acoustic monitoring can be used to investigate temporal trends in the acoustic behavior of humpback whales.
This study investigates the seasonal patterns in the acoustic presence of humpback whales off Namibia and the diurnal rhythm of singing during their migration between west Africa and the Antarctic. The data were collected by two passive acoustic recorders off Namibia (20°57.80´ S 005°58.60´ E and 20°58.54´ S 005°59.07´ E) over a total period of 15 months from November 2011 to May 2013 with a recording pause from September 2012 until mid-November 2012. An additional qualitative song analysis on the basis of four good quality songs was conducted in order to compare song structures within and between seasons and to published data from other areas.
The results show a clear seasonal pattern in the acoustic presence with peak presences during the summer months succeeding the breeding seasons 2011 and 2012 as well as a strong peak during winter months preceding the breeding season 2012. A clear diurnal rhythm was not found in the data but tendencies towards higher singing activity during the night, dusk and the hours right before sunset were discernible. The song analysis revealed small similarities between songs from different years, seasons and populations.
The waters of Namibia seem to be an important migratory corridor for humpback whales in the South Atlantic and the data provided evidence for further activities of humpback whales in this area, as opportunistic feeding and reproduction.
Additionally, song transmission process indicates a wide-ranging connectedness among breeding stocks in the Southern Hemisphere.
III
Zusammenfassung
Der östliche Sektor des Südatlantiks ist stark besucht von migrierenden Buckelwalen. Eine Population migriert zwischen der Westküste Südafrikas und der Antarktis. Während der Migration fressen manche Individuen opportunistisch vor der Küste von Namibia in den produktiven Gewässern des Benguela- Auftriebsgebiet. Buckelwale produzieren eine Vielfalt von sozialen Tönen und Gesängen während ihrer Migration, dem Fressen und reproduktiven Aktivitäten.
Deshalb kann passive akustisches Monitoring angewendet werden, um zeitliche Tendenzen im akustischen Verhalten der Buckelwale zu untersuchen.
Diese Studie untersucht die saisonalen Muster der akustischen Präsenz von Buckelwalen vor Namibia und den Tagesrhythmus in den Gesängen während ihrer Migration zwischen Westafrika und der Antarktis. Die Daten wurden aufgenommen von zwei passive akustischen Rekordern vor Namibia (20°57.80´ S 005°58.60´ O und 20°58.54´ S 005°59.07´ O) über einen Zeitraum von insgesamt 15 Monaten vom November 2011 bis Mai 2013 mit einer Aufnahmepause von September 2012 bis Mitte November 2012. Eine zusätzliche qualitative Gesangsanalyse wurde anhand vier qualitativ hochwertiger Gesänge durchgeführt, um Gesangsstrukturen innerhalb und zwischen Saisons und mit veröffentlichten Daten aus anderen Regionen zu vergleichen.
Die Ergebnisse zeigen ein klares saisonales Muster in der akustischen Präsenz mit Höchstwerten im Sommer, nachfolgend der Brutsaison 2011 und 2012, sowie ein starker Höchstwert im Winter, vorhergehend der Brutsaison 2012. Ein klarer Tagesrhythmus wurde in den Daten nicht gefunden, aber Tendenzen zu einer höheren Gesangsaktivität in der Nacht, Dämmerung und in den Stunden kurz vor Sonnenaufgang waren erkennbar. Die Gesangsanalyse ergab geringe
Gemeinsamkeiten zwischen Gesängen aus unterschiedlichen Jahren, Saisons und Populationen.
Die Gewässer Namibias scheinen ein wichtiger Migrationskorridor für Buckelwale im Südatlantik zu sein. Die Daten lieferten Beweise für weitere Aktivitäten von Buckelwalen in diesem Gebiet, wie z.B. opportunistisches Fressen und
IV
Vermehrung. Darüber hinaus deuten Gesangsübertragungsprozesse auf eine weitreichende Verbundenheit der Brutbestände in der südlichen Hemisphäre hin.
1
1 Introduction
Humpback whales (Megaptera novaeangliae) are one of the most widely distributed baleen whale species and are known to conduct one of the longest mammalian migrations (Perrin et al., 2002). Migrations are thought to take place annually, in a seasonal cycle from productive high-latitude waters as summer feeding grounds to warm low-latitude areas in winter, where they breed and calve and alimentation is restricted to the summer months (Perrin et al., 2002). Summer feeding grounds and winter breeding grounds feature very distinct environmental conditions, because during summer humpback whales are found in shelf or coastal waters and in winter close to reef systems or islands (Perrin et al., 2002). These habitat preferences are affected by interactions between biological requirements, behavioral patterns and environmental conditions (Estes and Rosenbaum, 2003).
On the summer feeding grounds important prey is located in coastal or shelf areas which is probably why humpback whales are also found in these waters (Thiele et al., 2004). On the breeding grounds, it has been suggested that maternal females stay in shallower waters to prevent injury and harassment of their calves by sexually active males (Smultea 1994). However, the reason for the extreme length of the humpback whale migration is still unknown but it is presumed that migration is beneficial in terms maximizing energetic resources. During summer the most baleen whale species most likely visit high-latitude areas to take advantage of the high productivity. One hypothesis for the visit of tropical or subtropical areas in winter is that humpback whales gain thermodynamic advantages at low-latitude, warm winter grounds (Perrin et al., 2002). Another hypothesis is that migration focuses on the benefits for the newborn calves, for example because the risk of predation is reduced in low-latitude waters (Corkeron and Connor, 1999). Further, it has also been suggested that migration is an ancestral behavior left over from when the continents were closer and that therefore there was no strong selective pressure that favored breeding in low-latitude waters (Evans 1987). Until today, three additional alternative migratory strategies have been discovered in the migration of humpback whales: First, the “non-migratory” or “seasonally dispersing strategy” where individuals disperse seasonally within an area of bays or semi- closed seas (Pomilla et al., 2014; Geijer et al., 2016). Second, the “partial migration
2
strategy”, where humpback whales migrate seasonally but only in a limited range either in low or high latitudes (Calambokidis et al., 2001; Geijer et al., 2016). The third migratory strategy is “feeding during migration” (Geijer et al., 2016). The most humpback whale populations still seem to follow the traditional migration model (Geijer et al., 2016). All four migratory strategies probably evolved to maximize fitness in mostly seasonal environments. Multiple factors could affect the migration behavior of single individuals or groups of animals, as for example ecological or geographical factors. Ecological factors can be mortality costs which affects the migration distance and the co-evolution of predator and prey (Alerstam et al., 2003). Parasites and immunology are other ecological factors with similar affects (Alerstam et al., 2003). Bathymetric conditions, for example, are a geographical factor which also affects multiple ecological factors (Alerstam et al., 2003).
Probably, a complex combination of many reasons and factors influences the choice of a migratory strategy in humpback whales.
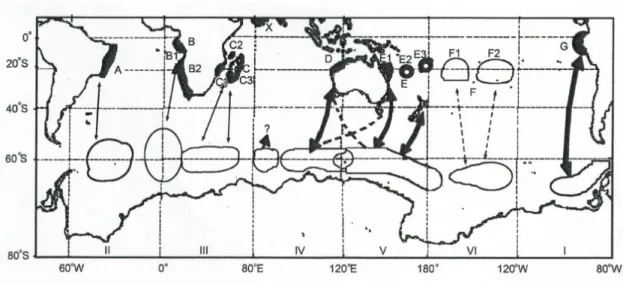
Specializations in migratory strategies in combination with maternally directed breeding site fidelity led to the genetic differentiation of humpback whale populations from different breeding grounds (Gales et al., 2011). Maternally directed breeding site fidelity means that humpback whales are “loyal” to their breeding grounds of their own birth. For feeding grounds, humpback whales from distinct breeding populations have developed certain preferences so that theoretical distribution maps could be generated (Gales et al., 2011; Baracho-Neto et al., 2012). The theoretical overall population structure of humpback whales in the Southern Hemisphere was established for the first time in a map by the International Whaling Commission (IWC) in 2005 (Figure 1; Gales et al., 2011). In the Southern Hemisphere there are at least eight different breeding stocks which migrated to six different Antarctic feeding areas (Gales et al., 2011). Humpback whales in the South Atlantic Ocean breed both off the east coast of South America and the west coast of South Africa (breeding stocks A and B, respectively). Genetic differentiation between these two breeding stocks as well as the breeding stock located at the east coast of South Africa (breeding stock C) is not as pronounced as in other areas, due to inter-breeding ground migrations, overlapping migratory
3
routes and geographical connectivity of preferred feeding areas (Gales et al., 2011). Humpback whales of the breeding stock B (Figure 1) migrate to the Weddell sea between areas II and III at 0° for summer feeding and the stock is sub- structured in the breeding stocks B1 and B2, because evidence of breeding was found off Gabon as well as Angola (Gales et al., 2011). Additionally, evidence of feeding off the Namibian coast was found in a recent study (De Rock et al., 2019).
It could therefore be presumed that humpback whales in the South Atlantic make use of an alternative summer feeding ground, located close to the productive Benguela Upwelling System, as well as migrating to Antarctic feeding areas. The waters off Namibia probably represent a key study area to understand the reasons for alternative migration strategies and could also provide information on inter- population migration processes.
Fig. 1 Map of the stock structure and migration routes of humpback whales in the southern hemisphere (Gales et al., 2011). Hypothetical connections are shown by dotted lines, thin lines between areas represent only a small number of sightings and thus a small number of documented connections by using photo identification, genetics, and satellite tracked whales or discovery marks.
The thick lines illustrate a large number of sightings. The areas indicate only rough boundaries.
To date, two studies were published that document humpback whale presence off Namibia. Visual observations confirmed a year-round presence of humpback
4
whales off Namibia in the years 2008 to 2016. A seasonal peak, which correlated with the traditional timing of annual migration, was determined from June to September, where depth was the most important variable for a suitable habitat (De Rock et al., 2019). Thomisch et al. (2019) found a local seasonality in the acoustic presence of humpback whales. Their acoustic presence could only be confirmed for the summer months and the winter months.
Humpback whales can effectively be studied with passive acoustic monitoring techniques, because both males and females, including young calves produce sounds in many behavioral contexts. All year-round, non-vocal sounds are produced, as flippering, lobtailing and breaching, with different functions, like communication, expression of excitement or annoyance, play and parasite removal (Perrin et al., 2002). For communication, humpback whales have different categories of social sounds with different communicative functions (Dunlop et al., 2008). Surface sounds, for example, which results from surface active behavior (i.e., pectoral fin slapping or breaching), are used for communication with individuals of other groups. These sounds mainly mark the position and size of the individual producing those sounds. Low-frequency vocalizations are thought to be produced for intra-group communication. Song-unit social calls are produced mostly by lone males for social integration, like joining existing groups (Dunlop et al, 2008). Low-frequency sounds and surface sounds are also produced within mother-calf pairs. Here the claves also produce broadband or tonal sound bouts.
These sounds are similar to such social sounds produced by adults but with a shorter duration and limited frequency range as in the adult whales (Zoidis et al., 2008).
Besides social calls, humpback whale males, also produce songs. Only sexually mature males sing. Male singers are usually found at depths between 10-30 m in a titled position with the head facing down, which probably improves sound transmission (Au et al., 2003). Singers are typically stationary, when they sing or travel slowly during singing. Most humpback whale males are solitary during singing. Singing mainly occurs on the winter breeding grounds, but also less frequently during migration and on the summer feeding grounds (Herman et al.,
5
2017). So far there are three possible functions of male songs: “attracting females to individual singers”, “determining or facilitating male-male interactions”, and
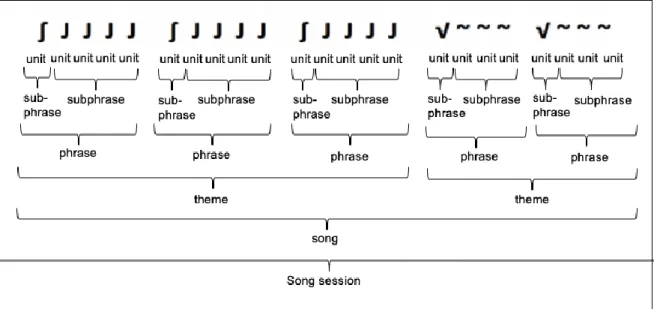
“attracting females to a male aggregation within the context of a lekking system”, all related to reproductive contexts (Herman et al., 2017). Therefore, it is presumed that singing is stimulated by a strong seasonal increase in testosterone (Herman et al., 2017). During migration songs are produced in combination with a great repertoire of social sounds (Dunlop et al., 2008). On the feeding grounds songs are produced only rarely (Garland et al., 2013). On the breeding grounds, the songs of humpback whale males are long and complex and can be described in a hierarchal structure, first published by Payne and McVay (1971). This structure is still used for classification by researchers until today. A song is composed of themes, which consist of repeated similar phrases. The shortest sound is called unit and consecutive units form a phrase. If songs are repeated with silent intervals in between, this is called a song session (Cholewiak et al., 2012) (Figure 2). The phrase structure of songs is flexible, so it can be modified both between and within individual songs. Payne and Payne (1985) discovered that humpback whales modified characteristics of phrases and themes of a song across and within years.
It is suspected that males change their song structure in order to be more attractive to females or more intimidating for other males. Usually individuals modify their songs by copying entire songs or fragments of a song from individuals of another breeding population (Mercado et al., 2003). There are three possible mechanisms, which could permit song transmission between populations of all ocean basins.
First, songs can be transmitted when migration between breeding populations occurs between seasons, second, when migratory exchange occurs within seasons, or third, when different breeding stocks share migratory routes and/or feeding grounds, where the eavesdropping of songs can take place (Payne and Guinee, 1983). Hence, song structure can be an indicator of interactions between different breeding stocks (Mercado et al., 2004).
The production of songs is often concentrated at specific hours of the day, namely during night-times hours, probably due to alternative activities, like feeding, during the day (Whitlow et al., 2000; Kowarski et al., 2017). On the breeding grounds, for
6
example, competitive groups are formed by multiple adult males as escorts for a single female. A characteristic of these groups are male-male competitions with a lot of physical interactions between males, for example head butting, ramming or tail slashing, as well as the production of low-frequency vocalizations (Helweg and Herman, 1994; Perrin et al., 2002; Dunlop et al., 2008). These groups are formed mainly during the day, because physical interactions are probably facilitated by use of sight (Helweg and Herman 1994). The production of different types of sound during distinct times of the year or day can be indicative of different types of habitat use. The knowledge of this seasonal and diurnal habitat use is of high importance for the effective development of management plans for areas of significance for humpback whales.
Fig. 2 Humpback whale song represented in a hierarchical structure. By Müller (2017), modified after Payne and McVay (1971).
The migratory behavior, distribution and habitat use of humpback whales is poorly understood until today, especially in the South Atlantic (Gales et al., 2011;
Thomisch et al., 2019; De Rock et al., 2019). According to the IWC (2005), the waters off Namibia are a migration corridor for humpback whales (Gales et al.,
7
2011). To get a better understanding of this area and the use of this area by humpback whales, passive acoustic monitoring can used to collect information on vocalizing animals year-round (i.e., Sirovic et al., 2009; Rekdahl et al., 2018;
Thomisch et al., 2019; De Rock et al., 2019). With the evaluation of long-term acoustic data, the following research questions can be investigated during this study: 1. Are there seasonal patterns of humpback whale acoustic presence off Namibia? 2. Do humpback whales show a diurnal singing rhythm during their migration between Angola/Gabon and the Antarctic? 3. Does the analysis of song structure in the recordings from off Namibia reveal possible interactions among different breeding stocks? On the basis of the other studies presented above we expect to find both a seasonal pattern and a diurnal rhythm in the acoustic presence of humpback whales off Namibia. In terms of seasonality, we expect that acoustic presence is mainly detectable in the months before and after the breeding season, when humpback whales are migrating through the waters off Namibia according to the traditional migration model. In terms of a diurnal pattern we expect to find more songs during night and very few songs during the day. On the basis of the results from genetic mixing studies we also expect to find similar song elements both in the population off Namibia and in populations of other breeding stocks due to song transmission.
2 Material and Methods
2.1 Data collection
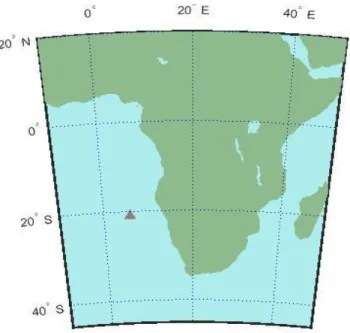
Two passive acoustic recorders were evaluated during this study. The first passive acoustic recorder SV1008 was located at 20°57.80´ S and 005°58.60´ E (Figure 3).
Recordings started on 25 November 2011 and ended on 25 August 2012. The entire recording period lasted 274 days. At the location of the recorder the water depth was 4240 m and the depth of the recorder deployment was 741 m. The recording duration was 10 min with a continuous recording scheme. The amplification gain was 48 dB with a resolution of 24 bit. The second passive acoustic recorder SV1019 was located at 20°58.54´ S and 005°59.07´ E (Figure 3).
8
Recordings started on 21 November 2012 and ended on 30 May 2013. The entire recording period lasted 199 days. At the location of the recorder the water depth was 4235m and the depth of deployment was 736m. The recording duration was 5 min with a continuous recording scheme. The amplification gain was 30 dB with a resolution of 24 bit. The sampling frequency of both passive acoustic recorders was 5.333 kHz, so that frequencies up to 2.667 kHz could be analyzed. The two passive acoustic recorders are treated as one during this evaluation. This results in a recording pause from August 26 to November 20, 2011.
Fig. 3 Mean position of the passive acoustic recorders SV1008 and SV1019 in the South Atlantic Ocean off Namibia. The grey triangle shows the mean position (20°58.36´S and 005°59.03´E) of the two passive acoustic recorders.
2.2 Data analysis
The acoustic data were processed by a combination of a generalized automated detection and classification system (LFDCS) for baleen whales and a custom- made acoustic context filter. RAVEN PRO 1.5 (Cornell Lab of Ornithology) was used by the human analyst to create the spectrograms of sound files and post-
9
process the detected hours of acoustic data. Only the even hours of the available data (hours 0, 2, 4, 6, 8, 10, 12, 14, 16, 18, 20, 22) were analyzed due to the time available for the manual post-processing. The tables and figures were made with Microsoft Excel 2010, Matlab R2018b and R (The R Project for Statistical Computing).
2.2.1 Generalized automated detection and classification system (LFDCS) The generalized automated detection and classification system (LFDCS) was developed by Baumgartner et al. (2012) to identify low-frequency baleen whale calls more efficiently and accurately. The program creates spectrograms which are smoothed by a Gaussian smoothing kernel. Noise by ships or other broadband noise is reduced by subtracting a long-duration mean from each frequency band.
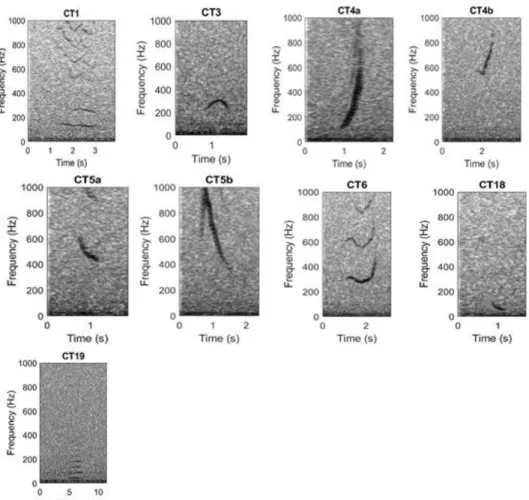
Tonal sounds can then be detected by creating so-called pitch tracks. Pitch tracks are connected time-frequency coordinates in the spectrogram, of which the amplitude exceeds a predefined threshold. The quadratic discriminant function analysis (QDFA) is then used for the classification of all detected sounds. Start frequency, end frequency, frequency range, duration, slope of the frequency variation, minimum frequency and maximum frequency are characteristics which are used as attributes for classification. The basis for this classification analysis is a collection of several exemplars of both humpback whale call types and call types of other vocal species, termed the call library (Figures 4 and 5). To classify the detected sounds correctly the maximum relative posterior probability and the Mahalanobis distance (MD) are used. Additionally, a signal-to-noise ratio (SNR) can be used to filter detection results. In this study, only humpback whale detections with a Mahalanobis distance of 2.5 or lower and with a SNR of 13 or higher were considered. The call library occupied during this study contains seven humpback whale call types (Figure 4) and seven call types of other species, which potentially vocalize in the study area (Figure 5). Each call type contains between 139 and 332 exemplars. The exemplars of humpback whale call types were chosen from data recorded at different locations in the Atlantic sector of the Southern Ocean in 2011 and 2013.
10 2.2.2 Acoustic context filter
In the following, humpback whale acoustic presence was evaluated on an hourly basis so that the acoustic context in which a presumable humpback whale vocalization was detected could be taken into account. After the detection and classification process an acoustic context filter was developed and applied to prevent a high number of false positive hours, due to the confusion of similar vocalizations from different species. Two conditions form the basis of the acoustic context filter: 1. When within a relevant hour the number of good quality detections (i.e. MD ≤ 2 and SNR ≥ 14) of another species call type, which is similar to a humpback whale call type, passes an hourly call rate threshold (i.e., 4 calls per hour), and 2. When in the same hour the number of good quality humpback whale call detection (i.e. MD ≤ 2 and SNR ≥ 14) is lower than an hourly call rate threshold (i.e., 6 calls per hour). If both conditions are fulfilled for the same recording hour, all humpback whale call type detections, which are similar to the relevant other species call types, were deleted from the relevant hour. As a result, false positive hours due to the presence of other species’ call types are reduced. To further reduce false positive hours, caused by single false detections, only hours with at least 10 humpback whale call detections were accepted as humpback whale positive hours.
11
Fig. 4 Humpback whale call types of the call library. CT1: call type 1, CT3: call type 3, CT4a &
CT4b: call type 4, CT5a & CT5b: call type 5, CT6: call type 6, CT18: call type 18, CT19: call type 19.
12
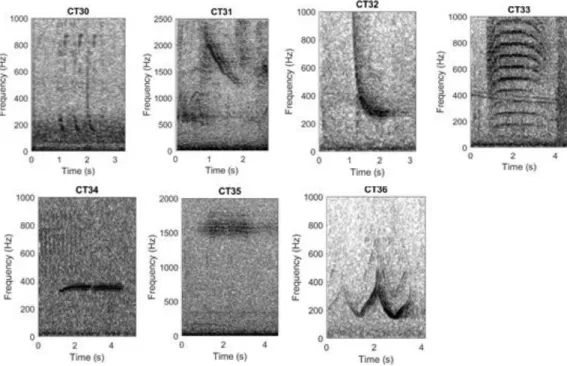
Fig. 5 Call library call types of the other species. CT30: Bioduck, Minke whale; CT31: Excited Downsweep, Killer whale; CT32: Long Downsweep, Weddell seal; CT33: Maon, Crabeater seal;
CT34: Low trill, Leopard seal; CT35: High trill, Leopard seal; CT36: Sirene call, Ross seal.
2.2.3 Manual acoustic analysis
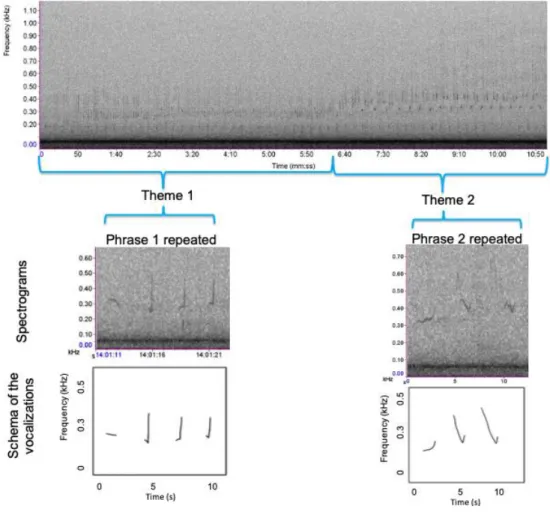
The manual post-processing of all humpback whale positive hours was conducted by one human analyst. Spectrograms (the visualization of temporally concatenated frequency spectra) of these hours were created in Raven Pro 1.5 using a Hann window with a window size of 1025 samples, 80% overlap and a DFT (discrete Fourier transform) size of 2048 samples. Spectrograms were scanned for humpback whale vocalizations by viewing 60 s windows from 0 to 1.80 kHz. All spectrograms of every detected even hour with presumed presence of humpback whales were verified individually for actual presence of humpback whale vocalizations by the analyst. The results of this post-processing were registered in a table and encountered humpback whale sounds were differentiated into social calls and songs. Humpback whale social calls are bouts of vocalizations without a clear pattern (Figure 6). Humpback whale songs were further divided into two song categories: the preliminary song category (2) and the complex song category (1) (Figures 7 and 8). If the humpback whale sounds form at least three repeated,
13
similar phrases, this was classified as song category 2. Humpback whale sounds that are organized in at least two different themes were classified as song category 1. Additionally, the quality of the humpback whale calls was documented and registered in this table. The quality was divided into three levels: 1 for good quality, 2 for medium quality and 3 for bad quality.
Fig.6 Spectrogram showing different social calls of humpback whales. The call marked with *1 belongs to the call type category 6, the call marked with *2 belongs to the call type category 5.
*1
*2
14
Fig.7 Spectrogram showing an example of song category 2 of humpback whales consisting of one phrase type with three repetitions.
Fig.8 Spectrogram of an example for song category 1of humpback whales. *1 and *2 mark two different themes of the song.
*1 *2
15 2.2.4 Characterization of diurnal patterns
To check for the presence of a diurnal rhythm in the humpback whale acoustic presence one of four distinct light periods was assigned to each recording hour.
According to the time zone at the location of the passive acoustic recorder, each recording hour has been assigned to one of the following four light periods: nautical dawn (the hours between the beginning of the sunrise and the end of dawn), day (the hours between the end of dawn and the beginning of the sunset), nautical dusk (the hours from the beginning of the sunset until the end of dusk) and night (the hours after the end of dusk and before the beginning of the sunrise). The R
‘base’ package (The R Project for Statistical Computing) was used to conduct this assignment automatically (Appendix 1.1). The website of the Astronomical Applications Department of the U.S. Naval Observatory was used to retrieve the sunrise and sunset times of the years 2011, 2012 and 2013 at the location of the passive acoustic recorder (Astronomical Applications Department, 2019;
https://aa.usno.navy.mil/data/docs/RS_OneYear.php). For the calculation of the nautical twilight times the R function ‘getSunlightTimes’ of the R ‘suncalc’ package
(The R Project for Statistical Computing, 2019;
https://www.aa.quae.nl/en/reken/zonpositie.html) was used (Appendix 1.2).
Matlab R2018b was used for the creation of graphic representations of the hourly acoustic presence of humpback whales (Appendix 2.1), the sunrise and sunset times and the nautical twilight times throughout the year (Appendix 2.1). For an improved graphic representation, the hours of the sunrise and sunset times as well as the hours of the dawn and dusk limits were rounded with the R ‘base’ package (The R Project for Statistical Computing) applying the following rule: If more than half of the relevant hour has elapsed at the time of sunset, sunrise, dawn or dusk, the time was rounded up to the next following hour.
2.2.5 Statistical Procedure
In order to test for potential significant differences among humpback whale acoustic presence in the distinct light periods, first the distributions of data were inspected. Due to a strong bias towards zero caused by many months without
16
humpback whale acoustic presence, the data for statistic comparison were reduced to the four months with the highest acoustic presence of humpback whales: two months in summer succeeding breeding season (November and December) and two months in winter preceding breeding season (July and August). Further, the hours with humpback whale acoustic presence and songs in each light period were divided by the total number of hours of a respective light period to account for duration differences among the different light periods. The results of the normalization were used to calculate the mean and standard deviation of humpback whale hourly acoustic and song presence for each light period.
Due to the fact that the data of the hourly acoustic presence and of the hourly presence of the two song categories were not normally distributed (Appendix 2.3 to Appendix 2.5), a non-parametric test was used. The Kruskal-Wallis test was separately performed on humpback whale hourly acoustic presence and on the hourly presence of both song categories to test the null hypothesis that the adjusted number of hours with the respective humpback whale sound categories were equal in all light periods. Therefore, the R ‘stats’ package (The R Project for Statistical Computing) was used (Appendix 1.3). As post-hoc analysis, the Dunn- Bonferroni Tests of Multiple Comparison Using Rank Sums should determine if certain light periods differ significantly in the number of adjusted hours of all sound categories. For this statistic evaluation the R ‘dunn.test’ package (The R Project for Statistical Computing) was used (Appendix 1.4).
3 Results
3.1 Acoustic presence of humpback whales
In 2011, the acoustic presence of humpback whales was verified from November 26 until December 7, from December 13 until December 21, and from December 25 continuously until the end of the year, except for December 27. In January 2012, humpback whale calls were only identified, on January 2 and 7. In February
17
and March 2012, no humpback whale acoustic presence was verified and in April, only on April 13. The period without humpback whale acoustic presence lasted until June 2. After this date, humpback whale acoustic presence was observed in irregular intervals. From July 1 to 6 and from July 17 to August 4 humpback whale calls were continuously present, except for a few single days. Also, from August 7 to August 25, the acoustic presence of humpback whales was verified. At the beginning of the new recording season humpback whale calls were identified again from December 1 until December 22 with a break between December 2 and December 10. In 2013, humpback whale acoustic presence was only detected on January 10.
A seasonal trend can be seen in the occurrence of humpback whale calls off the Namibian coast in the years 2011 and 2012. The number of hours with humpback whale calls increased with the beginning of the summer season, succeeding breeding season (November to February) in November and with the beginning of the winter season, preceding breeding season (June to August) in June. The peak time of humpback whale calling activity was in the middle of the summer season in December 2011 and at the end of the winter season in August 2012. During the summer season, humpback whale acoustic presence declined strongly in January 2012 and there were no humpback whale calls verified at the end of the summer season. At the end of the winter season in the year 2012, the acoustic presence or absence of humpback whales cannot be confirmed because of the recording pause. In summer 2012/13 a weak seasonal trend is noticeable because the detected hours in this season were only approximately five percent of the total detected hours (in comparison 58.4 % of the total hours in the previous season).
The peak time of acoustic presence in 2012/13 was again in December and the humpback whale acoustic presence declined strongly in January, but no acoustic presence was determined in November. No conclusions can be drawn about the winter season in 2013, because the recording ended at the beginning of this season (Figure 9).
18
Fig.9 Monthly verified acoustic presence of humpback whales off Namibia. The recording period lasted 19 months from 25 November 2011 to 30May 2013 with a recording pause from 26August 2012 to 11November 2012, shown by the grey bars.
Altogether, 287 hours of humpback whale acoustic presence were verified. The peak times of acoustic presence of humpback whales showed a weak hourly trend.
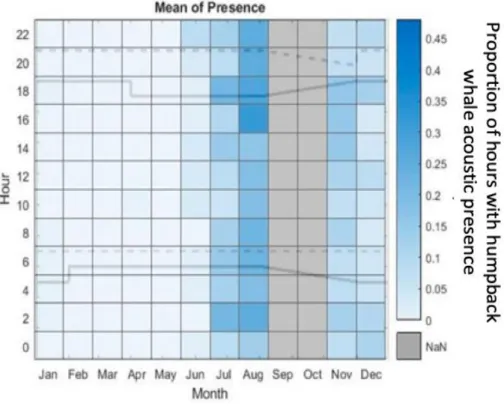
In August, most of the acoustic activity of humpback whales was verified for the hours 16:00 until 22:00. Also, in August, an increased humpback whale acoustic presence was verified for 02:00. In July, an increased acoustic presence was verified for the morning and evening hours as well as at night. In November an increased acoustic presence from 14:00 to 18:00 is recognizable. The numerous call detections in July and August show that the increased humpback whale acoustic presence occurred at night, dusk and in the hour before sunset (Figure 10).
19
Fig. 10 Diurnal proportion of hours with humpback whale acoustic presence throughout the year off Namibia. The original acoustic data is from November 2011 to August 2012 and from November 2012 to May 2013. The grey bars in September and October show the paused recording period from August 26 to November 11 in 2012. The solid lines display the times of the sunrise and sunset.
The dashed lines display the end of dusk and the end of dawn. NaN: no passive acoustic data was available.
3.2 Humpback whale songs off Namibia
3.2.1 Occurrence of humpback whale songs
Humpback whale songs were identified in the data with a clear seasonal trend. In July and August, the winter season, preceding the breeding season, many hours with songs of song category 2 were identified. In July, 31 hours with songs of song category 2 were verified and in August 52 of the detected hours were verified to contain song category 2. In November and December, the summer season succeeding the breeding season, less hours with humpback whale songs were verified. In November only five hours and in December, only 16 hours were identified as hours with song category 2. In the remaining months there were
20
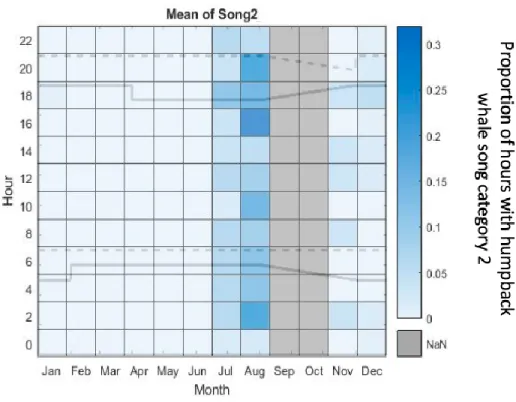
almost no verifications of song category 2. In total, 104 hours with songs of song category 2 were verified. Due to the low number of verified hours with song category 2 in November and December, no exact conclusion can be drawn about the existence of a diurnal pattern of song category 2 in this time period. In July, the most songs of song category 2 were verified for the hour 18:00. In August, an hourly trend is recognizable because the most songs of song category 2 were verified between 16:00 and 20:00, as well as for the hour 02:00. This showed that the most songs of song category 2 were verified during night time, dusk time and right before sunset (Figure 11).
Fig. 11 Diurnal proportion of hours with humpback whale song category 2 throughout the year off Namibia. The original acoustic data is from November 2011 to August 2012 and from November 2012 to May 2013. The grey bars in September and October show the paused recording period from August 26 to November 11 in 2012. The solid lines display the times of the sunrise and sunset.
The dashed lines display the end of dusk and the end of dawn. NaN: no passive acoustic data was available.
21
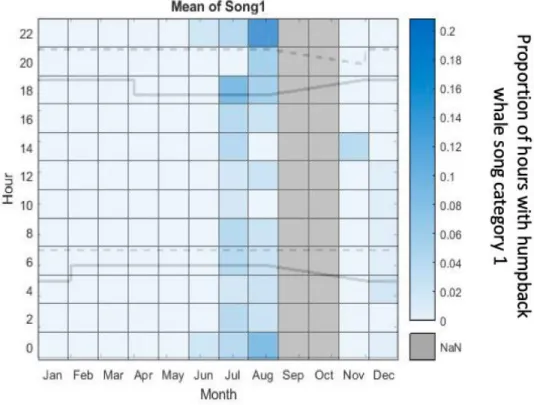
In total, only 47 hours with song category 1 were identified. The most discoveries of songs, which were categorized as song category 1, were in July 2012 with 21 verified hours and in August 2012 with 18 verified hours. In November and December, hours with song category 1 were only rarley verified. Overall in these two months only eight hours of songs, which wre classified as song category 1, were identified. Additionally, a diurnal pattern in the production of song category 1 could be recognizaed in the months July and August. In July, the most complex songs were discovered at the hour 18:00. In August the peak time of verified songs of song category 1 were at the hour 22:00. In the hour 00:00 vertifications of song category 1 were also prominent. Consequently, a hourly trend in the production of complex songs by humpback whales is identifiable and the most songs of song category 1 were identified at night and dusk (Figure 12).
22
Fig. 12 Diurnal proportion of hours with humpback whale song category 1 throughout the year off Namibia. The original acoustic data is from November 2011 to August 2012 and from November 2012 to May 2013. The grey bars in September and October show the paused recording period from August 26 to November 11 in 2012. The solid lines display the times of the sunrise and sunset.
The dashed lines display the end of dusk and the end of dawn. NaN: no passive acoustic data was available.
3.2.2 Diurnal pattern
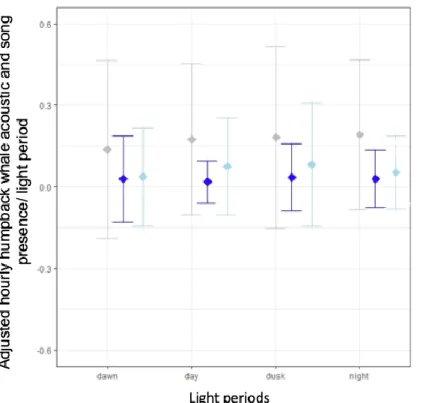
The null hypothesis that the adjusted number of hours with the respective humpback whale calls was constant during all light periods could be rejected for acoustic presence and song category 2 but not for song category 1. This indicated that the verification of humpback whale acoustic presence and song category 2 depended on the light periods (Kruskal-Wallis, presence: X2 = 13.824, df = 3, p = 0.003; song category 1: X2 = 3.050, df = 3, p = 0.384; song category 2: X2 = 14.631, df = 3, p = 0.002). The adjusted mean hours of acoustic presence were highest during night (0.1920.274 h/light period) and lowest during dawn (0.1380.326 h/light period) with dusk and day as intermediate values (0.1820.335 h/light period and 0.1760.278 h/light period). During dusk the
23
adjusted mean hours of song category 1 were the highest (0.0350.124 h/light period) and during day the lowest (0.0190.078 h/light period) with intermediate values during dawn and night (0.0300.159 h/light period and 0.0300.106 h/light period). The adjusted mean hours of song category 2 were the highest during dusk (0.0830.226 h/light period) and lowest during dawn (0.0370.180) with intermediate values during day and night (0.0760.177 h/light period and 0.0540.134 h/light period) (Figure 17). The results of the Dunn-Bonferroni Test for the acoustic presence indicated that only dawn differed significantly from day and night (p = 0.0134 and p = 0.0017) but not from dusk (p = 0.3102). For song category 2 the results of Dunn-Bonferroni Test pointed out that dawn differed significantly from all other light periods (day: p = 0.007, dusk: p = 0.0369, night: p = 0.0236). The other light periods did not differ significantly from each other for both acoustic presence and song category 2. From these results and the raw adjusted mean hours, it became clear that the lowest humpback whale acoustic presence and number of songs of song category 2 were identified during dawn.
24
Fig. 17 Adjusted number of hours with humpback whale acoustic presence and the two song categories with mean and standard deviation during the four light periods: dawn (presence: SD =
0.0326, song category 1: SD= 0.159, song category 2: SD = 0.180), day (presence: SD =
0.278, song category 1: SD= 0.078 song category 2: SD = 0.177), dusk (presence: SD =
0.335, song category 1: SD= 0.124, song category 2: SD = 0.226) and night (presence: SD =
0.274, song category 1: SD= 0.106, song category 2: SD = 0.134).a
3.2.3 Song analysis
Off Namibia, 151 songs were identified in total over the recording period from November 2011 to May 2013 with a recording pause from August 26 until November 11, 2012. Four of these songs were analyzed in more detail. All of these four songs were evaluated as good quality and classified as song category 1. The first two songs were identified in the summer season, succeeding the breeding season of 2011, on November 28 and 29. In the winter season, preceding the breeding season 2012, the other two songs were identified on June 3 and August 7. Unfortunately, in the summer season 2012, no songs of song category 1 with good quality were identified which could have been part of more detailed analyses.
25
The first song (Song 1, Fig.13) detected on November 28, 2011 began at 14:01:11 and ended at 14:12:11. The duration of this song was 11min. It was structured into two different themes. The first theme (T1) was constructed of 25 repetitions of phrase 1 (P1). The second theme (T2) consisted of 15 repetitions of phrase 2 (P2).
The song session lasted only for this one song.
Fig. 13 Hierarchical structure of Song 1.
The second song (Song 2, Figure 14) lasted approximately 1min, from 02:53:29 to 02:54:24, and was identified on November 29, 2011. The song consisted of two different themes, T1 and theme 3 (T3). T1 was composed of one repetition of P1 and three repetitions of phrase 3 (P3) formed T3. The song session of Song 2
26
lasted until 03:12:09, with a duration of 19min, and included three repetitions of Song 2.
Fig. 14 Hierarchical structure of Song 2.
Song 3 the third song to be analyzed, was identified on June 3, 2012. This song lasted 2min and 30sec, from 00:28:17 until 00:30:47 (Figure 15). It consisted of three themes. The first theme (T7) included three repetition of phrase 7 (P7). T3, the second theme of this song, contained two repetitions of P3. The five repetitions of phrase 4 (P4) formed the third theme of this song, theme 4 (T4). The song session of Song 3 lasted 10 min, until 00:38:07, and included three repetitions of Song 3.
27 Fig. 15 Hierarchical structure of Song 3.
The fourth song (Song 4, Figure 16) was identified on August 7, 2012 and lasted 5 min, from 20:31:47 until 20:36:57. This song included three themes. The number of repetitions of the different phrases varied within the song session of Song 4. The three to five repetitions of P4 created the first theme, T4. The second theme was theme 5 (T5) which consisted of 16-55 repetitions of phrase 5 (P5). The last theme 6 (T6) included one to three repetitions of phrase 6 (P6). The song session of this
28
song ended at 22:13:42, with a duration of one hour and 45min, and consisted of 12 repetitions of Song 4.
Fig. 16 Hierarchical structure of Song 4.
The two songs of the summer season 2011, Song 1 and Song 2, consisted both of two themes and included the same first theme, T1. Only Song 2 was repeated as a song session. In contrast, the phrases of the different themes of Song 1 were
29
repeated much more frequently. In the winter season 2012 both songs, Song 3 and Song 4, consisted of three different themes and included both T4 (in Song 4 as the first theme and in Song 3 as the last theme, respectively). Comparing the two seasons it was recognized that Song 3, in winter 2012, included the same theme, T3, as Song 2 in the summer of 2011. Further similarities between the songs of the different seasons were not determined.
4 Discussion
The evaluation of the acoustic data from November 2011 to March 2013 off Namibia revealed both seasonal trends as well as diurnal trends in the acoustic presence of humpback whales and the production of the different song categories.
Additionally, variabilities in song structure were determined within and between seasons.
4.1 Seasonal trend
4.1.1 Acoustic presence
The observed seasonality of the humpback whale acoustic presence may have resulted from the annual migration of humpback whales. All four distinct migration strategies could explain the pattern of acoustic presence which has been identified in this study. Both the “non-migratory” and the “partial migration” strategy are the least likely explanations for the patterns of acoustic presence observed off Namibia because humpback whales were not acoustically present throughout the whole year. However, individual humpback whales could still be physically present although their acoustic presence could not be detected (Geijer et al., 2016; De Rock et al., 2019). The reason for missing detections could, for example, be that animals did not produced sounds throughout the whole year. The strategy “feeding during migration” could be a likely explanation for the patterns of acoustic presence observed off Namibia because of the high productivity of the Benguela upwelling system (Gales et al., 2011; Geijer et al., 2016). Humpback whales could feed opportunistically in the productive waters of the migration corridor on their way to
30
the breeding grounds off Angola/Gabon or feeding grounds in high-latitude waters in the Antarctic, respectively (Thomisch et al., 2019). Especially the high number of verified humpback whale positive hours during summer succeeding the breeding season (November to January, as well as the single day in April) could be explained by this alternative strategy, because individual humpback whales might decide to feed during their southward migration if opportunities are presented. The recorded vocalizations could also be produced by humpback whales which followed the traditional migration model. The fact that the acoustic presence of humpback whales could only be confirmed for a temporary restricted period in the years studied supports the assumption of migratory movements through the area.
This can also be seen in the increase of hours with acoustic presence at the beginning of each season and the respective decrease of hours at the end of each season. These intra-seasonal variations in the number of verified hours with acoustic presence could be explained by inter-individual variations in the timing of migrations. The time of migration in humpback whales is affected by sex, reproductive status and age and the observed temporal variations in acoustic presence could therefore reflect the differential migrations of groups with different reproductive stages (Craig et al., 2003). For example, sexually focused male humpback whales which migrated at a later time to the high-latitude feeding grounds may have been the reason for the few detected hours of acoustic presence in the middle of the summer season (Kowarski et al., 2017). The low number of verified hours with humpback whale acoustic presence in April 2012 could be explained by single individuals, probably males, which departed early in the year for their migration northwards. The increase of acoustic presence in the winter season preceding breeding season 2012 could be caused by migrating humpback whales in different life stages as they returned to Angola/Gabon for breeding or only for overwintering (Thomisch et al., 2019). The recording pause in September and October 2012 made it difficult to evaluate the acoustic presence and thus the migration behavior of humpback whales in late winter. No comparison could be made to another winter season, as the recording ended in May 2013.
31
A comparison of the acoustic presence of humpback whales in this study with the results of Thomisch et al. (2019), who evaluated the data of the same passive acoustic recorders off Namibia, indicates differences in the observed seasonal patterns. On the one hand, in November 2012 and May 2013 acoustic presence was detected by Thomisch et al. (2019) but no acoustic presence was verified in this study. Subjectivity of human analysts could be one cause for the acoustic presence found only by Thomisch et al. (2019). For example, unexperienced analysts might have confounded killer whale (Orcinus orca) vocalizations as humpback whale calls and this way false positive days of acoustic presence were introduced in the results. A second possibility could be that some humpback whale vocalizations were not found during this study because of the signal-to-noise ratio (SNR) filter in the detector settings. When sounds were very faint, these were filtered out by the automatic detector. Due to the SNR filter and factors affecting classification of sounds, the automatic detector has an error rate of 20%, i.e. 20%
of the recorded hours with humpback whale vocalizations are missed during application of the automatic detector. Additionally, in this study only every second hour was evaluated for the acoustic presence of humpback whales. That means the humpback whale vocalizations found by Thomisch et al. (2019) could have been included in the 20% of false negative hours caused by the detector or simply in the 50% of hours, which were systematically excluded from the analysis. On the other hand, Thomisch et al. (2019) did not find acoustic presence of humpback whales in November 2011 and April 2012, whereas in this study the acoustic presence was confirmed for some days of these months. One possible explanation for this could be the higher temporal analysis resolution of the spectrograms used during this study, which led to the advantage that humpback whale sounds could be verified with a higher certainty. The sounds only identified in this study could, however, also be produced by southern right whales (Eubalaena australis) which could also vocalize in the waters off Namibia. This is rather unlikely because sightings of this species are also rare in this area (i.e., only four percent of the sightings off Namibia by De Rock et al. (2019)).
32 4.1.2 Song categories
The potential behavioral patterns of humpback whales during migration were studied by the differentiation of two categories of male songs and general social call bouts. All call categories showed a similar seasonal trend, with the song categories occurring more often in winter preceding the breeding season than in summer succeeding the breeding season. The singing behavior in winter could have been influenced by the high levels of testosterone at the beginning of the breeding season. In summer, song category 1 was found even less than song category 2. The low number of identified songs, especially complex songs, in summer could also be correlated with a decrease in testosterone level after the end of breeding season. For songbirds, studies confirmed that testosterone plays a major role in seasonal song production levels (Marler et al., 1988). Similarly, the seasonal trend of humpback whale songs was suspected to be stimulated by the testosterone level (Clark and Clapham, 2004). Singing in early summer, like off Namibia in November and December, could be related to a few males which are low-cost opportunistic reproducers soliciting females which not conceived during winter. The increasing level of testosterone at the beginning of the breeding season could also have caused an increase in reproductive activities, as singing as well as the forming of competitive groups (Clark and Clapham, 2004). This in turn be the cause for the development of a weak diurnal rhythm in song production during the northward migration.
4.2 Diurnal rhythm
A weak diurnal pattern was recognizable both in the production of song and social calls. The acoustic presence of humpback whales was the lowest during dawn which could be related to an efficient allocation of energy to different types of behaviors during the day. The mutual resting in the morning hours, from the beginning of daylight in humpback whales could, for example, explain why there were the least vocalizations during dawn off Namibia (Helweg et al., 1994;
Friedlaender et al., 2013). From the song categories, only song category 2 depended significantly on the light periods. In song category 1, no significant
33
difference was found among the four light periods. That only 47 songs of song category 1 were identified during this study, could have affected the statistic test and the inclusion of more data would probably lead to a significant test result. Song production was low during dawn and higher during the night, dusk and right before sunset, which contradicts the hypothesis that songs occur the most at night. The hypothesis was based on a study from the waters off western Maui where the sound pressure level was higher at night than during the day and on a study off eastern Canada where more songs were produced at night and during sunset than during the day (Whitlow et al., 2000; Kowarski et al., 2017). In contrast, in another study from the Gulf of Maine songs were detected uniformly throughout the entire diurnal cycle (Huang et al., 2016). On the breeding grounds, humpback whales accumulate in relatively small areas so that visual or tactile communication might be more effective during daylight hours (Helweg and Herman, 1994). In contrast, humpback whales migrate mostly as single individuals with great distance between each other. Therefore, singing throughout the day off Namibia, as a migratory corridor, could be the most effective way of communication at these great distances (Helweg et al., 1992). The productive waters off Namibia might also be used as opportunistic feeding grounds. Feeding could occur opportunistically throughout the day because humpback whales have adapted to the behavior of their variable prey species (i.e., sand lance (Ammodytes spp.); Friedlaender et al., 2009) with different feeding strategies. Due to the high variability of different prey species in the Benguela upwelling region humpback whales are not restricted to certain feeding times which would allow singing during the breaks from feeding (Friedlaender et al., 2009). At the hour 16:00 a break-in of the frequency of feeding events was observed in a study from Antarctic feeding ground which lead to a higher rate of song production during this hour, reason for this could be the adaption to the daily migration of their prey (Friedlaender et al., 2009).
4.3 Song structure
In comparison between the songs of the different seasons in the years 2011 and 2012, there were similarities between and within the seasons and years. Two of
34
the six found units, call type 1 and 4, were “stable” units which occurred in all four songs. “Stable” units are call types which do not differ between years or populations (Rekdahl et al., 2013; Garland et al., 2013). The “stable” units of call type 1 and 4 were also identified on the Greenwich meridian in the Antarctic, even as the same theme, T1 (project report (PM4) by Kronenberger, 2019). Call type 1 was also detected off Angola, east Australian (Rekdahl et al., 2017), Brazil and Gabon (Darling et al., 2005). Call type 4 was also found off east Australian and Angola (Rekdahl et al., 2017). Song exchange among populations can arise from migration of males between breeding stocks within a season (Payne and Guinee, 1983). For example, individuals of the breeding stocks A and C could have migrated to breeding stock B so that songs were adapted, and thus similar song structures arose. Migrations among these breeding stocks are likely because the stocks A and B are genetically similar as well as the breeding stocks B and C (Gales et al., 2011). Song copying could also occur on common feeding grounds, or during migration. Individuals of two breeding areas (B1 and B2) used the waters off Namibia as a migration corridor which could explain the existence of at least two different song types in the summer 2011 and winter 2012 in the study area.
Song transmissions between the different (sub-)populations using the waters off Namibia could happen, for example, during migration on the tight route around the narrow tip of Africa. Alternatively, song transmission could take place during feeding, either on a temporary feeding ground in the Benguela upwelling region or when sharing the same feeding grounds II and III in the Southern Ocean. Due to genetic mixing which was discovered by the IWC in these feeding areas, song transmission among various breeding stocks or sub-stocks on these Antarctic feeding grounds is of high probability (Payne and Guinee, 1983; Gales et al., 2011). These song adoption processes could be one reason for the occurrence of the “stable” units in all songs and of T3 in both years. Similar processes probably also caused that “stable” units could be found on the feeding and breeding grounds connected by the Namibian migration corridor. Further, the essential social function of calls, like the “stable” call type 4, in inter- and intra-group communication could be an important reason for the persistent occurrence of these call types in songs of different seasons and populations (Dunlop et al., 2008). The song similarities with
35
populations of east Australia and Brazil indicate a wide-ranging connectedness between the populations of the Southern Hemisphere (Rekdahl et al., 2018). These similarities in song structure of humpback whales from different ocean basins could be introduced mainly by juvenile males which tend to experiment more with different song fragments (Perrin et al., 2002).
Within one season, small differences in the songs of individuals may be caused by the modification of song characteristics through eavesdropping because the phrase structure is flexible (Mercado et al., 2004). Song 1 and 2 were structurally very similar with P1 being a common phrase and the second themes of these songs being different, but with the first units of the phrases being the same. The possibility exists that these two songs were produced by the same humpback whale, especially because the songs were only 12 hours apart. Alternatively, both songs were slight individual modifications of the same song type. Also, Song 3 and 4 included one common theme, T4 and three of six units were the same, but compared to the previous season, the differences between Song 3 and 4 were more prominent than between Song 1 and 2. This differences in variability could be caused by the fact that in the summer succeeding the breeding season, males of one breeding stock should be singing the fully developed “trend” song of the past season (Noad et al., 2000). In contrast, it is expected that the variability in song structures is high in the weeks preceding the breeding season because during this time the “trend” song is not yet fully developed and experimentation is more common (Noad et al., 2000). Similarities in songs between years could be caused by the slow evolution of the population-specific song from one to the next season, where the preservation of song structures within one breeding population is very common (Rekdahl et al., 2013). P5 in Song 4 could be a slight modification of P1, contained in the Songs 1 and 2, because the units of both phrases were structurally very similar only a difference in frequency range caused a distinction of phrase types (P5 units started at a frequency of 0.15 kHz and the units of the P1 started at 0.3 kHz, respectively). One theme (T3) was repeated between the two seasons of this study. In songbirds, both the simple copying of song fragments and the modification of adopted songs was found to be common (Nordby et al., 2007).
36
Further, the copying of rare song structures within one population of songbirds is thought to deescalate vocal interactions (Beecher and Campbell, 2005) or to indicate individuality (Nordby et al., 2007). In humpback whales, both these hypotheses could be a possible explanation for copying and modifying certain song structures within one population. Humpback whales are thought to increase the variability of their songs when other active singers are in their vicinity (Herman et al., 2017). However, it is assumed that this behavior rather enhances competition instead of having a de-escalative function (Herman et al., 2017). The second hypothesis on song copying and modification in songbirds could also apply to humpback whale behavior, because humpback whale males probably also try to attract females with their songs. The more individual the phrases are formed, the more attractive a humpback whale male could be for the female humpback whales.
This could also be a reason, why humpback whale males migrate between breeding populations because the learning of new song structures on the different breeding grounds might present reproductive advantages (Payne and Guinee, 1983). The mixing of populations on the feeding grounds to find patchy or limited food resources could similarly increase the song variability and finally serve both individual and population fitness (Rekdahl et al., 2018).
4.5 Conclusion
The waters off Namibia are ecologically important because they provide a food source for humpback whales during their migration because of the nutrient-rich, cold Benguela Upwelling System (Findlay et al., 2017). These waters also serve as migration corridor and potential breeding ground for the population of breeding stock B (Gales et al., 2011). The results of this study proofed that humpback whales used the Namibian waters at least seasonally. The ascending and descending characteristics of their acoustical presence indicates migratory behavior of vocal individuals. The identification of song in this region is indicative of at least partly reproductive behaviors of some individual males. A tendency to more singing activities during the night and dusk hours might be related to the temporal segregation of variable behavioral patterns, as feeding, travelling, reproductive
37
competition, and reproductive advertisement. On the other hand, the low number of identified songs during a recording period of about a year and a half could indicate that most humpback whales only migrate through the waters off Namibia. Future passive acoustic monitoring projects off Namibia could help to generate a more detailed understanding of the ecological role of the presumed migrations routes of humpback whales in the eastern South Atlantic. The similarities of the four analyzed songs within and between seasons as well as to the songs in other areas suggest large-scale song transmission processes in the Southern Hemisphere.
More comparative song data might be a key information in understanding population-mixing in humpback whales for implementation in conservation and management plans.