EXAMINATION OF THE SPATIAL RESOLUTION AND DISCRIMINATION CAPABILITY OF VARIOUS ACOUSTIC SEAFLOOR CLASSIFICATION
TECHNIQUES BASED ON MBES BACKSCATTER DATA
Dissertation
zur Erlangung des Doktorgrades (Dr. rer. nat.) an der Mathematisch-Naturwissenschaftlichen Fakultät
der Christian-Albrechts-Universität zu Kiel
vorgelegt von
Evangelos Alevizos (M.Res.)
Kiel, October 2017
Erster Gutachter: Prof. Dr. Jens Greinert, (GEOMAR Helmholtz Centre for Ocean Research, Kiel)
Zweiter Gutachter: Dr. Mirjam Snellen ( TU Delft)
Tag der mündlichen Prüfung: 17 November 2017
Erklärung
Hiermit erkläre ich, dass ich die vorliegende Doktorarbeit selbständig und ohne unerlaubte Hilfe erstellt habe.Weder diese noch eine ähnliche Arbeit wurde an einer anderen Abteilung oder Hochschule im Rahmen eines Prüfungsverfahrens vorgelegt,veröffentlicht oder zur Veröffentlichung vorgelegt. Ferner versichere ich, dass die Arbeit unter Einhaltung der Regeln guter wissenschaftlicher Praxis der Deutschen Forschungs gemeinschaft entstanden ist.
Kiel, den 05.10.2017 Evangelos Alevizos
1 TABLE OF CONTENTS
Abbreviations 4
Zusammenfassung 6
Abstract 7
1. INTRODUCTION 8
1.1 Rationale for the study 8
1.2 Research questions 13
1.3 Case studies overview 14
2. RESEARCH BACKGROUND - ACOUSTIC REMOTE SENSING OF THE SEAFLOOR 16
2.1 MBES principles and state-of-the-art 16
2.2 Principles of seafloor acoustic backscatter 21
2.2.1 Ensonified area on the seafloor 22
2.2.2 Seafloor surface scattering 23
2.2.3 Sediment volume scattering 25
2.2.4 Angular dependence of seafloor backscatter 25
2.2.5 Frequency dependence of seafloor backscatter 27
2.2.6 Backscatter data corrections 28
2.3 Acoustic Seafloor Classification approaches 29
2.3.1 The importance of angular dependence 29
2.3.2 Geophysical and empirical ARA models 30
2.3.3 Backscatter classification based on image analysis 34
2.4 Ground-truth sampling and analysis 40
3. ACOUSTIC DISCRIMINATION OF RELATIVELY HOMOGENEOUS FINE SEDIMENTS USING
BAYESIAN CLASSIFICATION ON MBES DATA 43
3.1 Introduction 45
3.2 Methodology 48
3.3 Results 50
3.4 Discussion 54
2
3.5 Conclusions 61
4. MULTI-ANGLE BACKSCATTER CLASSIFICATION AND SUB-BOTTOM PROFILING FOR
IMPROVED SEAFLOOR CHARACTERIZATION 62
4.1 Introduction 64
4.2 Methodology 65
4.3 Results 71
4.4 Discussion 78
4.5 Conclusions 81
5. QUANTIFICATION OF THE FINE-SCALE DISTRIBUTION OF MN-NODULES: INSIGHTS FROM AUV MULTI-BEAM AND OPTICAL IMAGERY DATA FUSION 83
5.1 Introduction 85
5.2 Methodology 88
5.3 Results 94
5.4 Discussion 98
5.5 Conclusions 103
6. THE HYPER-ANGULAR CUBE CONCEPT FOR IMPROVING THE SPATIAL AND ACOUSTIC RESOLUTION OF MBES BACKSCATTER ANGULAR RESPONSE ANALYSIS 105
6.1 Introduction 107
6.2 Methodology 108
6.3 Results 113
6.4 Discussion 117
6.5 Conclusions 119
3
7. CONCLUSIONS 121
7.1 Acoustic class separation 121
7.1.1 Quantification of class separation – coupling of Bayesian method with ARA 121
7.1.2 The concept of geo-acoustic resolution 123
7.2 Improvements of angular response analysis 124
7.2.1 The hyper-angular cube matrix:spatial resolution, class separation, machine
learning 124
REFERENCES 127
APPENDICES 137
APPENDIX OF CHAPTER 3 137
APPENDIX OF CHAPTER 4 138
APPENDIX OF CHAPTER 5 140
APPENDIX OF CHAPTER 6 142
4
Abbreviations
AC Acoustic class
ASC Acoustic seafloor classification ANOVA Analysis of variance
ARA Angular response analysis APL Applied physics laboratory ANN Artificial neural network
AUV Autonomous underwater vehicle BS Backscattering strength
BORIS-SSA Bottom Reverberation from Inhomogeneities and Surfaces-Small-Slope Approximation CCD Calcium compensation depth
CH Calinski & Harabazsr
CTD Conductivity temperature depth DISCOL Disturbance and Recolonization
GSAB Generic seafloor acoustic backscatter GIS Geographical information system GPS Global positioning system
GLCM Grey-Level Co-occurrence Matrices HAC Hyper-angular cube
IMS Inertial motion sensor
ISA International seabed authority iHAC Interpolated Hyper-Angular Cube ISODATA Iterative self-organizing data analysis
JPIO Joint Programming Initiative Healthy and Productive Seas and Oceans LAT Latitude
LED Light-emitting diode LBL Long baseline LON Longitude
MCK Map comparison kit
MGET Marine geospatial ecology toolbox MLC Maximum likelihood classification MBES Multi-beam echo-sounder
OBIA Object-based image analysis OFOS Ocean floor observation system
OOB Out-of-Bag Error
PCA Principal components analysis PDF Probability density function
RF Random forest
ROV Remotely operated vehicle SSS Side-scan sonar
SCI Site of Community Importance SBP Sub-bottom profiling
SAD Sum of Absolute Differences SVM Support vector machine USBL Ultra-short baseline
5
Acknowledgements
This work has been supported technically and intellectually by several persons who I would like to deeply thank. First of all, I would like to thank my promotor Prof Jens Greinert and my co-supervisor Dr. Mirjam Snellen for arranging and providing everything needed for my research work. Particularly, Prof Jens Greinert provided access to the datasets used in this thesis, assisted in allocation of resources (including hardware and ship-time) and assisted in establishing a fruitful collaboration with researchers from TU Delft. Additionally, Prof Jens Greinert supported my doctoral training by providing funding for participation in international conferences and the SMART summer School (2014, Ireland). Prof Jens Greinert offered me the opportunity to teach GIS modules to his Master’s students, fact that increased my teaching experience.
An important part of my doctoral training included participation in seminars and workshops provided by the Integrated School of Ocean Science (ISOS, CAU Kiel). Dr Mirjam Snellen and Prof Dick G. Simons provided access to their in-house software and assisted in having a productive time during my visits at their group (ANCE group, TU Delft, the Netherlands). Regarding my collaboration with the ANCE group I would like to thank Jeroen Janmaat and Dr Kerstin Siemes for their valuable discussions and software support throughout my visits at their group.
In addition, I would like to thank all the captains and crew of RV Littorina and RV Polarfuchs for their valuable support at field expeditions. Sediment sampling for the needs of the study described in chapter 3 was coordinated by Dr Filip Maysman (NIOZ) and supported by Eduard Fabrizius (GEOMAR). Especially, I would like to thank the captain and crew of RV Sonne and the AUV team of GEOMAR for pre-processing of the AUV hydro- acoustic data used in chapter 5. In addition the AUV team of GEOMAR provided significant support that assisted me in analyzing the AUV hydro-acoustic data used in chapter 5.
Continuing, I am particularly thankful to Prof Armin Freund for providing access and assistance with the laser particle analyzer from his department at GEOMAR. He provided me with valuable information about the use of the instrument and how to present the measurement data. Bettina Domeyer and Anke Bleyer from GEOMAR offered to me drills on laboratory use and access to their laboratory and consumables for performing sediment grain size analyses.
I would like to especially thank Dr Markus Diesing (NGU) for his support in collaborating with CEFAS (UK). This collaboration took place during January 2016 where I participated the research team of Dr Markus Diesing for working on OBIA applications. Dr Markus Diesing arranged my stay in the UK and provided valuable insights on image analysis during our collaboration.
Anne Peukert and Dr Inken Preuss from the DeepSea Monitoring group (GEOMAR) supported me in proof-reading and reviewing my manuscripts prior to submission. Their support is particularly recognized and appreciated. Dr Inken Preuss as well as Anne Volsch and Christine Utecht assisted me greatly with administrative tasks within GEOMAR that made my studies smoother, thus I am very thankful to them.
Finally, I would like to express my gratitude to the DeepSea Monitoring group (GEOMAR) for their generous support all the time of my PhD studies. Last but not least, a big
“thanks” to my family and friends for supporting my efforts in their own, special way!
6
Zusammenfassung
Die vorliegende Dissertation beschäftigt sich mit zwei Hauptthemen der akustischen Meeresbodenklassifizierungstechniken. Im Fokus des ersten Teils steht die Separierung von akustischen Klassen, die die Diskriminierungsfähigkeit der Klassifizierungstechniken und die Qualität ihrer Ergebnisse beeinflusst. Der zweite Teil befasst sich mit der räumlichen Auflösung von akustischen Karten des Meeresbodens, die mit der akustischen Klassenseparierung in wesentlicher Verbindung steht. Die Themenbereiche werden mithilfe eines integrierten Ansatzes untersucht, der a) eine fortgeschrittene unüberwachte Klassifizierungstechnik benutzt und b) deren Auswirkungen auf die “angular response analysis” (ARA) analysiert. Darüber hinaus wird ein neuartiger Ansatz zur Verbesserung der ARA-Technik beschrieben. Durch die Anwendung einer unüberwachten Technik auf der Grundlage der Bayesschen Statistik, die einen internen Cluster-Validierungstest durchführt, wurde eine objektive Klassifizierung der gesamten Rückstreuungsdaten erlangt. Diese Technik nutzt Rückstreuungsmessungen der einzelnen Winkel aus dem zentralen Bereich des Sonar Fächers und bietet dadurch eine bessere Diskriminierung von akustischen Klassen.
Die grössten Vorteile der Bayesschen Technik sind, dass keine Sonarkalibrierung erforderlich ist, sie innerhalb des Fächers Variationen des Meeresbodens unterscheidet und ordinale kategorische Werte für akustische Klassen ausgibt. Letzteres hilft bei der Korrelation von akustischen Klassen mit Daten von Sedimentproben. Die Kapitel dieser Studie basieren auf drei Studien der Bayesschen Technik für die Diskriminierung von:
ähnlichen Typen von weichen Sedimenten, unterschiedlichen Sedimenttypen von Schluff bis Kies sowie verschiedenen Dichten von Mn-Knollen (Knollen m-2). Die Klassifizierungsergebnisse werden pro Strahl zugewiesen und ermöglichen eine hohe räumliche Auflösung der Meeresboden-Klassen. Insbesondere ein spezieller hydroakustischer Datensatz mit stark überlappenden Fächern in Verbindung mit empirischer ARA unterstützte die Untersuchung der Bayesschen Ergebnisse. Es wurde festgestellt, dass die Bayessche Technik die dominanten Winkelresonanzen aus den gesamten Rueckstreuungsdaten objektiv klassifizieren kann. In Anbetracht dessen, dass die ARA- Technik auf den physikalischen Zuständen des Meeresbodens basiert und dass sie durch akustische Klassenhomogenitätsprobleme und fehlende räumliche Auflösung begrenzt ist, schlagen wir einen neuen Ansatz zur Verbesserung dieser Probleme vor. Hierfür wird das Konzept des Hyper-Angular Cube (HAC) angewendet und seine Ergebnisse mit den Bayesschen Klassifizierungsergebnissen verglichen. Der HAC wird durch mehrere Rückstreuungsschichten aufgebaut, die entweder durch die Interpolation von dichten Echomessungen oder durch die Normalisierung der Rückstreu- Mosaike bei unterschiedlichen Einfallswinkeln resultieren können. Die letztgenannte Methode minimiert die Kosten für den Erwerb von dichten hydroakustischen Daten und wurde bisher noch nicht vorgestellt. Die hochdimensionale Datenstruktur des HAC ist geeignet für die überwachte Klassifizierung mit maschinellen Lerntechniken und einer eingeschränkten Menge an Sedimentproben. Der Ansatz betrachtet die Winkelabhängigkeit der Rückstreuung und nutzt hydroakustische- und Probendaten effizienter als es bisher möglich war.
7
Abstract
This thesis focuses on two major topics regarding acoustic seafloor classification techniques. The first topic is that of acoustic class separation which affects the discriminative power of classification techniques and the quality of final results. The second topic is the spatial resolution of seafloor acoustic maps that is fundamentally coupled with acoustic class separation. These topics are examined through an integrated approach which, a) employs an advanced unsupervised classification technique and b) analyzes its implications on the angular response analysis (ARA) of acoustic backscatter. Moreover, a novel approach for improving the ARA technique is described. Applying an unsupervised technique (based on Bayesian statistics) that performs an internal cluster validation test, we obtain objective classification of the entire backscatter dataset. This technique utilizes single-angle backscatter measurements from the middle range of the sonar swath offering better discrimination of acoustic classes. The main advantages of the Bayesian technique are that it does not require sonar calibration, it resolves along-swath seafloor variations and that it outputs ordinal categorical values for acoustic classes. The latter advantage assists in correlating acoustic classes with ground truth information. The Bayesian technique was applied in three studies for discriminating: similar types of soft sediments, a wide range of sediment types from silt to gravel and various densities of Mn-nodules (nodules m-2) respectively. The classification results are assigned per beam providing high spatial resolution of the seafloor classes. In particular, a special hydro-acoustic dataset with high swath overlap assisted the examination of Bayesian results in conjunction with empirical ARA. It was found that the Bayesian technique can objectively classify the dominant angular responses from the entire backscatter dataset. Considering that the ARA technique, is based on the physical properties of the seafloor and that it is limited by acoustic class homogeneity issues and lack of spatial resolution, we suggest a new approach for improving these issues. Therefore, the concept of the Hyper-Angular Cube (HAC) is applied and its results are compared with the Bayesian classification results. The HAC is built by several angular backscatter layers which can result either by interpolation of dense soundings or by normalization of backscatter mosaics at different incidence angles. The latter method minimizes the cost of acquiring dense hydro-acoustic data and has not been presented formerly. The high dimensional data of the HAC is suitable for supervised classification using machine learning techniques and restricted amount of ground truth information. This approach takes angular dependence of backscatter into consideration and utilizes hydro- acoustic and ground truth data in a more efficient way than it was possible until now.
8
1. INTRODUCTION
1.1 Rationale for the study
In recent decades the world ocean-floor faces significantly increased anthropogenic pressure related to climate/ocean change, coastal population/infrastructure growth and considerable demand for marine resources (fish, minerals). As a consequence, a number of efforts have been initiated in order to better evaluate and monitor marine areas that are affected by these pressures. These efforts primarily use seafloor mapping as a tool helping to interpret, analyze, and predict numerous seafloor-types at different spatial scales and their change over time. The development of multi-beam echo-sounders (MBES) has played a key role in seafloor mapping. The strongly expanding use of MBES technology in recent years has significantly increased the availability of hydro-acoustic data at various spatial scales. The main advantage of MBES systems is that they provide co-registered, motion- compensated bathymetric and backscatter data covering relatively large areas on the seafloor. Bathymetric data are used primarily for precise bathymetric mapping while backscatter data provide important information about the seafloor type. The ever- increasing volume of MBES data has triggered the need for methods towards more efficient and detailed mapping of the seafloor. This occurs because the solution for a variety of research and marine spatial planning and management problems relies on input of geo- information about the seafloor and its associated habitats. Thus there is a fundamental requirement to transform hydro-acoustic data into meaningful seafloor maps that carry useful information at appropriate spatial scale. To achieve this, the scientific field of Acoustic Seafloor Classification (ASC) (Anderson et al., 2008) that incorporates different kinds of methods and approaches has been developed. Essentially the main objective of ASC is to identify discrete parts in the hydro-acoustic data (bathymetry and/or backscatter) that are characterized by individual homogeneity that reflects physical seafloor properties (i.e.:
sediment grain size, porosity, etc.). A robust way to perform ASC is through statistical analysis and parallel involvement of the acoustic properties of the seafloor (see ASC methodologies box, section 2.3). Parts of the seafloor with unique acoustic features and properties are then compiled to create seafloor classification maps which can be validated by means of ground-truth data (e.g. physical sampling, visual observations, section 2.4).
Seafloor classification maps comprise valuable input information to various marine spatial projects such as for sediment characterization, benthic habitat mapping, seafloor resource exploration and evaluation and even for geochemical studies.
ASC METHODOLOGIES
There are several ASC approaches available in literature which can be generally divided in three categories according to the following criteria:
a) The type of hydro-acoustic data that they are applied to: meaning that MBES data can be processed either as acoustic signal by utilizing seafloor acoustic parameters and theoretical models (signal processing) or as processed gridded data such as bathymetric surfaces and backscatter mosaics which can be processed using image analysis techniques.
9 b) The type of processing outcomes, which could be i) categorical variables representing seafloor types (qualitative, semi-quantitative results) or ii) continuous variables representing seafloor properties or quantitative sedimentary features such as grain size, percentage of gravel etc,
c) The employment of ground-truth information in the classification process. Classification methods that require a priori input of ground-truth information for determining the number of classes are called supervised methods while methods that only use ground-truth data for validation of results are called unsupervised. In this regard if there is a substantial amount of ground-truth data then supervised classification can be applied whereas in case of lack or limited ground-truth data an unsupervised approach should be preferred instead. As with any remote sensing technique, a minimum amount of ground-truth information is required for validating the classification results regardless the method used to process the data. This is because remotely sensed data provide only indirect information about the seafloor; since they do not represent actual seafloor samples.
A) Processing style B) Results type C) Ground-truth data input signal processing
(angular responses)
quantitative
(continuous) Supervised (a priori) image processing
(grids)
qualitative (categorical)
Unsupervised (not required)
Using the categories mentioned above, one can efficiently describe the nature of any ASC method. In literature a number of ASC methods have been widely studied and some of them became established as standard approaches in some cases. The ASC approaches that have been studied in this thesis include:
- Angular Response Analysis (ARA). This is a signal-based approach that provides semi- quantitative and quantitative information about the seafloor. It has been established by experimental and in-situ hydro-acoustic studies on various sediment types. These studies yielded a number of acoustic parameters which determine the absolute acoustic backscatter values of sediments for certain frequencies and incidence angles of ensonification.
Geophysical models of seafloor backscatter (section 2.3.2) make use of these acoustic parameters for predicting the angular responses of certain seafloor types and vice-versa.
ARA inversion uses measured MBES backscatter values for adjusting the appropriate model parameters and thus predicting seafloor sediments. ARA is part of the Geocoder software that runs in some commercial MBES processing suites (FMGT, Caris HIPS). Apart from model- based ARA there is also the empirically-derived ARA. In this case the relative backscatter intensity values (Chapter 4) are extracted from each incidence angle and compared with ground truth information.
- Unsupervised classification combining Principal Components Analysis (PCA) and k-means clustering.
PCA has been extensively applied in several classification studies in literature. The main advantage of PCA is that it can combine information from a high dimension feature space and output less features (the principal components) that possess more descriptive properties. The principal components can then be clustered using a k-means approach and produce a representation of seafloor classes. However the number of clusters needs to be
10 defined by the user. In this respect, many unsupervised methods require some sort of cluster validation test in order to identify the optimum number of clusters in which the dataset can divided in. PCA can be applied either on tables or grids and it can include numerous MBES bathymetric and/or backscatter features (variables). As for example, Huang et al. (2013) applied PCA on tables with backscatter angular response features (e.g.: slope, minimum, maximum) and produced principal components for each incident angle. Another example of PCA application is the QTC Multiview software that based on Preston 2009 implementation.
Preston 2009 developed a PCA approach for classifying MBES backscatter data using a large number of backscatter gridded features (1st order statistics, textural analysis statistics) along with bathymetric gridded data.
- Unsupervised classification using Bayesian probability. This method has been in the core of this thesis being applied in diverse MBES datasets and compared to other ASC approaches. It is a relatively new method implemented by Simons and Snellen (2009). The method is based on the central limit theorem interpreted for MBES backscatter data.
According to this theorem, the backscatter values resulted from the beam footprint of a particular incidence angle should follow normal distribution for a specific seafloor type (section 2.3.3). The Bayesian method has some important advantages over more commonly used unsupervised methods. First it assigns acoustic classes to each beam and so it resolves across-track seafloor type changes on a footprint scale. One of the most important features of the Bayesian method is that it calculates statistically the optimum number of classes, thus offering more objective results.
- Supervised methods (traditional and machine learning algorithms). In contrast to unsupervised methods the supervised ones require pre-definition of the seafloor classes.
Therefore, ground-truth data of adequate quality and quantity should be employed in this kind of classification approach. One of the most commonly-used supervised methods is the Maximum Likelihood Classification (MLC). It has been applied in satellite image classification and also in studies using MBES data. The MLC method requires that hydro-acoustic data values of a particular seafloor type have a normal distribution. In practice this is not always valid hence this assumption can be a drawback of the method. In addition MLC becomes problematic with high dimensional data (i.e.: large number of MBES grids). In contrast, recent developments of machine learning algorithms provide supervised classification in a more robust way, meaning that they do not require normal distributions of the data and they can identify non-linear relationships between the MBES features and seafloor types (Chapter 6). Moreover, machine learning algorithms can deal with high dimension data and relatively small amount of ground-truth information.
An important feature that affects the usefulness of ASC maps is spatial resolution. A seafloor classification map should be at a scale comparable with that of ground-truth samples/the natural heterogeneity in order to provide useful geo-information to the end- users (Reid 2007; Anderson et al., 2008; McGonigle et al., 2009). Reid (2007) incorporated the beam footprint (i.e.: the ensonified area on the seafloor, section 2.2.1) in the notion of seafloor habitat scales, implying that seafloor features greater than the beam footprint can be mapped and thus classified by means of ASC (Greene et al., 1999). Regarding seafloor mapping in shallow water or at low altitude from the seafloor (10-1000 m range between sonar and seafloor) the beam footprint diameter ranges on average from 0.4 to 1.4m in 10
11 m depth (incidence angles from 0° to 60°) to 3.5 to 14m in 100 m depth. These beam footprint sizes are comparable to the scale of ground-truth observations and support the assumption that the seafloor type is mostly homogeneous within these footprints.
Consequently it is inferred that effective ASC should be carried out on a per beam footprint basis so that seafloor maps represent natural seafloor variability and can be correctly compared with ground-truth data.
ASC maps with high spatial resolution can be used for example, in support of quantitative resource evaluation of certain minerals on the seafloor (i.e.: Mn-nodules, sulfides etc). Margolis & Burns (1976) were among the first to discover that Mn-nodule densities, sizes and shapes vary significantly over distances of few tens of meters. However they note that Mn-nodule spatial variability could not be resolved by the acoustic means that were available at the time of their study. Mn-nodules not only represent a potential resource for exploitation but also they serve as an important hard substrate habitat for dee- sea sessile fauna (Vanreussel et al., 2016; Purser et al., 2016). Thus they can be used as habitat surrogate for particular species and ASC maps of Mn-nodules with sufficient spatial resolution can support better fauna abundance estimates and spatial heterogeneities of nodule-related species over wider areas.
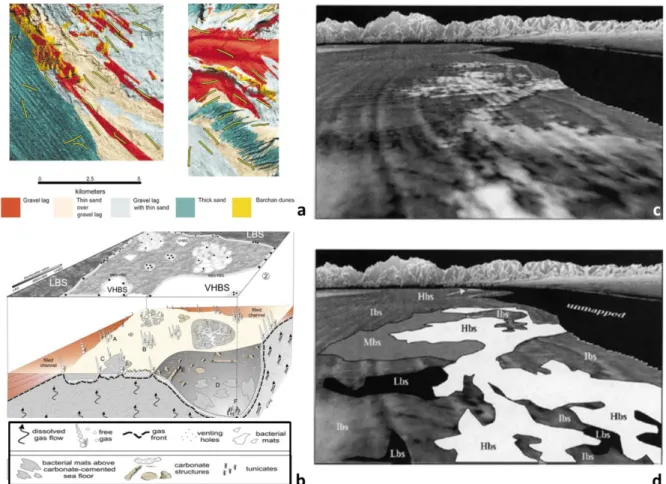
Figure 1.1: A) Fine scale acoustic classification map of scallop habitats (from Kostylev et al., 2003) B) Seafloor areas with very high (VHBS) and low backscatter values (LBS) indicating geological features related to methane seeps (from Naudts et al., 2008) C) & D) Seafloor areas with, low (Lbs), medium (Mbs) and high (Hbs) backscatter values representing various geomorphological features (Gardner et al., 2003).
12 Another important parameter of ASC methods is class separation. Class separation refers to the degree at which hydro-acoustic data exhibit unique properties so that an ASC method can distinguish one seafloor type from another. The significance of identifying acoustically homogeneous areas on the seafloor has been highlighted by Hughes-Clarke (1994), Parnum (2007) and Fonseca et al. (2009). However, due to method restrictions, results from traditional ASC methods (Fonseca and Mayer, 2007; Che-Hasan et al., 2014) cannot resolve the across-track seafloor changes as they do not hold sufficient spatial resolution (section 2.3.1). To overcome these drawbacks, alternative ways have been investigated for improving acoustic class separation (Fonseca et al., 2009). Another approach is the concept of angle-cube which was originally developed by Parnum (2007) and is further utilized in this study (chapters 4, 6).
Since seafloor sediments or substrate types are often being used as surrogates for various benthic habitats (Greene et al., 1999) the need for ASC with improved spatial resolution and sediment discrimination capability is even more important. An important example of MBES backscatter mapping is the study of Kostylev et al. (2003) which focuses on acoustic mapping of sediments related to the commercial species of scallop Placopecten magellanicus. Their study concludes, that precise seafloor classification maps that are able to capture fine scale sediment variability, can assist sustainable scallop fishing activity and improve fishery and dredging management (Fig.1.1 A). Another study that highlights the significance of high resolution hydro-acoustic data in habitat mapping is that of Summers- Morris et al. (2004) where they combined bathymetric analysis with underwater video data for delineating hard substrates, serving as rock-fish habitats in inshore waters. Gardner et al.
(2003) studied the geomorphology of Santa Monica bay considering high resolution MBES backscatter data. Accordingly, they linked physiographic features (of tectonic, sea-level and sedimentary origin) with generic categories (high/low) of acoustic backscatter values (Fig.1.1 C&D). Their study is a useful example regarding the role of backscatter data in interdisciplinary mapping approaches. Moreover, Naudts et al. (2008) utilized MBES backscatter data for mapping fine-scale geological features related to methane seeps (e.g.:
methane-derived authigenic carbonate structures) (Fig.1.1 B). Similarly, Greinert et al.
(2010) utilized MBES backscatter measurements for establishing a relation between these and the number of methane seeps which then was applied for extrapolation (of the number of seeps) in a wider area. The last two studies demonstrate the value of MBES backscatter data, through the diversity of scientific problems which they can apply to.
Ideally, an ASC should be able to differentiate the minimum seafloor heterogeneity which exists at a scale comparable to that of the sonar footprint. Considering that the sonar footprint at shallow waters (<<100 m water depth) is at a scale of a few square meters, the ability of ASC methods to acoustically resolve similar seafloor types becomes a challenging task. This thesis focuses on ASC strategies that provide sufficient class differentiation and produce results with spatial resolution comparable to that of the sonar footprint for relatively short ranges (10-100 m) between the sonar and the seafloor. For improving class separation and spatial resolution in ASC, we examine two different strategies of analyzing acoustic backscatter from MBES data: one that is based on a particular methodology which can be applied on any kind of sonar data and one that is based on a particular data structure which can be analyzed with advanced ASC methodologies.
13 Method-based strategy
Initially a novel ASC method based on Bayesian probability is applied on various MBES datasets covering different seafloor types and it is compared to other ASC approaches (PCA with k-means clustering, empirical Angular Response Analysis, machine learning algorithms).
This method analyzes the backscatter variability within selected beams (of certain incidence angles) and assigns classes to each beam footprint according to Bayesian probability criteria.
By applying the Bayesian approach on different MBES datasets collected from diverse study areas (section 1.3) we aim at evaluating the performance of the method in producing high resolution ASC results showing sufficiently separated acoustic classes that correspond to ground-truth information.
Data-structure strategy
Alternatively, improved spatial resolution and class separation can be achieved by constructing and analyzing a particular data matrix. Multiple backscatter layers can be produced for each beam incidence angle (chapter 6) and stacking of all layers produces the so-called Hyper-Angular Cube (HAC) matrix which is similar to the angle-cube model developed by Parnum (2007). The main advantage of this approach is that each cell of the cube holds substantial acoustic information which can be exploited by traditional ASC methods (i.e. ARA) for providing acoustically meaningful, high resolution classification results. Such a data matrix has not been reported widely in the literature, although it has been pointed out that it is a crucial tool for improving class separation in ASC (Rzhanhov et al., 2012; Che-Hasan et al., 2014; Huang et al., 2013).
1.2 Research questions
This thesis was primarily driven by the following scientific questions about improving spatial resolution and class separation in ASC using MBES backscatter data.
- What is the minimum difference between sediment types that can be discerned by ASC methods?
To answer this question we employed the Bayesian method and compared its performance with other methods that are commonly applied for ASC (PCA with k-means clustering, empirical Angular Response Analysis, machine learning algorithms). For better constraining the application towards the scientific question, we applied the Bayesian method to MBES data from an area with high seafloor sediment homogeneity and an area with broad range of sediment types (section 1.3). In this way, the Bayesian method was tested for producing useful ASC results that sufficiently distinguish a variety of sediment types.
- How can acoustic class separation be quantified?
This question led to the comparison of Bayesian method results with angular response information extracted from the HAC. The cells of the HAC include information at high spatial
14 resolution about the angular dependence of backscatter values. Angular dependence is a fundamental acoustic property of the seafloor and it forms an essential component of many ASC methods (section 2.3.1). The HAC information in conjunction with Bayesian results provide a useful framework for evaluating class separation and how the Bayesian method contributes in separating dominant angular responses representing major seafloor types. In addition we examine the suitability of the HAC as a specific data structure for producing adequate ASC results using novel ASC methods (pattern recognition and machine learning algorithms) and utilizing a small amount of ground-truth data as a priori information.
- Is the Bayesian method suitable for ASC of hard substrates such as Mn-nodules fields?
Mapping of Mn-nodule fields comprises an active field of research with important implications in resource evaluation, deep sea benthic habitat mapping and deep sea mining impact assessment. Therefore in this study we compare the Bayesian method with predictive mapping (random forests) using sufficient quantitative ground-truth data for acoustic class validation. High resolution AUV MBES data provide an excellent opportunity to map the Mn-nodule coverage at the scale of the sonar footprint.
1.3 Case studies overview
This thesis was based on analysis of high resolution (meters scale) hydro-acoustic data-sets from MBES surveys in three different study areas. Each study area comprises a unique seafloor environment with all of them covering a wide range of seafloor variability. The diversity of seafloor types incorporated in the study, assisted in evaluating the scientific questions set in the previous paragraph.
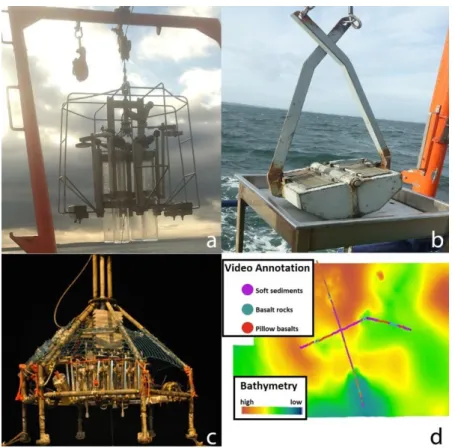
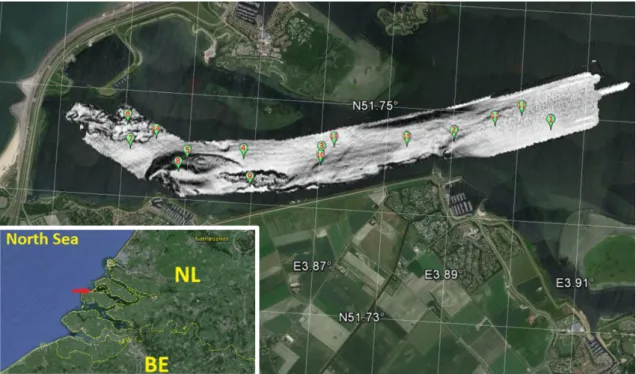
- Grevelingen
The Grevelingen study area (chapter 3) is a dammed estuary in the Netherlands, formerly exposed to the North Sea. The seafloor of the Grevelingen is covered by sediments ranging from silt and clay to medium sand with shell fragments. The main bathymetric features of the area include relict tidal bed-forms (sand ripples), as well as steep channel slopes and rugged terrain created during sediment dredging in recent years. Underwater video data provide evidence for localized epi-benthic cover with various densities of pebbles. MBES data from this area are suitable to test the ability of the Bayesian method to discriminate very similar sediment types. The study based on this data compares the Bayesian method with PCA and k-means classification and validates their results with grain size analysis information.
- Eckernförde Bay
The seafloor of the Eckernförde Bay study area shows a smooth bathymetry with various sediment types (chapters 4, 5). The seafloor sediments range from (anoxic) silt and clay to gravel and pebbles. Areas covered by fine sand were found to be colonized by diverse benthic epi-fauna and infauna. In addition a large part of the bay has been surveyed with more than 100% swath overlap resulting in high density ensonification of the seafloor.
15 This allowed the calculation of several backscatter layers building up the Hyper-Angular Cube. Backscatter angular response information from each cell of the HAC assisted in identifying homogeneous acoustic areas that contain ground-truth information. Angular responses were then combined with Bayesian method results for quantifying acoustic class separation. Furthermore, the HAC data were used in unsupervised and supervised ASC algorithms. The performance of ASC algorithms was evaluated using sediment grain size information and the Bayesian classification results for comparison.
- DISCOL
Hydro-acoustic data from the DISCOL area (chapter 5) assist in mapping of Mn-nodules and testing the Bayesian method in classifying a hard seafloor substrate. The seafloor in the study area generally shows a smooth bathymetry and is almost entirely covered by Mn- nodules. According to AUV optical data the coverage of nodules varies significantly over short distances (10s-100s meters), forming sparse and dense patterns. Therefore, nodule variability that is captured by hydro-acoustic data allows testing the Bayesian and predictive mapping methods in quantifying this hard substratum that serves as important potential mineral resource and as a fragile deep sea ecosystem.
16
2. RESEARCH BACKGROUND - ACOUSTIC REMOTE SENSING OF THE SEAFLOOR
2.1 MBES principles and state-of-the-art
Analogous to airborne and space-bone radars which are based on electromagnetic signals, active sonars transmit acoustic pulses underwater and record their response travel- time (bathymetry) and intensity (backscatter). In this way, collection of underwater 3D imaging data is possible, having particular implications in seafloor mapping studies. Apart from valuable information about the range (which is transformed to depth measurement) sonars provide also intensity records, which are influenced by the physical properties of the seafloor in a complex way. Modern seafloor mapping pays particular attention to acoustic intensity (recorded by multi-beam echo-sounders (MBES) as a robust mean for characterizing the seafloor (Brown and Blondel, 2009). In literature, these MBES records are referred as acoustic backscatter, or backscattering strength (BS, for absolute values).
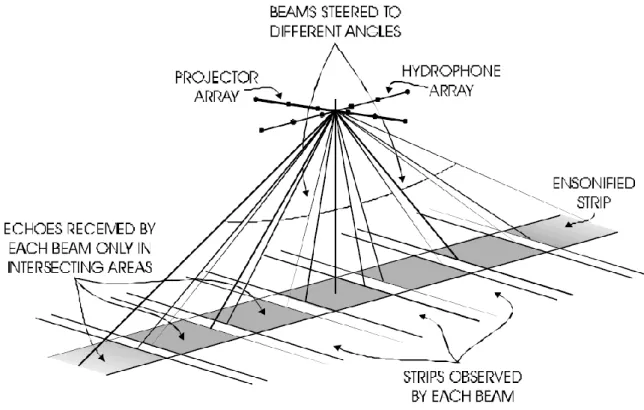
Figure 2.1: Diagram showing the geometry of a MBES sonar transmission. Each ensonified strip (grey rectangles) accounts for a portion of seafloor area that is defined as beam-footprint. (source:
http://www3.mbari.org/products/mbsystem/sonarfunction/SeaBeamMultibeamTheoryOperation.p df)
The acoustic signal is projected through a beam-forming process from the transmitter onto the seafloor (Lurton, 2002). Beam forming is a technique for projecting several acoustic signals (beams) so they are steered on specific azimuthal directions (de Moustier, 1988). The acoustic signal is characterized by a swath of acoustic beams which exhibit fan-shape geometry (Fig.2.1). Consequently, each projected beam ensonifies an area on the seafloor at
17 a certain incidence angle. The area ensonified by each beam is called the beam footprint.
The beam footprint is proportional to the pulse length (duration), the across and along track opening of each beam, the incidence angle and the distance from the sonar to the seafloor (Fig.2.2) (Lurton, 2010). The beam footprint is quantifiable not only as area but also as the time at which, the acoustic pulse with particular duration interacts with the seafloor (Parnum, 2007; Simons and Snellen, 2009). The temporal dimension of the footprint is exploited by some sonar types in order to record individual backscatter values from within each footprint (time-series, snippets, section 2.2.1) instead of providing only an average value of the backscatter for each beam (Innanghi et al., 2015). It is implied that beams having a greater footprint size would carry more backscatter measurements. After interaction with the seafloor the acoustic signal is reflected backwards in some or any direction (depending on the seafloor roughness, section 2.2.2), and the receiver (hydrophone) captures the intensity of the signal at each receiving beam angle (Urick, 1983).
The sonar system software then, amplifies and processes the recorded backscatter data which is co-registered with each depth measurement resulted from each beam (Lamarche et al., 2011). Measurements of depth and backscatter from each beam are also termed soundings. A single, full-swath transmission is called ping and usually involves more than one hundred beams with incidence angles from 0 to maximum 80 degrees, resulting in equal number of soundings (as the number of beams). Typically, most MBES systems trigger multiple pings per second, providing increased along track coverage which is also affected by the survey speed of the vessel (de Moustier, 1988; Lurton and Lamarche, 2015).
Regarding the across track coverage, it depends on the degree of overlap between adjacent survey tracks and the maximum angle of the swath (de Moustier, 1988). Sounding coverage (or density) is a crucial factor in MBES mapping once it influences the spatial resolution of the final maps and also it affects the applicability and performance of ARA method (Hughes- Clarke et al., 1994; Huang et al., 2013). MBES surveys with high overlap provide increased sounding coverage at increased survey time and cost. However the resulting data density allows for improved backscatter analyses with unprecedented accuracy (Chapters 4, 6, Alevizos, 2017).
The ensonification area directly underneath the sonar transmitter is called the nadir and the beams steered at this direction have normal incidence angle (i.e.: perpendicular to the seafloor). This area has particular interest regarding the backscatter behavior and is going to be analyzed further in the next paragraphs. Beams away from nadir are called oblique whereas beams at the boundaries of swath are called outer beams (section 2.2.4).
Figure 2.2: Intersection of beam opening in the along-track (receiver beam: Rx) and the across- track (transmitter beam Tx) directions forming the beam footprint (ellipse) on the seafloor (modified from Parnum and Gavrilov 2011).
18 Functionality of MBES systems depends upon a number of appropriate parameters, so they are able to provide accurate measurements of depth and backscatter values. Accurate depth and backscatter values are required as input data to any ASC method for valid classification results. Several MBES parameters need to be adjusted prior to MBES data acquisition and during post-processing. For collection of MBES data of adequate quality the sonar system has to be provided with external information regarding the following parameters:
- Accurate above- and under-water positioning
Spatial accuracy is of great importance in MBES mapping and its level is dictated by the specific objectives of the project. Ship-based MBES surveys rely on GPS antennas in conjunction with motion information (explained below) for accurate positioning and georeferencing of sounding measurements (Mayer, 1999; Blondel, 2009). Autonomous Underwater Vehicle (AUV), Remotely Operated Vehicle (ROV) or other underwater platforms rely on acoustic Ultra-Short Base-Line (USBL) or Long Base-Line (LBL) systems for accurate underwater positioning (Blondel, 2009). USBL systems consist of pairs of acoustic transponders between the underwater platform and the surface vessel that provide relative distance and direction of the underwater platform with reference to the vessel. This information is then combined with GPS data in order to obtain underwater navigation and MBES data georeferencing. LBL systems are used for underwater navigation of AUVs and they are fixed transponders, placed on the seafloor. LBL systems transmit acoustic signals that are received by the AUV which uses them to triangulate its position and to georeference the MBES data using USBL communication with the surface vessel.
- Inertial motion compensation
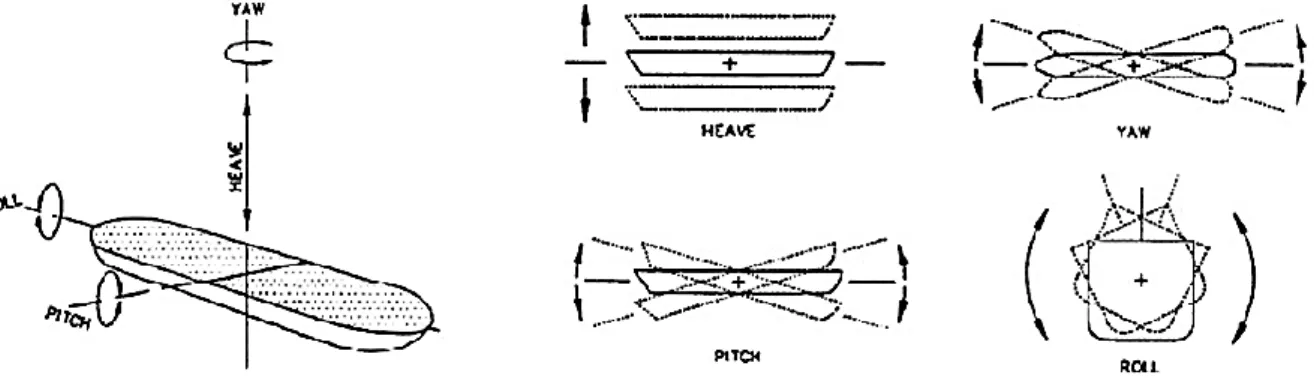
Vessels and underwater platforms are dynamic even when they are not moving, meaning that their position is susceptible to motion induced by the constantly changing conditions of water masses. Vessel motion introduces artifacts in the MBES data records which need to be compensated for (Blondel, 2009). Inertial motion sensors (IMS) measure the motion of vessel or underwater platforms in three dimensions. The main motion components being measured by an IMS system are: roll, pitch, yaw and heave (Fig.2.3).
Motion information is then combined with GPS data allowing the MBES system to perform real-time motion compensation of the hydro-acoustic data (Hughes–Clarke et al., 1997).
Because in practice the MBES system and the motion sensor/-s cannot be perfectly aligned there are a number of tests required prior to MBES data acquisition so that the MBES applies the correct motion parameters. Application of these parameters is based on matching of timestamps between the IMS and the MBES sonar, thus accurate time between these is crucial for achieving good quality hydro-acoustic data (Blondel, 2009). The tests required prior to MBES data acquisition, are called the “patch test” and they assist in measuring the fine-scale misalignments (of angles) relative to the IMS and the MBES system.
The patch test consists of:
19 a) A roll test: this is to identify the difference in angle between the MBES and the IMS that introduces bias in the motion about the y-axis. To perform this test the vessel should run 2 lines in opposite directions with half swath overlap over flat seafloor. In an ideal sensor configuration swath data from these lines should perfectly overlap but this is not the case. The dipping angle of flat seafloor should be measured for port and starboard sides and provided to the MBES software as roll bias value.
b) A pitch test: this is to identify the difference in angle between the MBES and the IMS that introduces bias in the motion about the x-axis. To perform this test the vessel should run 2 lines in opposite directions with half swath overlap over seafloor with slope and parallel to the slope. Measurement of the along-swath angle difference of seafloor slope in the two swaths should be provided to the MBES software as pitch bias value.
c) A yaw (or heading) test: this is to identify the difference in angle between the MBES and the IMS that introduces bias in the motion about the z-axis. To perform this test the vessel should run 2 lines in opposite directions with half swath overlap over seafloor with slope, perpendicular to the slope or over flat seafloor with some distinct target (e.g.: shipwreck). Measurement of the across-swath angle difference of the target or seafloor slope in the two swaths should be provided to the MBES software as pitch bias value.
Figure 2.3: Sketch illustrating the inertial motion components of a vessel (modified from:
http://coastalhydraulicslaboratoryfact.tpub.com/chetn-ix-1/chetn-ix-10004im.jpg).
- Static offsets and time differences between the sensors
The survey components (antennas, sensors) are not all placed at the same point, therefore the MBES accuracy depends on the so called static offsets between these components. The relative position of the MBES sensor to the GPS antennas and the IMS sensor has to be measured and inserted in the MBES software prior to data acquisition so MBES data receive position and motion information that is spatially corrected (Lurton and Lamarche, 2015). In addition to the spatial offsets, time differences between the survey components must be taken into account. Time differences can cause the so called “latency errors” which are related to erroneous application of motion bias compensation on the data.
20 Figure 2.4: a) AUV bathymetry grid (3 m x 3 m cell size) with motion (roll bias) artefacts due to varying time difference between the IMS and the MBES sonar (latency error). Black arrows indicate the along-track direction. b) Filtered AUV bathymetry grid (3 m x 3 m cell size) using a Gaussian filter for images.
This occurs because time is the parameter that interconnects the components of a MBES system and even a small time delay can have a great impact on data quality (Fig.2.4 a). Such an effect was encountered in AUV bathymetry data in chapter 5 where it was not possible to account for a varying time difference and a Gaussian filter for images was applied instead (Fig.2.4 b). Time-related offsets can be measured via a latency test. The vessel needs to run two overlapping lines in the same direction over a target on the seafloor at two different speeds (one twice as fast as the other). The target will appear in different positions if a latency error exists. The time difference can be given by the following formula when the apparent distance of the target on the seafloor is measured:
t = D/(Vfast-Vslow) [2.1]
where: t = time delay in seconds, D = apparent along-track displacement of target between the two lines in meters, V = the vessel speed for fast and slow lines respectively (in meters/second).
- Sound velocity data
Propagation of sound under water is affected by the physical properties of the water column and primarily by water density. Layers of water masses with different densities cause refraction of the acoustic signal in the same way that different transparent materials refract light (Fig.2.5). As a result, varying sound velocities can produce artifacts in the hydro- acoustic data in the sense that refracted signals are received in wrong positions and that faster/slower sound velocities may be incorrectly converted to shallower/deeper depth measurements. Lurton et al. (1994) derived a sound speed profile from measured water column properties for correcting the MBES depth measurements. This method is currently an essential part in every MBES survey.
21 Figure 2.5: Diagram representing the effect of water column sound properties on the hydro- acoustic signal. (source:
https://confluence.qps.nl).
- Vertical motion
Tidal information with reference to a vertical datum local to the study area should be obtained and applied to the MBES data either prior to the survey or in post-processing of the data. Additionally, measurement of the relative draft of the vessel along with draft change (due to bulge, fuel consumption) should be taken into consideration for correcting the vertical motion effects on the MBES bathymetry data.
Once the above parameters are tuned, then the MBES survey can yield reliable hydro- acoustic data without positional or motion artefacts. However other kinds of artifacts might be present on the data (bubbles, fish, turbulence) and post-processing of bathymetry is required in order to obtain clean bathymetric data. Bathymetric data of high quality are needed to improve the quality of backscatter data as well, but the backscatter data require particular post-processing steps in order to be used for ASC. The corrections of backscatter measurements are analyzed in the following section along with the various factors that influence backscatter from the seafloor.
2.2 Principles of seafloor acoustic backscatter
The interaction between the incident acoustic signal and the seafloor is a complex, stochastic physical process. Its complexity is due to the fact that a large number of factors affect backscattering of the seafloor. In order to obtain a solid view about the acoustic behaviour of the seafloor in a practical way one should consider the following.
Kinsler et al. (1999) demonstrated that seafloor backscattering is primarily dependent on the difference between the acoustic impedances of the water and the seafloor material, while it is also affected by seafloor surface roughness (relative to signal wavelength), sediment volume heterogeneity and angle of ensonification (Lurton and Lamarche, 2015). It has to be noted that interaction between the acoustic signal and the seafloor surface roughness or sediment volume depends on the frequency of the transmitted signal as well (Jackson et al., 1986). In a simplified example where seafloor surface is considered as flat
22 and smooth and the incident acoustic pulse is perpendicular to the seafloor surface, backscatter can be estimated simply by the reflection coefficient between the two media;
i.e.: water and seafloor cover. The reflection coefficient is derived by the ratio of transmitted to the reflected acoustic pressures which at normal incidence angles is only dependent on the acoustic impedance of the material that covers the seafloor (Eq.2.2). In contrast, at oblique angles of ensonification the reflection coefficient also depends on the incidence angle (Kinsler et al., 1999).
Reflection coefficient for normal incidence angles:
V= (Z2-Z1)/ (Z2+Z1) = (ρc2-ρc1)/ (ρc2+ρc1) [2.2]
where: Z= acoustic susceptibility of the media, ρ= bulk density of the media, c=speed of sound through the media
Natural seafloor not only includes a large variety of sedimentary/benthic cover types but also it occurs in a variety of forms including slopes in any aspect, various scales of surface irregularity and volume inhomogeneity. The following sections describe the effects of seafloor surface and volume characteristics on acoustic backscatter.
2.2.1 Ensonified area on the seafloor
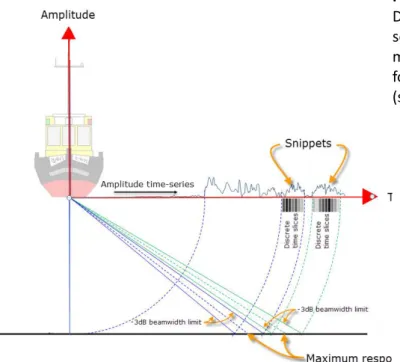
The acoustic signal is projected as an array of beams (swath) on the seafloor at various incidence angles, ensonifying a particular area on the seafloor, that is dependent on pulse length (duration) and angle of ensonification (Lurton, 2010). It has been shown that a large seafloor surface is ensonified at incidence angles close to nadir and when long pulses are transmitted, whereas a small seafloor surface is ensonified at incidence angles towards the outer range of the swath and when short pulses are transmitted (Lurton, 2010). The ensonified area can be expressed as a function of time (that is the duration of the pulse length) implying that each ensonified area yields a number of acoustic time series values that depends on the footprint size (Hammerstad, 2000). These backscatter time series values are called snippet data (or snippets, or scatter-pixels) and can either be logged by the MBES separately or they are combined for measuring the mean backscatter from each beam (Fig.2.6).
23 Figure 2.6:
Diagram representing the time- series/snippets of backscatter measurements within a single footprint (ensonified area)
(source: https://confluence.qps.n)
The snippets are involved in the theory of the Bayesian method (chapter 3) where it is suggested that the values of a large number of individual snippet data within a single incidence angle footprint would have a normal distribution when a homogenous seafloor type is considered (Simons and Snellen, 2009).
2.2.2 Seafloor surface scattering
When the acoustic pressure wave hits the seafloor, initially it interacts with the seafloor surface. A smooth and flat seafloor surface will reflect the incident acoustic signal opposite but along to the direction of ensonification (Fig.2.7 d) (Jackson and Richardson, 2007). This is called the specular reflection and its backscattering strength depends on the angle of ensonification and the acoustic impedance of the seafloor cover (Urick, 1983).
However, in practice this does not occur in its absolute sense. Seafloor surface is known for having irregular relief hence it reflects acoustic energy in any direction with part of it being reflected directly back to the sonar sensor (Fig.2.7 d). The relief of seafloor surface can be described by different statistical expressions, including the variance of seabed heights, the root mean square residuals of an average fitted seafloor bathymetry (Fig.2.7 b) and power spectra analysis (Ferrini and Flood, 2006; Eleftherakis, 2013; Lurton and Lamarche, 2015).
The seafloor surface can be characterized as smooth or rough when compared to the wavelength of the incident acoustic signal (Table 2.1). Thus, surfaces with seafloor height variations greater than the signal wavelength are considered rough, whereas surfaces with height variations smaller than the signal wavelength are considered smooth (Lurton and Lamarche, 2015). In the case of smooth surfaces, the incident acoustic signal is highly subjective to specular reflection for normal incidence angles and backscattering is affected by angular dependence for oblique angles (Fig.2.8 d). When a rough surface is ensonified, it scatters the acoustic energy in all directions hence the effect of angular dependence decreases and backscattering is similar for all incidence angles (Fig.2.8 f).
24 Table 2.1: Frequency and acoustic wavelength for given sound speed underwater (1500 m/s).
Frequency (kHz) λ (mm)
50 32
180 9
400 4
700 2
Considering the above, it is understood that the frequency of the acoustic signal (that controls signal’s wavelength) plays a very important role in acoustic backscatter (Table 2.1). It is implied that seafloor roughness which is at a scale similar to the acoustic wavelength will have a prominent impact on backscatter signal, meaning that, depending on the operating sonar frequency the same seafloor may appear rough or smooth.
Figure 2.7: a) Sediment Profile Imager photo displaying volume inhomogeneity and bioturbation effects (illustrated in minor image, source: Senckenberg Institute) in the upper 30 cm of surface sediments. b) Root mean square residuals (black dots) from fitted bathymetric surface, as an example of seafloor roughness measure (from Eleftherakis, 2013). c) Sketch of acoustic signal penetration at different frequencies for a middle range incidence angle (Beaudoin et al., 2015). d) effect of seafloor roughness on the directivity of the specular reflection of backscatter (Lurton and Lamarche, 2015).
25
2.2.3 Sediment volume scattering
Part of the acoustic wave energy is transmitted through the seafloor to some extent.
The extent of acoustic penetration is determined by the sonar frequency (i.e.: the wavelength of the acoustic signal), the density of seafloor material and the angle of ensonification (Fig.2.7) (Urick, 1983; Jackson and Briggs, 1992).
Seafloor sediments with low impedance (sediments with low bulk density) allow transmission of acoustic energy through their volume deeper than sediments with higher impedance. In addition, acoustic signals with short wavelengths (i.e.: high frequency sonar,
>100 kHz) are more susceptible to absorption by the seafloor sediments than signals with larger wavelengths (i.e.: low frequency sonar) (APL, 1994; Ferrini and Flood, 2006; Fonseca and Mayer, 2007). Thus large wavelength signals penetrate deeper into the sediments for given sediment impedance. In nature, the sediment volume is not necessarily homogeneous in all cases; therefore backscatter includes a contribution from individual scatterers such as, infauna, sub-surface layering, gas bubbles or concavities due to bioturbation (Fig.2.7. a) (Novarini and Caruthers, 1998). In case of smooth and flat seafloor surface, intermediate oblique incidence angles (from the middle range) show greater penetration potential than normal incidence and greater oblique angles at the outer swath range (Fig.2.7 c). At normal incidence angles, the specular reflection counteracts the penetration of the acoustic signal into the seafloor and at greater oblique angles the acoustic signal produces a weak backscattering because most of its energy is entirely reflected (Lamarche et al., 2011).
Apart from the concepts described previously, two major parameters that constitute acoustic properties of the seafloor influence the acoustic backscatter. These are the angular and frequency dependences of backscatter strength, the features of which provide valuable insights in the task of seafloor characterization.
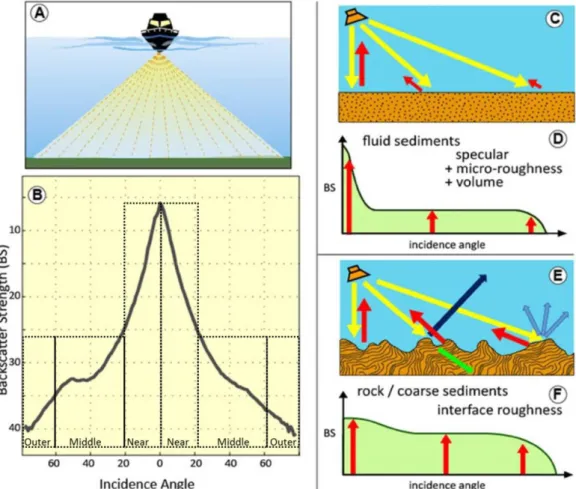
2.2.4 Angular dependence of seafloor backscatter
Angular dependence refers to the influence that the ensonification angle exerts on seafloor backscatter measurements. This phenomenon has been observed in experiments, in situ and also it has been predicted by geo-acoustic models. Angular dependence is a physical property of the seafloor (Jackson and Briggs 1992; Fonseca and Mayer, 2007) meaning that a certain seafloor type yields a unique set of angular responses.
This set is also referred to as acoustic signature of a particular seafloor type (Alevizos 2017) and it contains information about seafloor roughness and volume heterogeneity. In angular response analysis, the angular responses are divided in parts of the incidence angles domain (normal, intermediate oblique and very oblique) (Fonseca and Mayer, 2007; Huang et al., 2013). These domains can also be expressed in terms of increasing distance from the sonar nadir as near, middle and outer ranges respectively (Fig.2.8 b).
A smooth seafloor composed of soft sediments (with low impedance) would yield high backscatter values at the near nadir domain (specular reflection effect) followed by lower values at middle range angles and even lower values at outer range angles (Fig.2.8 c,d). The smoother the surface it is, the greater the effect of specular backscatter at the near range leading to greater contrast between the backscatter values of the near and middle ranges.
The backscatter at the middle range includes contribution from the seafloor volume (as
26 penetration is optimal for these angles, section 2.2.3) whereas in the outer range backscatter gets weaker since the acoustic energy is distributed at a larger ensonification area (Lamarche et al., 2011). A seafloor of harder material produces more uniform angular responses along all angular domains with a clear decrease in backscatter values in the outer range (Fig.2.8 e,f). Furthermore, it has been found that smooth seafloor with soft sediments would result in high backscatter values at normal incidence angles, appearing as hard seafloor. In contrast, backscatter values from the middle range angles differ substantially for each seafloor type, making them an ideal tool in seafloor acoustic classification (section 2.3.1) (Lamarche et al., 2011).
Although angular dependence is a valuable property for acoustic investigations of the seafloor, it rather complicates the appearance of acoustic imagery. When considering acoustic backscatter maps of the seafloor, the angular dependence is removed from the data so they only represent backscatter variations as if the entire survey took place with single incidence angle beams (Fonseca et al., 2009; Lamarche et al., 2011).
Figure 2.8: A) Sketch showing across-track MBES swath. B) Example port and starboard backscatter responses of incidence angles corresponding graphically with beam angles in figure A. The dotted rectangles indicate the angular regimes relatively to the nadir (zero). C) Schematic representation of backscattering geometry of a smooth seafloor regarding the three regimes (arrows) described in figure B. D) Schematic representation of angular responses from a smooth seafloor with red arrows indicating the BS at each angular regime. E) Schematic representation of backscattering geometry of a rough seafloor. Red and yellow arrows indicate the acoustic energy directed back to the receiver, whereas the rest of the arrows indicate the diffused paths of acoustic energy. F) Schematic representation of angular responses from a rough seafloor with red arrows indicating the BS level at each angular regime. (modified from Lurton and Lamarche 2015).