Detachment tectonics at Mid- Atlantic Ridge 26°N
florent Szitkar1, Jérôme Dyment 2, Sven petersen3, Jörg Bialas 3, Meike Klischies3, Sebastian Graber3, Dirk Klaeschen3, isobel Yeo4 & Bramley J. Murton4
Spreading processes associated with slow-spreading ridges are a complex interplay of volcanic accretion and tectonic dismemberment of the oceanic crust, resulting in an irregular seafloor morphology made up of blocks created by episodes of intense volcanic activity or tectonic deformation. these blocks undergo highly variable evolution, such as tilts or dissection by renewed tectonic extension, depending on their positions with respect to the spreading axis, core complexes, detachment or transform faults.
Here, we use near-seafloor magnetic and bathymetric data and seismic profiles collected over the tAG Segment of the Mid-Atlantic Ridge to constrain the tectonic evolution of these blocks. our study reveals that the presence and evolution of oceanic core complexes play a key role in triggering block movements. the deep subvertical detachment fault roots on the plate boundary, marked by a thermal anomaly and transient magma bodies. thermal and magmatic variations control the structure and morphology of the seafloor above the subhorizontal detachment surface, occasionally leading to relocating the detachment.
Unlike fast-spreading centers associated with intense volcanic activity, slow-spreading ridges are characterized by lower magma flux1 and tectonic extension, often accommodated by long-lived detachments faults2–5. As a result, slow-spreading seafloor exposes variably faulted and tilted crustal blocks, dykes, lower oceanic crust and mantle rocks, comprising oceanic core complexes (OCCs)6,7. Due to its importance as a host to massive sulfide deposits, the slow-spreading TAG Segment (26°N, Mid-Atlantic Ridge, spreading rate 23.2 mm/y) was surveyed in 2016 during cruise M127 of German R/V Meteor by the Autonomous Underwater Vehicle (AUV) Abyss to collect high-resolution, near-seafloor magnetic and bathymetric data. Seismic reflection data were also acquired using airgun shots and a deep-towed multichannel seismic streamer. Hydrothermal massive sulfide mounds usu- ally form prominent bathymetric features associated with a strong magnetic signature reflecting the geological setting, and are therefore easy to identify8–15. The magnetic signature of these hydrothermal sites is not always centered above the features. This mismatch is either interpreted as a consequence of the tectonic tilt of a homo- geneous underlying block16 or of a composite, heterogeneous geology of the basement. An additional parameter to be considered is the possible inclination of the hydrothermal conduits. We combine the magnetic response of hydrothermal mounds at different altitudes above the seafloor with high-resolution bathymetric data to constrain the geology, tilt and conduit inclination, unveiling the detailed tectonics of the TAG segment (See “Methods”).
Generalities
When the basaltic oceanic crust cools, its magnetic minerals acquire a remanent magnetization aligned with the ambient geomagnetic field. The resulting magnetic anomaly is generally made of two lobes and is difficult to interpret. To alleviate this difficulty, the anomaly is reduced to the pole (RTP), where both the magnetization and geomagnetic field vectors are vertical and the anomaly located above its causative body. Nevertheless, subsequent tectonic events may tilt crustal blocks, affecting the magnetization vector orientation and therefore the shape of magnetic anomalies16.
At basalt-hosted hydrothermal systems, high-temperature fluids demagnetize basalt permanently due to the alteration of titanomagnetite17–20. Assuming the crustal block hosting the hydrothermal mound is geologically homogeneous and has not been tilted, the RTP magnetic anomaly is a low centered over the bathymetric features.
For hydrothermal mounds growing on a homogeneous and tilted basaltic block, the RTP magnetic anomaly is no longer a magnetic low. The correction required to transform this anomaly to a magnetic low provides an indirect
1NGU, The Geological Survey of Norway, Trondheim, Norway. 2Universite de Paris, Institut de physique du globe de Paris, CNRS, Paris, France. 3GEOMAR Helmholtz Centre for Ocean Research, Kiel, Germany. 4NOC, Southampton, United Kingdom. Correspondence and requests for materials should be addressed to F.S. (email: florent.szitkar@
ngu.no) Received: 27 March 2019
Accepted: 26 July 2019 Published: xx xx xxxx
open
way to approach the underlying block magnetization vector direction. The orientation of hydrothermal conduits (for instance along faults) is a possible cause of apparent tilt (Supplementary Information). Analyzing magnetic surveys acquired at different altitudes allows discriminating between these two effects.
Conversely, ultramafic-hosted hydrothermalism produces magnetization21 aligned with the geomagnetic field due to the formation of abundant magnetite. In this case, any tilt unraveled by the magnetic anomaly analysis happened subsequently to the hydrothermal mound formation and is therefore very recent.
Active and inactive massive sulfide deposits on the TAG Segment were surveyed by AUV Abyss at altitudes ranging from 20 to 120 m (Fig. 1, Supplementary Material). In the northern part of the survey area, these data are complemented by multichannel seismic reflection profiles imaging detachment surfaces. Combined with previ- ously published data from the TAG Mound8, our new datasets represent a unique opportunity to constrain the tectonic history of the segment.
observations
A recent study based on deep-sea submersible magnetic data collected ~20 m over active basalt-hosted hydrother- mal site TAG revealed that the associated RTP magnetic anomaly low8–13 remains dipolar with a minimum located south of the hydrothermal mound16. Correcting the RTP anomaly requires a ~50° block tilt with a rotation axis parallel to the spreading axis, i.e., the tilt occurs in a N120°E direction (counted positive if an initially horizontal surface dips toward this direction) assuming a vertical hydrothermal conduit16 (Supplementary Information).
The resulting low is located above the site. AUV Abyss acquired magnetic data ∼70 m above the TAG Mound.
The RTP magnetic anomaly low associated with TAG is located ∼100 m northwest of the mound on this dataset (Fig. 2). The shift between magnetic lows at ~20 m and ~70 m reflects a ~60° inclined hydrothermal conduit trending N60°W. Such inclination in turn slightly distorts the anomaly, accounting for 12° of the estimated tilt (Supplementary Information). The real block tilt is therefore ~38° towards a 120° direction. The 38° block tilt adequately corrects the magnetic signature of neighboring volcanic mounds on the AUV data (Supplementary Information). The uncertainty on this value is very low (~5°) because magnetic data from the Alvin were collected close to the seafloor (~20 m above the highest point of the hydrothermal mound) and the prominence of hydro- thermal site TAG makes replacing the magnetic anomaly above its causative source straightforward.
Zone Mir22, a massive sulfide mound 2 km ENE of the TAG Mound (Fig. 1), was surveyed by AUV dives at different altitudes. Unlike TAG, the RTP magnetic anomaly does not require correction to display a magnetic low, implying the underlying block is not significantly tilted. The magnetic low shifts westwards as the AUV altitude increases: as for the TAG Mound, data acquired at different altitudes unveil a 60° inclined hydrothermal conduit trending N60°W (Supplementary Information).
Several inactive hydrothermal mounds lie within a ~200 m deep depression ~2 km NNW of Mir (Fig. 1). Magnetic datasets were collected at three altitudes over these mounds. On the highest resolution data (closest to the seafloor), each hydrothermal mound is associated with a distinct negative magnetic anomaly (Supplementary Information), whereas a volcanic edifice nearby displays a typical positive magnetic anomaly. At all AUV altitudes, each anomaly is centered on its source, suggesting no block tilt and a vertical hydrothermal conduit for all sulfide mounds.
A fourth area, 4 km NNE of the TAG Mound, investigated the Shimmering Mound with an AUV dive at 70 m altitude (Fig. 1 and Supplementary Information). This active hydrothermal mound protrudes above a steep westward slope. Nearby unfaulted volcanoes indicate that the spreading axis is located at the bottom of a 1 km-long, NNE elon- gated bathymetric high, hereafter named Shimmering Hill23. We consider the Shimmering Hill and the Shimmering hydrothermal site separately, as hydrothermalism at site Shimmering has likely affected its magnetic properties.
Detachment termination
Figure 1. Bathymetry and interpreted morphology of the study area. (a) Regional, ship-based bathymetry of the TAG Segment (Mid-Atlantic Ridge 26°N). Red box delineates b. White lines mark the spreading axis.
(b) High-resolution bathymetry acquired by AUV Abyss overlay on regional bathymetry. Black boxes delineate Supplementary figures. Red lines mark the location of schematic cross-sections A–D shown in Fig. 3, yellow lines indicate the location of seismic profiles shown in Fig. 4. Annotations point out known hydrothermal sites.
(c) Seafloor morphology deduced from bathymetry and direct observation. Thick black line corresponds to the spreading axis, thin black lines to major faults and other tectonic elements.
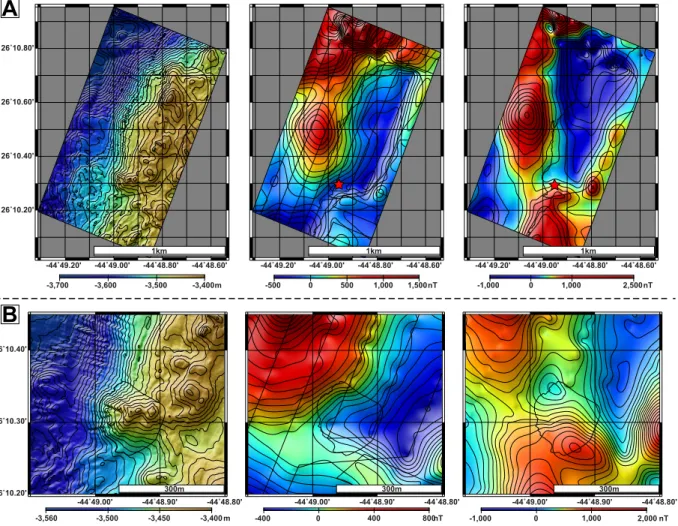
The RTP magnetic anomaly reveals a major positive anomaly Northwest of Shimmering Hill, corresponding to the Neo-Volcanic Zone (NVZ) (Figs 1c and 2A). Such anomaly most likely results from the fresh and highly magnetized basalt constituting the seafloor in this area. By contrast, the Shimmering Hill exhibits a negative magnetic response. This apparent negative anomaly results from a sharp magnetization contrast between the highly-magnetized basalt downslope and the comparatively less magnetized material of the Hill.
In a first approach, we assume the Hill is made of homogeneous material and try to adjust the magnetiza- tion vector inclination to get a magnetic anomaly above its causative source, either positive or negative. Given the orientation and location of the Hill, the most likely tilt orientation is perpendicular to the spreading axis.
Nevertheless, to get a positive magnetic anomaly over the Hill, a −50° magnetization vector inclination is required, resulting in a 130° tilt in a N120°E direction (Supplementary Information). To get a negative magnetic anomaly, a ~110° is required, resulting in a back tilt of −37° in a N120°E direction (Supplementary Information).
Such tilts are geologically unrealistic, i.e., the magnetic observations cannot be explained by the tilt of a homoge- neous block. The Shimmering Hill is therefore made of a heterogeneous basement. The Hill may have undergone a tectonic tilt, which amount remains impossible to estimate.
Over site Shimmering, the RTP anomaly displays a negative lobe shifted North of the site (Fig. 2B).
Hydrothermal sites are either associated with a negative (basalt-hosted) or positive (ultramafic-hosted) magnetic anomalies. Here again, we try to estimate the required tilt to ensure a consistent magnetic signature over the site.
The position of site at the southwestern end the Hill, allows tilting in various directions. Using these additional degrees of freedom, we systematically explored all possible tilts along all possible orientations and found that no realistic tilt can be obtained (Supplementary Information). These unrealistic tilt values rule out the possibility of a site overlying a homogeneous basement. Site Shimmering therefore lies on a complex basement, similar to that of the Shimmering Hill.
Such a complex basement is corroborated by the recovery of greenstone - microgabbro and dolerites - at the top of Shimmering Hill and suggests that Shimmering Hill is mostly made of deep crust/uppermost mantle rocks.
From its smooth morphology and composite petrology, we propose that the western slope of Shimmering Hill is the detachment surface of a recently initiated OCC, the top of the Shimmering Hill being the breakaway.
-44˚49.20' -44˚49.00' -44˚48.80' -44˚48.60' 26˚10.20'
26˚10.40' 26˚10.60' 26˚10.80'
-3,700 -3,600 -3,500 -3,400m -500 0 500 1,000 1,500nT -1,000 0 1,000 2,500nT
1km 1km 1km
-44˚49.20' -44˚49.00' -44˚48.80' -44˚48.60' -44˚49.20' -44˚49.00' -44˚48.80' -44˚48.60'
-44˚49.00' -44˚48.90' -44˚48.80' 26˚10.20'
26˚10.30' 26˚10.40'
-3,560 -3,500 -3,450 -3,400m -400 0 400 800nT -1,000 0 1,000 2,000 nT
-44˚49.00' -44˚48.90' -44˚48.80' -44˚49.00' -44˚48.90' -44˚48.80'
300m 300m
300m
B A
Figure 2. Bathymetry and magnetic anomaly of Shimmering. (A) High-resolution bathymetry, non-RTP magnetic anomaly (with AUV routes) and RTP magnetic anomaly over Shimmering Hill. (B) High-resolution bathymetry, non-RTP magnetic anomaly (with AUV routes) and RTP magnetic anomaly over hydrothermal site Shimmering.
An older OCC has been recognized ~3 km ESE, where another NNE bathymetric high, the breakaway, over- looks a smooth, 700 m-long and 1500 m-wide outcropping, corrugated detachment surface (Figs 1 and 3). This detachment roots westward under a unit showing no volcanic construction but a finely grained surface character- ized by a lack of relief, minor faults trending either NNE or ESE. The corrugations observed on the detachment surface extend below this unit and control the ESE faults. This unit is likely an accumulation of rubble dragged away by the shallow underlying detachment. This explains the weak long-wavelength magnetic anomaly corre- sponding to this unit (Supplementary Information), as the rubble probably exhibits a random orientation and a negligible bulk magnetization. Seismic profiles (Fig. 4) image a continuous detachment surface up to the bathy- metric high of the new detachment breakaway where the event terminates abruptly.
tectonic implications
We investigate the tectonics of the TAG area using AUV bathymetry and block tilts derived from magnetic data.
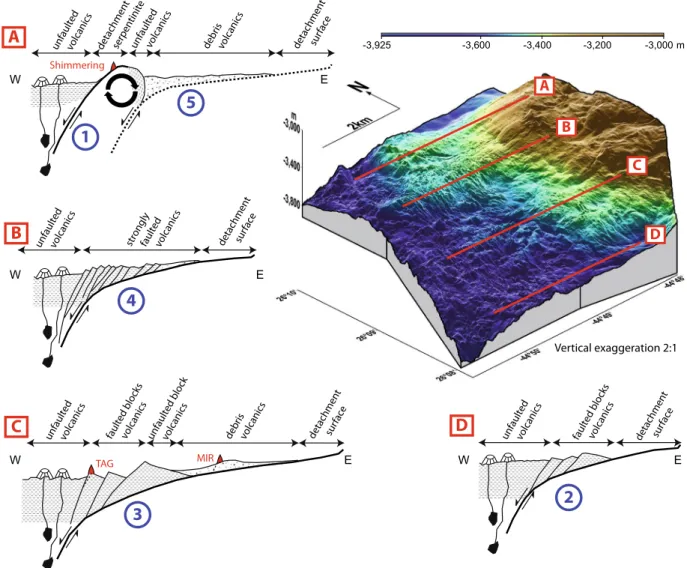
We built four sections, labeled A-D, from the observed morphologies, tectonic elements (faults, detachments), and block tilts at or near hydrothermal sites. We distinguish four terrains based on their morphology (Fig. 1):
unfaulted volcanics, faulted volcanics, debris volcanics, and detachment surfaces.
The ridge axis and a coherent tilted block located between hydrothermal sites TAG and Mir are character- ized by unfaulted volcanics. The area next to the axis displays faulted volcanics in the center and South (Fig. 3, sections A, B, C and D) and a new detachment surface near Shimmering Mound. Eastwards, debris volcanics characterized by smooth morphology and fine-grained texture are prominent in the center and North (sections A, B, and C). Further east, outcropping detachment surfaces display the typical corrugations over a gently sloping detachment surface.
A
D C B
unfaulted
volcanics debris
volcanics
detachmen t
surface unfaulted
volcanics detachmen
t
serpentinit e
Shimmering
1
5 A
unfaulted
volcanics faulted blocksvolcanics detachmen t
surface
2 D
unfaulted
volcanics strongly faulted volcanics
detachmen t
surface
4 B
3
C
unfaultedvolcanics
faulted blocks volcanics
debris volcanics
detachmen t
surface unfaulted blockvolcanics
TAG MIR
-3,925 -3,600 -3,400 -3,200 -3,000m
W E
W E
W E W E
Vertical exaggeration 2:1
Figure 3. Schematic cross sections A–D and their location on a 3D bathymetric view of the study area. On the sections, thick black lines mark the detachment faults and surfaces (dashed: abandoned); thin black lines, other faults. On the left, at the ridge axis, thin black lines symbolize dykes rising from transient magma bodies to volcanoes. Red triangles represent known hydrothermal systems projected on the section. Patterns indicate volcanics (horizontal dotted lines) and debris volcanics (random points).
Detachment surface depth (Figs 3 and 4) is poorly constrained under the debris and faulted volcanics. Seismic profiling in the Shimmering area provides a depth of ~350 m beneath the debris volcanics. We anticipate that the detachment surface is deeper under faulted volcanics, with a depth of ~600 m under TAG24–28. Indeed, Section C successively displays the different morphologies as the detachment deepens toward the axis.
SE NW
4.500
4.600
4.700
4.800
3750 4000 4250 4500 4750 5000 5250 5500 5750
et:
4.500
4.600
4.700
4.800
4.900
500m 100ms TWT
MCS 19
MCS 02
4.500 4.600 4.700 4.800 4.900 5.000 5.100 5.200
3500 3750 4000
4.500 4.600 4.700 4.800 4.900 5.000 5.100 5.200
MCS 27 MCS 19
MCS 02
SW NE
4.500 4.600 4.700 4.800 4.900 5.000 5.100 5.200
3500 3750 4000
4.500 4.600 4.700 4.800 4.900 5.000 5.100 5.200
MCS 27 MCS 19
MCS 02
SW NE
SE NW
4.500
4.600
4.700
4.800
3750 4000 4250 4500 4750 5000 5250 5500 5750
4.500
4.600
4.700
4.800
4.900
MCS 19
MCS 02 500m
100ms TWT
250m 100ms TWT
250m 100ms TWT
4.500
4.600
4.700
4.800
4.900
3750 4000 4250 4500 4750 5000 5250 5500
et:
4.500
4.600
4.700
4.800
4.900 MCS 02
MCS 27Shimmering
500m 100ms TWT
4.500
4.600
4.700
4.800
4.900
3750 4000 4250 4500 4750 5000 5250 5500
4.500
4.600
4.700
4.800
4.900 MCS 02
MCS 27Shimmering
500m 100ms TWT
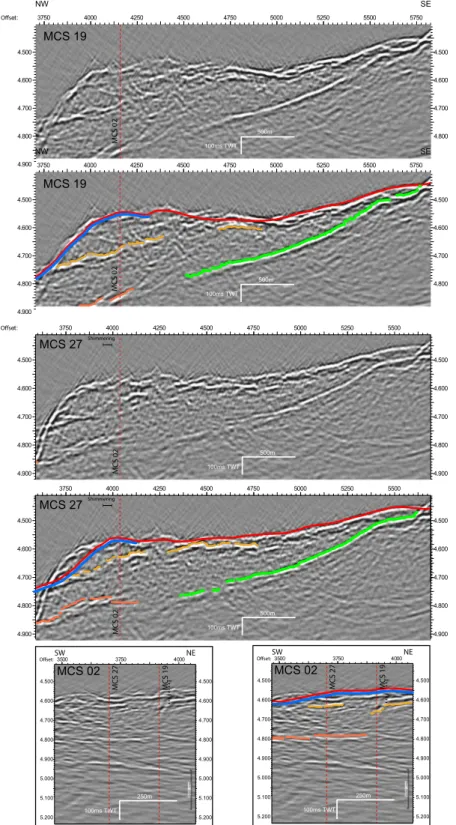
Figure 4. Seismic sections MCS19, 27 and 02 (see Fig. 1 for location) with interpretation of major reflections.
Red vertical dashed lines indicate cross points of the seismic network. Regional bathymetry (red) is overlain on the seismic section. Discrepancies indicate the complex tectonic structure imaged in seismic data by strong side echoes. Green lines indicate the outline of the smooth dipping old detachment, blue lines mimicking the seafloor mark the steeper new detachment surface.
Two parameters account for the different fracturing of the volcanic material. The first one is the thickness of these volcanics, with the fault interval maintaining a regular aspect ratio in the resulting blocks. A deep detachment generates large coherent blocks bound by a few major faults, whereas a shallower one results in a dense network of small faults.
The second parameter is the age of these volcanics, with faulted volcanics near the axis and debris volcanics eastwards at the foot of the detachment surface. The increasing fracturing of the volcanics with time suggests that earthquakes generated on the deep detachment fault at the axis affect the material overlying the detachment surface. Corresponding tremor has progressively broken large blocks apart, later developing a network of smaller faults and ultimately incoher- ent debris volcanics. In this framework, the various sections may represent different steps of a detachment evolution, from its birth to its demise (Fig. 3). These two parameters concur in shaping the morphology of the study area.
The major characteristic of a detachment is the asymmetric accretion of new lithosphere at the ridge axis. The location of the deep, subvertical detachment fault with respect to the hanging wall plate does not change as the footwall plate is progressively exhumed. The subhorizontal detachment surface affects only the shallow crust.
With the presence of water, hard peridotite alters to soft serpentinite. As the footwall rises, serpentinite deforms and sags, resulting in the flattening detachment surface that carries away volcanic material formed at the axis. The amount of volcanic material determines how far from the axis the detachment surface outcrops.
Gentle slopes and corrugations consistently observed to the East of the study area support the presence of a single detachment in the whole study area. Conversely, the western part displays contrasted morphologies lead- ing us to distinguish four corridors (Sections A-D) separated by deeper, apparently stable (as suggested by the absence of tilt) narrow transition zones. As previously suggested, variations in the thickness and age of the vol- canics accreted to the detachment surface, and therefore the amount of magma produced at the axis, explain these contrasted morphologies. Ultimately, the magmatic activity is controlled by the thermal influx at the axis.
The subvertical detachment fault roots on the plate boundary, at the lithosphere-asthenosphere boundary, where the thermal flux is maximal and transient magma bodies may be present. Due to the asymmetry, both the thermal anomaly and the detachment remain fixed with respect to the hanging wall plate (Sections B-D)29. On Section A, the magmatic activity has weakened, as testified by the thin debris volcanics and the absence of other volcanics.
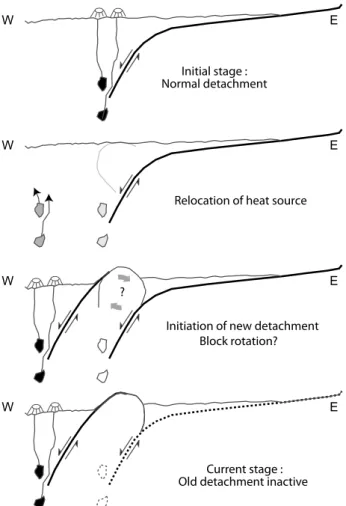
Moreover, the area of axial unfaulted volcanics is narrow, suggesting volcanic activity has recently resumed. In the absence of a strong thermal anomaly, bulk extension became prominent, subvertical conjugate faults (to be later rotated to the observed subhorizontal reflections) developed on the hanging wall, and the deep detachment fault was progressively dragged eastwards (Fig. 5). When the thermal anomaly and volcanic activity resumed, the old detach- ment was no longer properly located and ceased, and the new detachment rooted on the thermal anomaly took over.
W E
W E
W E
W E
Initial stage : Normal detachment
Relocation of heat source
Initiation of new detachment Block rotation?
Current stage : Old detachment inactive
?
Figure 5. Four stages of evolution of the Shimmering Hill area illustrating the demise of the old detachment and initiation of the new one as a result of magmatic sources relocation.
Methods
initial data processing. For deep-sea magnetic measurements collected by AUV Abyss, a vector magnetom- eter is rigidly fixed to the frame of the vehicle. Due to the proximity of the magnetometer to the vehicle, raw data are strongly affected by its magnetic effect. This influence is estimated and removed using a method developed by Isezaki30 and Honsho et al.31 to resolve the crustal magnetic anomaly. A calibration pattern made up of a suc- cession of “figures-8” and ascents/descents in the N-S and E-W directions is performed at the beginning of the dive, when the AUV is far away from both the ship and the seafloor. The data collected during calibration should amount to the local geomagnetic field predicted by the International Geomagnetic Reference Field32 (IGRF).
Any variation from this assumption is seen as a consequence of the magnetic effect of the vehicle. Using this cali- bration pattern, we estimate the magnetic susceptibility tensor (9 coefficients) and the remanent magnetization vector (3 coefficients) of the AUV and remove its magnetic effect from the data31.
Because the geomagnetic field is generally not vertical, magnetic anomalies are often made of two lobes not centered above their sources, making them difficult to interpret. Reduction to the Pole is an operator which cor- rects the inclination and declination of the geomagnetic field and magnetization vectors and relocate the anoma- lies above their sources, as if they were observed at the geomagnetic pole.
constraining the source of the magnetic anomalies. The depth of the dominating sources producing magnetic anomalies varies as a function of the altitude of acquisition. Data collected at a low altitude are charac- terized by a high amplitude and short-wavelength content corresponding to outcropping or shallow subseafloor sources. With such data, it is possible to image small dimension structures such as hydrothermal systems. The wavelength content decreases and the dominating sources deepen with increasing altitudes. Using data collected at various altitudes above a magnetized source makes possible to constrain its geometry. Two types of AUV dives were undertaken during the M127 cruise: standard dives at altitudes of 70–120 m above the seafloor for a wide regional survey (Fig. 1) and specific dives at lower altitude, focusing on hydrothermal targets. Therefore three datasets collected at various altitudes exist for the Mir and Shinkai/Southern/Rona/New Mounds areas. On the active TAG Mound, we compare high-resolution magnetic data collected by Deep-Sea Submersible Alvin in 19938 and the German AUV Abyss in 2016.
Reduced-to-the-Pole (RTP) anomalies may still show some deviation with respect to their putative source. We consider two possible causes for such deviations: either the magnetization vector causing the anomalies (i.e. the underlying block of a basalt-hosted hydrothermal site or the magnetized stockwork zone of an ultramafic-hosted site) has been tilted, or the geometry of the source (for instance a hydrothermal conduit) is inclined.
We estimate possible tilt of the magnetization vector on the dataset collected at the lowest altitude, because very shallow sources dominate and the effect of slanted magnetized bodies is low. In addition, the correlation of anomalies and bathymetric features is easier on this dataset of highest resolution. We determine the optimum tilt angle that moves the anomaly above its source16. The other datasets are corrected using this optimal tilt angle and the position of the magnetic low on the datasets at different altitudes allow calculating the inclination of the demagnetized hydrothermal conduit. We use forward modeling to estimate the apparent tilt induced by such inclined conduit and determine the tectonic tilt32.
Data Availability
Bathymetric data products from AUV dives conducted during RV Meteor cruise M127 are available under:
https://doi.pangaea.de/10.1594/PANGAEA.899415.
References
1. Cannat, M. Emplacement of mantle rocks in the sea or at mid-ocean ridges. J. of Geophys. Res. 98, 4163–4172 (1993).
2. Gente, P. et al. Characteristics and evolution of the segmentation of the Mid-Atlantic Ridge between 20°N and 24°N during the last 10 million years. Earth Planet. Sci. Lett. 129, 55–71 (1995).
3. Cannat, M. et al. Modes of seafloor generation at a melt-poor ultraslow spreading ridge. Geology 34, 605–608 (2006).
4. Smith, D. K., Cann, J. R. & Escartin, J. Widespread active detachment faulting and core complex formation near 13°N on the Mid- Atlantic Ridge. Nature 443, 440–444 (2006).
5. Schouten, H., Smith, D. K., Cann, J. R. & Escartín, J. Tectonic versus magmatic extension in the presence of core complexes at slow- spreading ridges from a visualization of faulted seafloor topography. Geology 38, 615–618, https://doi.org/10.1130/G30803.1 (2010).
6. Cann, J. R. et al. Corrugated slip surfaces formed at ridge-transform intersections on the Mid-Atlantic Ridge. Nature 385, 329–332 (1997).
7. Tucholke, B. E., Lin, J. & Kleinrock, M. C. Megamullions and mullion structure defining oceanic metamorphic core complexes on the Mid-Atlantic Ridge. Jour. Geophys. Res. 103, 9857–9866 (1998).
8. Tivey, M. A., Rona, P. A. & Schouten, H. Reduced crustal magnetization beneath the active sulfide mound, TAG hydrothermal field, Mid-Atlantic Ridge, at 26°N. Earth Planet. Sci. Lett. 115, 101–115 (1993).
9. Tivey, M. A. & Johnson, H. P. Crustal magnetization reveals subsurface structure of Juan de Fuca Ridge hydrothermal vent fields.
Geology 30, 979–982 (2002).
10. Tivey, M. A. & Dyment, J. The magnetic signature of hydrothermal systems in slow-spreading environments, in Rona, P. A. et al. eds, Diversity of hydrothermal systems on slow spreading ocean ridges. American Geophysical Union Geophysical Monograph 188, 43–66, 2010.
11. Zhu, J. et al. A reduced crustal magnetization zone near the first observed active hydrothermal vent field on the Southwest Indian Ridge. Geophys. Res. Lett. 37, L18303 (2010).
12. Fujii, M. et al. High-resolution magnetic signature of active hydrothermal systems in the back-arc spreading region of the Southern Mariana Trough. J. Geophys. Res. 120(5), 2821–2837, https://doi.org/10.1002/2014JB011714 (2015).
13. Szitkar, F., Dyment, J., Fouquet, Y. & Choi, Y. What causes low magnetization at basalt-hosted hydrothermal sites? Insights from inactive site Krasnov (MAR 16°38′N). Geochem. Geophys. Geosyst. 15, 1441–1451 (2014).
14. Szitkar, F., Dyment, J., Fouquet, Y., Honsho, C. & Horen, H. The magnetic signature of ultramafic-hosted hydrothermal sites. Geology 42, 715–718 (2014).
15. Szitkar, F. et al. Magnetic exploration of a low-temperature ultramafic-hosted hydrothermal site (Lost City, 30°N, MAR). Earth Planet. Sci. Lett. 461, 40–45, https://doi.org/10.1016/j.epsl.2016.12.033 (2017).
16. Szitkar, F. & Dyment, J. Near-seafloor magnetics reveal tectonic rotation and deep structure at TAG (Trans-Atlantic Geotraverse) hydrothermal site (Mid-Atlantic Ridge, 26°N). Geology 43, 87–90 (2015).
17. Rona, P. A. TAG hydrothermal Field: Mid-Atlantic Ridge crest at latitude 26°N. Geological Society of London. Journal 137, 385–402 (1980).
18. Ade-Hall, J. M., Palmer, H. C. & Hubbard, T. P. The magnetic and opaque petrological response of basalt to regional hydrothermal alteration. Geophys. J. R. Astron. Soc. 24, 137–174 (1971).
19. Johnson, H. P. & Pariso, J. E. The effects of hydrothermal alteration on the magnetic properties of oceanic crust: Results from drill holes CY-2 and CY-2a, in Cyprus Crustal Study Project: Initial Report, Holes CY2 and 2a, edited by P. T. Robinson, I. L. Gibson and A. Panayiotou. Geol. Surv. Can. 283–293 (1987).
20. Watkins, N. D. & Paster, T. P. The magnetic properties of igneous rocks from the ocean floor, Philos. Trans. R. Soc. London 268, 507–550 (1971).
21. Toft, P. B., Arkani-Hamed, J. & Haggerty, S. E. The effects of serpentinization on density and magnetic susceptibility; a petrophysical model. Physics of the Earth and Planetary Interiors 65, 137–157, https://doi.org/10.1016/0031-9201(90)90082-9 (1990).
22. Rona, P. A. et al. Active and relict seafloor hydrothermal mineralization at the TAG hydrothermal field, Mid-Atlantic Ridge. Econ.
Geol. 88, 1989–2017 (1993).
23. Rona, P. A. et al. An Active, low-temperature hydrothermal mound and a large inactive sulfide moint found in the TAG hydrothermal field, Mid-Atlantic 26°N, 45°W. Eos Trans. AGU 79, F920 (1998).
24. Bohnenstiehl, D. R. & Kleinrock, M. C. Faulting and fault scaling on the median valley floor of the Trans-Atlantic Geotraverse (TAG) segment, 26°N on the Mid-Atlantic Ridge. J. Geophys. Res. 104, 29351–29364, https://doi.org/10.1029/1999JB900256 (1999).
25. Tivey, M. A., Schouten, H. & Kleinrock, M. C. A near-bottom magnetic survey of the Mid-Atlantic Ridge axis at 26°N: Implications for the tectonic evolution of the TAG segment. J. Geophys. Res. 108, 2277, https://doi.org/10.1029/2002JB001967 (2003).
26. deMartin, B. J., Sohn, R., Canales, J. P. & Humphris, S. E. Kinematics and geometry of active detachment faulting beneath the Trans- Atlantic Geotraverse (TAG) hydrothermal field on the Mid-Atlantic Ridge. Geology 35, 711–714 (2007).
27. Canales, J. P., Sohn, R. A. & deMartin, B. Crustal structure of the Trans-Atlantic Geotraverse (TAG) segment (Mid-Atlantic Ridge, 26°N): Implication for the nature of hydrothermal circulation and detachment faulting at slow spreading ridges. Geochem. Geophys.
Geosyst. 8, https://doi.org/10.1029/2007GC001629 (2007).
28. Zhao, M., Canales, J. P. & Sohn, R. A. Three-dimensional seismic structure of a Mid-Atlantic Ridge segment characterized by active detachment faulting (Trans-Atlantic Geotraverse, 25°55′N-26°20′N). Geochem. Geophys. Geosyst. 13, https://doi.org/10.1029/
2007GC001629 (2012).
29. Reston, T. Flipping detachments: the kinematics of ultraslow spreading ridges. Earth Planet. Sci. Lett. 503, 144–157 (2018).
30. Isezaki, N. A new shipboard three-component magnetometer. Geophysics 51, 1992–1998 (1986).
31. Honsho, C. et al. Magnetic structure of a slow-spreading ridge segment: insight from near-bottom magnetic measurement onboard a submersible. J. Geophys. Res. 114, BO5101 (2009).
32. Thebault, E. et al. International Geomagnetic Reference Field: The 12th generation. Earth, Planets and Space 67, https://doi.
org/10.1186/s40623-015-0228-9 (2015).
Acknowledgements
This research was supported by a grant from the EU-FP7-Project “Blue Mining: Breakthrough Solutions for the Sustainable Deep Sea Mining Value Chain” under grant No. 604500. We thank the officers and crew of R/V Meteor, the GEOMAR technical team of AUV Abyss and Cruise M127 scientific party for excellent work at sea.
This is JAMSTEC contribution xxx, IPGP contribution xxx. GEOMAR Helmholtz Center for Ocean Research (Kiel, Germany) supported this Research.
Author contributions
F.S. and J.D. performed the data analysis and wrote the paper with contributions from S.P., J.B., M.K. and S.G. S.P.
designed and led the data acquisition. J.B. and D.K. processed and interpreted the seismic profiles. I.Y. processed the high-resolution bathymetry. S.P. and B.J.M. led the EU-FP7-Project “Blue Mining: Breakthrough Solutions for the Sustainable Deep Sea Mining Value Chain”.
Additional information
Supplementary information accompanies this paper at https://doi.org/10.1038/s41598-019-47974-z.
Competing Interests: The authors declare no competing interests.
Publisher’s note: Springer Nature remains neutral with regard to jurisdictional claims in published maps and institutional affiliations.
Open Access This article is licensed under a Creative Commons Attribution 4.0 International License, which permits use, sharing, adaptation, distribution and reproduction in any medium or format, as long as you give appropriate credit to the original author(s) and the source, provide a link to the Cre- ative Commons license, and indicate if changes were made. The images or other third party material in this article are included in the article’s Creative Commons license, unless indicated otherwise in a credit line to the material. If material is not included in the article’s Creative Commons license and your intended use is not per- mitted by statutory regulation or exceeds the permitted use, you will need to obtain permission directly from the copyright holder. To view a copy of this license, visit http://creativecommons.org/licenses/by/4.0/.
© The Author(s) 2019