Assessment of Feedbacks in the Earth System under Anthropogenic Forcing: Two Case Studies
Dissertation
ZUR
E
RLANGUNG DESD
OKTORGRADESDER
M
ATHEMATISCH- N
ATURWISSENSCHAFTLICHENF
AKULTÄTDER
C
HRISTIAN-A
LBRECHTS-U
NIVERSITÄT ZUK
IELVORGELEGT VON
T
RONJEP
EERK
EMENAK
IEL, O
KTOBER2017
ii
1. Gutachter: Prof. Dr. Andreas Oschlies 2. Gutachterin: Prof. Dr. Katja Matthes Referent: Prof. Dr. Andreas Oschlies Koreferent: Prof. Dr. Katja Matthes Disputationsdatum: 15.12.2017
Zum Druck genehmigt
gez. Prof. Dr. Natascha Oppelt, Dekanin
iv
Summary
Feedbacks determine the sensitivity of the Earth system to perturbations. In the last centuries, the Earth system has been undergoing substantial changes caused to a great extent from the human activity. Nowadays, it is well documented that global warming is mainly driven by the anthropogenic emissions of greenhouse gases. In the future, these emissions will likely continue and lead to further climate warming. Large-scale climate engineering projects are human actions proposed to counteract climate warming.
However, these projects could also cause unintentionally perturbations to the Earth system or its subsystems.
Scientists apply models to estimate the impact of these anthropogenic forcings on the Earth system in future projections. Therefore it is important that feedbacks are well represented in these models to make reliable predictions.
The aim of this PhD thesis is to advance the research in feedbacks and their response to anthropogenic forcing in the Earth system or its subsystems. Two case studies are carried out with a focus on a) the atmospheric feedbacks in North Africa driven by an irrigated afforested Sahara, and b) the biogeochemical feedbacks related to the phosphorus cycle and its link to oceanic deoxygenation.
Regarding the first case study, the irrigated afforestation of the Sahara has been proposed as a climate engineering method to sequester a substantial amount of carbon dioxide from the atmosphere, which might potentially be effective to mitigate climate change. Substantial amounts of irrigation are required to sustain the artificial forest.
Enhanced evapotranspiration would moisten the Saharan air. Its impact on the global atmospheric hydrological cycle and circulation is widely unexplored.
In this thesis, a state-of-the-art Earth system model is used for the first time to investigate in detail atmospheric feedbacks and their side effects due to such a large- scale afforestation project.
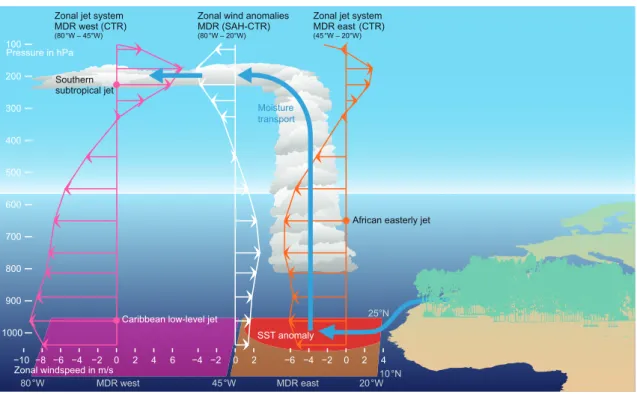
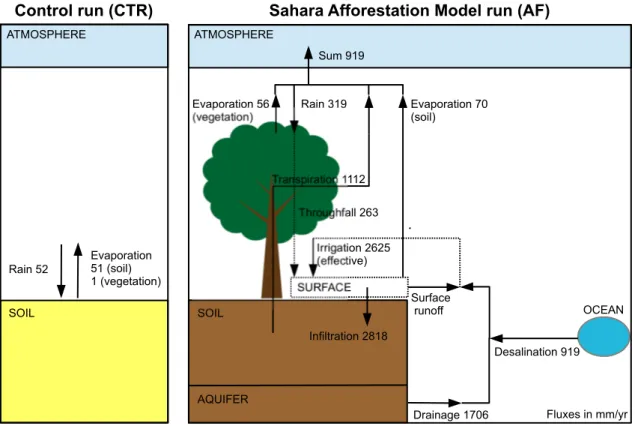
Atmospheric feedbacks reduce the precipitation potential over an afforested Sahara and raise questions about the self-sustainability of such an artificial forest. Only 26% of the evapotranspirated water re-precipitates over the Sahara, considerably large amounts are advected southward to the Sahel zone and westward to the North Atlantic.
In the Sahel zone, a complex atmospheric circulation feedback and the adaptation of the Tropical easterly jet and African easterly jet to the afforestation lead to an enhancement of the West African Monsoon precipitation.
In the North Atlantic tropical cyclones (TCs) are intensified. Advection of humidity from the afforested Sahara to the North Atlantic improves environmental conditions for the development of Atlantic TCs. The Saharan afforestation has a considerably larger impact on the TC development than a worst-case global warming scenario.
Regarding the second case study, observations indicate ongoing deoxygenation in the ocean and the expansion of suboxia both likely driven by climate change. Previous studies of former oceanic anoxic events proposed a link between large-scale deoxygenation and ocean phosphorus (P) inventory. Under climate warming, weathering supplies additional P to the ocean, which in turn promotes ocean productivity and deoxygenation. A feedback between benthic release of P and ocean biological productivity, the so-called oxygen productivity feedback, could further enhance the deoxygenation. Models are applied to predict future expansion of suboxia, but most of these models show still a lack in simulating the present-day trend in the decline of the oceanic oxygen inventory. This indicates that still large uncertainties exist
vi
and that it is necessary to reevaluate feedbacks, which are related to the deoxygenation process.
In this thesis, an Earth system model of intermediate complexity is used to investigate feedbacks and their uncertainties between the P cycle and the deoxygenation in the ocean in a business-as-usual scenario on millennial timescales. Model results confirm the link between marine P inventory and ocean deoxygenation; until year 5000, a 4 to 5- fold expansion of suboxic water volume occur. Low oxygen bottom waters lead to a release of P from ocean sediments, which might cause further expansions of suboxia due to the oxygen productivity feedback. However, this feedback has a minor impact on deoxygenation in this study.
In addition, expanding suboxia leads to an increase in denitrification and thus to nitrogen limitation and a decrease in biological productivity. This negative feedback limits the utilization of the added P. Since nitrogen fixation is not able to counteract the nitrogen loss due to denitrification, considerably large amounts of the added P leave the ocean surface unused as preformed P.
Finally, model uncertainties are investigated. Model simulations show a large spread in weathering and benthic fluxes of P. Consequentially, the suboxic volume ranges between 1 and 5% of the whole ocean volume in year 5000. Different assumptions for weathering parameters, the representation of slope and shelfs in the model bathymetry, different parametrization of benthic fluxes and limits to the benthic P release by a simple sediment P inventory, all these factors have a large impact on the results. For example, the limited inventory of P further reduces the effect of the oxygen productivity feedback on the deoxygenation.
This PhD thesis advances the understanding of the North African climate system and their feedbacks under an artificial large-scale afforestation scenario. It reveals the potential and unintentional side effects of such a climate engineering project.
Furthermore, this thesis discusses to what extent human activity could drive the global ocean suboxic or anoxic and reassessed the relevance of the different feedbacks for the deoxygenation of the ocean.
Zusammenfassung
Feedbacks bestimmen die Sensititvität des Erdsystems und des Klimas gegenüber Störungen. In den letzten Jahrhunderten hat das Erdsystem erhebliche Klimaveränderungen erfahren, die in hohem Maße vom Menschen verursacht wurden.
Aktuelle Studien zeigen, dass die globale Erwärmung hauptsächlich durch die anthropogenen Emissionen von Treibhausgasen verursacht wird. Diese Emissionen werden vermutlich noch länger andauern und zu einer weiteren Klimaerwärmung führen. Groß angelegte Climate Engineering Projekte sind Maßnahmen um dieser Klimaerwärmung entgegenzuwirken. Diese Projekte könnten jedoch auch zu unbeabsichtigten Veränderungen im Erdsystems führen.
Die Wissenschaftler wenden Erdsystemmodelle an, um den anthropogenen Einfluss das Erdsystem abzuschätzen. Dabei ist es wichtig, dass Feedbacks in diesen Modellen gut repräsentiert werden, um zuverlässige Vorhersagen zu treffen.
In dieser Doktorarbeit werden Feedbacks und deren Auswirkungen auf das Erdsystem oder dessen Subsystemen untersucht. Zwei Fallstudien wurden durchgeführt mit Fokus auf a) die atmosphärischen Feedbacks hervorgerufen durch die Bewässerung und Aufforstung der Sahara und b) biogeochemische Feedbacks im Zusammenhang mit dem Phosphorzyklus und der Abnahme von Sauerstoff im Ozean.
In früheren Studien wurde die Bewässerung und Aufforstung der Sahara als eine Climate Engineering Methode vorgeschlagen, um die atmosphärische Konzentration von Kohlenstoffdioxid zu reduzieren, was möglicherweise zur Abschwächung der Klimaerwärmung führen könnte. Große Mengen an Wasser sind jedoch notwendig, um die gepflanzten Bäume zu bewässern. Dies würde zu einer erhöhten Evapotranspiration und zu einer erhöhten Luftfeuchtigkeit in der Luft über der Sahara führen. Die daraus resultierenden Auswirkungen auf die atmosphärische Zirkulation und auf den globalen Wasserkreislauf sind weitestgehend unerforscht.
In der ersten Fallstudie wird erstmals ein hochmodernes Erdsystemmodell angewendet, um atmosphärische Feedbacks und deren Nebenwirkungen hervorgerufen durch die Bewässerung und Aufforstung der Sahara im Detail zu untersuchen.
Atmosphärische Feedbacks reduzieren das Niederschlagspotenzial über einer aufgeforsteten Sahara, was die Frage aufwirft, ob ein künstlicher Wald in der Sahara nachhaltig sein kann. Nur 26% des durch Evapotranspiration verlorenen Wassers regnet wieder über der Sahara aus, beträchtliche Mengen werden nach Süden in die Sahelzone und nach Westen in den Nordatlantik transportiert.
In der Sahelzone führen komplexe Feedbacks der atmosphärischen Zirkulation und Veränderungen des Tropical Easterly Jets und des African Easterly Jets durch die Aufforstung zu verstärkten Niederschlägen während des Westafrikanischen Monsuns.
Im Nordatlantik werden tropische Wirbelstürme (TWs) verstärkt. Feuchtigkeit wird von der Sahara in den Nordatlantik transportiert. Die dort erhöhte Luftfeuchtigkeit verbessert die Bedingungen für die Entstehung und Entwicklung von atlantischen TWs.
Die Aufforstung der Sahara hat auf die Entwicklung der TWs einen wesentlich größeren Einfluss als in einem Business-as-usual Szenario.
In der zweiten Fallstudie wird der anthropogene Einfluss auf die Entstehung von Suboxia untersucht. Beobachtungen deuten auf eine fortschreitende Abnahme der Sauerstoffkonzentration im Ozean und eine Ausdehnung der Suboxia hin, was potentiell auf den Klimawandel zurückzuführen ist. Paleo Studien von ozeanischen anoxischen Ereignissen fanden einen Zusammenhang zwischen globaler Abnahme von Sauerstoff im Ozean und dem Phosphor (P) Inventar des Ozeans. Eine Zunahme der terrestrischen
viii
Verwitterung von P durch die Klimaerwärmung führt zu einer Zunahme von P im Ozean, was wiederum die marine biologische Produktivität stimuliert und damit zu einer Abnahme von Sauerstoff im Ozean führt. Ein Feedback zwischen der benthischen Freisetzung von P und der biologischen Produktivität im Ozean, der Sauerstoff- Produktivitäts Feedback, könnte die Sauerstoffabnahme weiter beschleunigen. Modelle werden verwendet, um die zukünftige Ausdehnung von Suboxia vorherzusagen. Die meisten dieser Modelle zeigen jedoch immer noch Defizite bei der Simulation des gegenwärtigen Trends in der Sauerstoffabnahme. Dies könnte auf Unsicherheiten im Hinblick auf die genannten Feedbacks hinweisen.
In dieser Arbeit wird ein Erdsystemmodell mit mittlerer Komplexität verwendet, um Feedbacks zwischen dem P-Kreislauf und der Sauerstoffabnahme im Ozean in einem Business-as-usual Szenario auf Zeitskalen von tausenden Jahren und deren Unsicherheiten zu untersuchen. Die Modellergebnisse bestätigen den Zusammenhang zwischen dem P-Inventar des Ozeans und der Sauerstoffabnahme. Bis zum Jahr 5000 nimmt das suboxische Ozeanvolumen um das 4 bis 5-fache zu. Suboxisches Bodenwasser führt hierbei zu einer Freisetzung von P von den Ozeansedimenten, was eine weitere Ausbreitung von Suboxia verursachen könnte. In diesem Modell hat der Sauerstoff-Produktivitäts Feedback jedoch einen geringen Einfluss auf die Sauerstoffabnahme im Ozean. Insbesondere limitiert das begrenzte P-Inventar im Sediment die Freisetzung von P und damit auch den Feedback.
Darüber hinaus führen Ausbreitung der Suboxia auch zu einer Zunahme der Denitrifikation und damit zu einer Stickstofflimitierung und einer Abnahme der biologischen Produktivität. Dieser negative Feedback begrenzt die Aufnahme des hinzugefügten Ps. Da die Stickstofffixierung den durch die Denitrifikation verursachten Stickstoffverlust nicht kompensieren kann, bleiben große Mengen an P in der oberflächennahen Mischungsschicht des Ozeans ungenutzt.
Abschließend wurden Modellunsicherheiten untersucht. Die Modellsimulationen zeigen eine große Streuung bezüglich der Verwitterung und der benthischer Flüssen von P.
Unterschiedliche Annahmen für Verwitterungsparameter, die bessere Darstellung von Schelfen in der Modell-Bathymetrie, unterschiedliche Parametrisierung benthischer Flüsse und die Begrenzung der benthischen P-Freisetzung durch ein einfaches P- Inventar im Sediment hat einen großen Einfluss auf die Ergebnisse. Folglich liegt das suboxische Volumen im Jahr 5000 zwischen 1 und 5% des gesamten Ozeanvolumens.
Diese Dissertation verbessert das wissenschaftliche Verständnis des nordafrikanischen Klimasystems und deren Feedbacks im Rahmen eines Aufforstungsszenarios der Sahara. Das Potential und die unbeabsichtigten Nebenwirkungen eines solchen Climate Engineering Projekts werden aufgezeigt. Darüber hinaus wird in dieser Arbeit diskutiert, inwieweit der anthropogene Einfluss den globalen Ozean in einen suboxischen oder in einen anoxischen Zustand führen könnte. Die unterschiedliche Relevanz der Feedbacks für die Sauerstoffabnahme im Ozean wird neu beurteilt.
x
Acknowledgements
First and foremost, I want to deeply thank both Andreas Oschlies and Katja Matthes for giving me the opportunity to perform my research as a doctoral candidate and write this PhD thesis. Without their guidance and financial support, this dissertation would not have been possible.
I would like to thank my primary advisor Andreas Oschlies for his supervision and his valuable contribution to my project, for trusting me, for securing funds for me but above all for giving me the freedom of individual research and for allowing me to evolve as a scientist.
I would also like to express my appreciation and gratitude to my advisor Katja Matthes for constantly offering me her support and advice and for contributing to the financing of my research. Her meticulous comments were an enormous help to me and improved significantly the manuscripts.
I am very grateful to my colleagues Thomas Martin, Iris Kriest, Wolfgang Koeve, Klaus Wallmann, Ulrike Löptien, Heiner Dietze, Daniela Niemeyer, Katrin Meissner, Sebastian Wahl, Christiane Schelten, Andy Dale, Rita Erven and Angela Landolfi for the excellent collaboration, the interesting discussions, their insightful comments and suggestions on my manuscripts.
I also like to thank my colleagues Fabian Reith, Wanxuan Yao and all the colleagues from the Biogeochemical Modeling Group of GEOMAR for creating an excellent working environment throughout my time as a PhD student and for the nice discussions.
On a personal level, I would like to thank my family, especially my parents, for their support on my pursuits and for initiating my intellectual development and my interest for science from an early age on. I also want to deeply thank my girlfriend Evangelia Louropoulou for her great support, for her endless patience, for cheering me up and for giving me hope in times when I felt desperate. Finally, I thank all my friends for being tolerant and supportive throughout my journey.
Thank you all!
Tronje Kemena
xii
Content
Summary ... v
Zusammenfassung ... vii
Acknowledgements ... xi
1. Introduction ... 1
1.1 Motivation and outline ... 1
1.2 General Introduction ... 3
1.2.1 Early signs of human climate intervention: The Ruddiman Hypothesis ... 3
1.2.1.1 A linear concept for climate feedbacks: Climate sensitivity, forcing and climate effect ... 4
1.2.2 Model complexity and the representation of Earth system feedbacks ... 5
1.3 Atmospheric feedbacks in the North African climate system ... 6
1.3.1 Vegetation albedo feedback or Charney feedback ... 7
1.3.2 Vegetation water recycling feedback ... 7
1.3.3 Vegetation circulation feedback or soil moisture feedback ... 8
1.3.4 Dust precipitation feedback ... 9
1.3.5 Water vapor feedback ... 10
1.3.6 Cloud feedback ... 11
1.4 Mid-Holocene and artificial Green Sahara: Self-sustainability and feedbacks ... 11
1.5 Biogeochemical feedbacks related to the ocean oxygen inventory ... 12
1.5.1 Oxygen productivity feedback ... 13
1.5.2 Oxygen denitrification feedback ... 13
1.5.3 Phosphate burial feedback ... 14
1.6 Palaeo perspective: Oceanic anoxic events during cretaceous ... 15
1.7 Research Questions ... 16
1.8 Author contribution ... 18
2. Atmospheric Feedbacks in North Africa from an Irrigated, Afforested Sahara 21 2.1 Introduction ... 22
2.2 Methods ... 25
2.2.1 The Model ... 25
2.2.2 Experimental design ... 26
xiv
2.2.3 Interactive Irrigation Scheme ... 27
2.3 Regional Afforestation Effects ... 27
2.3.1 Temperature and Precipitation ... 27
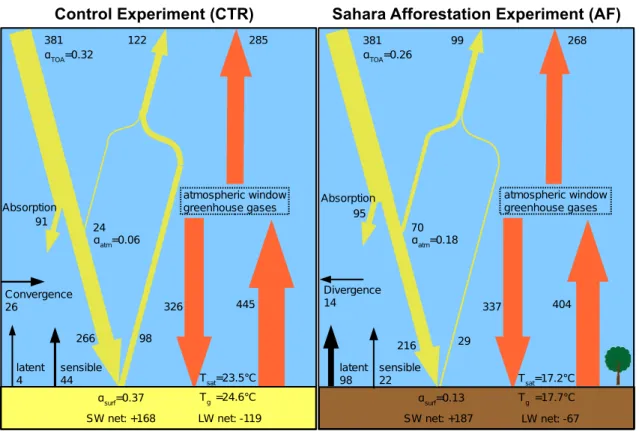
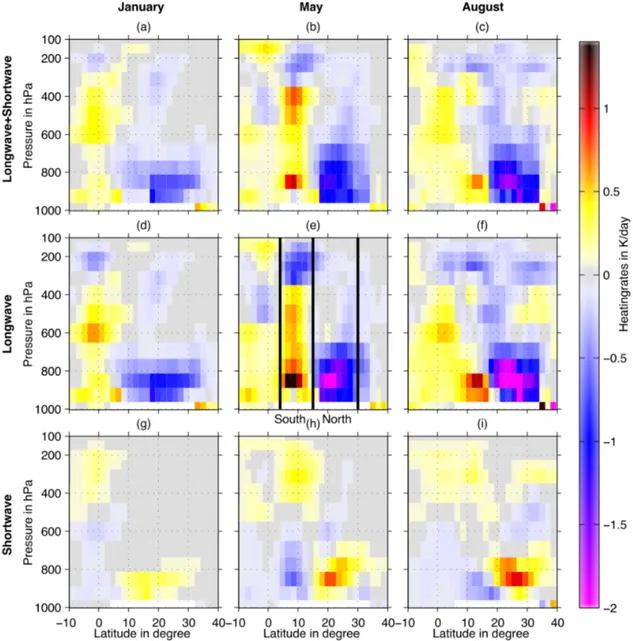
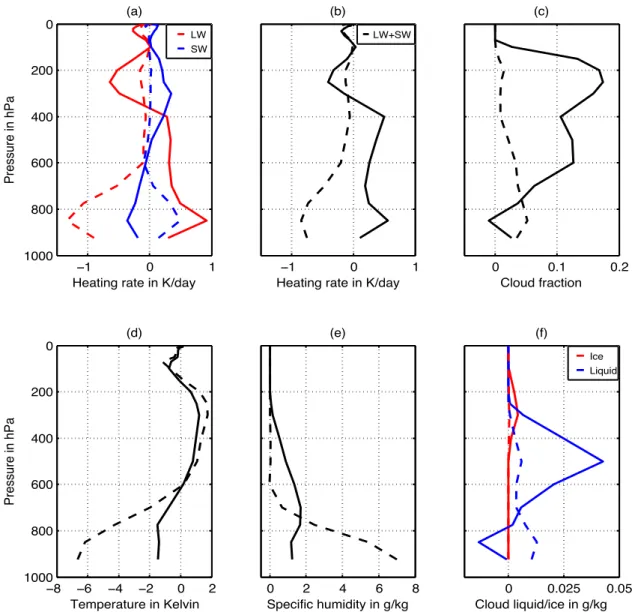
2.3.2 Saharan Radiation Budget ... 29
2.3.3 Soil and Atmosphere Water Budget and Self-Sustainability ... 30
2.4 Afforestation Effects on the West African Monsoon ... 32
2.4.1 Precipitation ... 32
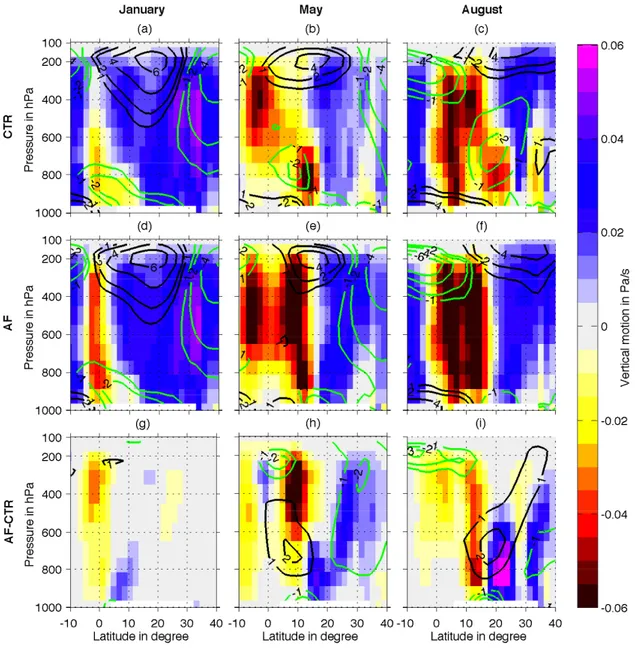
2.4.2 Meridional Atmospheric Circulation ... 33
2.4.3 Meridional Circulation Feedbacks ... 36
2.4.4 African Easterly Jet and Tropical Easterly Jet ... 40
2.5 Discussion ... 42
2.6 Summary ... 43
2.7 Appendix A ... 48
3. Consequences of an Irrigated, Afforested Sahara on the Development of Tropical Cyclones and Hurricanes in the Atlantic under recent and future climate 51 3.1 Introduction ... 52
3.2 Model Setup and TC Development Indices ... 54
3.3 Effects on Tropical Cyclone (TC) Development ... 56
3.3.1 SSTs and VMAX ... 56
3.3.2 Advection of Humidity and RH700 ... 58
3.3.3 Wind Shear U|850-200| ... 59
3.3.4 Seasonal Cycle of TC Indices ... 59
3.4 Conclusions and Discussion ... 61
3.5 Supplementary S3 ... 63
4. A model study of warming-induced phosphorus-oxygen feedbacks in open- ocean oxygen minimum zones on millennial timescales ... 69
4.1 Introduction ... 70
4.2 Methods ... 72
4.2.1 UVic Model ... 72
4.2.2 Phosphorus Cycle in UVic Model ... 73
4.3 Model Simulations ... 75
4.4 Simulated preindustrial equilibrium ... 75
4.5 Results ... 76
4.5.1 Simulated Climate ... 76
4.5.2 Phosphorus Dynamics ... 77
4.5.3 Oxygen Response ... 80
4.6 Uncertainties ... 81
4.7 Conclusions ... 82
4.8 Supplementary S4 ... 84
5. Ocean Phosphorus Inventory and Oceanic Deoxygenation: Large Uncertainties in Future Projections on Millennial Timescales ... 87
5.1 Introduction ... 88
5.2 Model and Experimental Design ... 90
5.2.1 Model ... 90
5.2.2 Experimental Designs ... 90
5.3 Uncertainties in Phosphorus Inventory ... 95
5.3.1 Land Fluxes: Weathering and Anthropogenic ... 96
5.3.2 Sediment Fluxes: Parameterizations, Sub-grid Bathymetry, Sediment Reservoir . 96 5.4 Oceanic Deoxygenation ... 99
5.4.1 Enhanced Biological Pump ... 100
5.4.2 Nitrogen Limitation ... 101
5.4.3 Temporal Variations of Deoxygenation Processes ... 102
5.5 Discussion and Conclusions ... 105
6. Overall conclusion and outlook ... 109
6.1 Summary and conclusion ... 109
6.2 Outlook and evaluation of project ideas ... 112 Bibliography ... I Abbreviations ... XVII Erklärung ... XXI
xvi
1
1. Introduction
1.1 Motivation and outline
It is widely accepted, and confirmed by observations, that human activity perturbs the global climate system. Because the global Earth system is highly complex, anthropogenic forcing leads not only to simple cause and effect relationships. Instead the whole Earth system interacts with the anthropogenic forcing, which could lead to further side-effects or to feedbacks. A feedback appears when the initial perturbation initiates a process or a chain of processes that again affects the perturbation itself.
Feedbacks can amplify or dampen the initial perturbation. The individual feedback strength can depend on the climate state onto which the perturbation is imposed (for example palaeo or present-day climate). Because feedbacks determine the sensitivity of the climate system to perturbations, it is crucial to understand their role in the Earth system. A better representation of feedbacks in models can help to predict the development of the climate and help to determine, if anthropogenic forcing could drive the Earth system or parts of the Earth system into a new equilibrium. At some point, during the transition from the former to the new equilibrium, positive feedbacks would overcome negative feedbacks. Beyond this point, the so-called tipping point, these feedbacks drive the climate into a new equilibrium even without additional anthropogenic forcing.
Fig. 1 Map of potential policy-relevant tipping elements in the climate system and global population density. They could be triggered this century and would undergo a qualitative change within this millennium. Tipping elements are excluded from the map systems, which qualitative change would appear beyond this millennium (e.g., ocean anoxia).
Question marks indicate systems whose status as tipping elements is particularly uncertain. Figure and caption adapted from Lenton et al. (2008).
cur immediately after the cause or much later. The definition encompasses equilibrium properties with threshold behavior as well as critical rates of forcing. In its equilibrium application, it includes all orders of phase transition and the most common bifurcations found in nature: saddle-node and Hopf bifurcations.
The definition could in principle be applied at any time, e.g., in Earth’s history. The feature of the system and the parameter(s) that influence it need not be climate variables. Critical condi- tions may be reached autonomously (without human interfer- ence), and natural variability could trigger a qualitative change.
Here we restrict ourselves to tipping elements that may be accessed by human activities and are potentially relevant to current policy. We define the subset of policy-relevant tipping elements by adding to condition 1 the following conditions:
2. Human activities are interfering with the system!such that decisions taken within a ‘‘political time horizon’’ (TP"0) can determine whether the critical value for the control!crit is reached. This occurs at a critical time (tcrit) that is usually withinTPbut may be later because of a commitment to further change made duringTP.
3. The time to observe a qualitative change plus the time to trigger it lie within an ‘‘ethical time horizon’’ (TE);tcrit#T"
TE.TErecognizes that events too far away in the future may not have the power of influencing today’s decisions.
4. A significant number of people care about the fate of the component !, because it contributes significantly to the overall mode of operation of the Earth system (such that tipping it modifies the qualitative state of the whole system), it contributes significantly to human welfare (such that tipping it impacts on many people), or it has great value in itself as a unique feature of the biosphere. A qualitative change should correspondingly be defined in terms of impacts.
Conditions 2–4 give our definition of a policy-relevant tipping element an ethical dimension, which is inevitable because a focus on policy requires the inclusion of normative judgements. These enter in the choices of the political time horizon (TP), the ethical time horizon (TE), and the qualitative change that fulfills con- dition 4. We suggest a maximumTP$ 100 years based on the human life span and our (limited) ability to consider the world we are leaving for our grandchildren, noting also the Intergov- ernmental Panel on Climate Change (IPCC) focus on this timescale. We suggestTE$1,000 years based on the lifetime of civilizations, noting that this is longer than the timescale of
nation states and current political entities. Thus, we focus on the consequences of decisions enacted within this century that trigger a qualitative change within this millennium, and we exclude tipping elements whose fate is decided after 2100.
In the limit#!30, condition 1 would only include vanishing equilibria and first-order phase transitions. Instead we consider that a ‘‘small’’ perturbation#!should not exceed the magnitude of natural variability in !. Considering global temperature, climate variability on interannual to millennial timescales is 0.1–0.2°C. Alternatively, a popular target is to limit anthropo- genic global mean temperature increase to 2°C, and we take a
‘‘small’’ perturbation to be 10% of this. Either way,#!$0.2°C seems reasonable.
One useful way of classifying tipping elements is in terms of the time,T, over which a qualitative change is observed: (i) rapid, abrupt, or spasmodic tipping occurs if the observation time is very small compared withTP(butT%0); (ii) gradual or episodic tipping occurs if the observation time is intermediate (e.g., of order TP); and (iii) slow or asymptotic tipping occurs if the observation time is very long (in particular,T 3TE).
Several key questions arise. What are the potential policy- relevant tipping elements of the Earth system? And for each:
What is the mechanism of tipping? What is the key featureFof interest? What are the parameter(s) projecting onto the control
!, and their value(s) near!crit? How long is the transition time T? What are the associated uncertainties?
Policy-Relevant Tipping Elements in the Climate System Earth’s history provides evidence of nonlinear switches in state or modes of variability of components of the climate system (6–10). Such past transitions may highlight potential tipping elements under anthropogenic forcing, but the boundary con- ditions under which they occurred were different from today, and anthropogenic forcing is generally more rapid and often different in pattern (11). Therefore, locating potential future tipping points requires some use of predictive models, in com- bination with paleodata and/or historical data.
Here we focus on policy-relevant potential future tipping elements in the climate system. We considered a long list of candidates (Fig. 1, Table 1), and from literature review and the aforementioned workshop, we identified a short list of candi- dates that meet conditions 1–4 (top nine rows in Table 1). To meet condition 1, there needed to be some theoretical basis ("1 model study) for expecting a system to exhibit a critical threshold
Fig. 1. Map of potential policy-relevant tipping elements in the climate system, up- dated from ref. 5 and overlain on global population density. Subsystems indicated could exhibit threshold-type behavior in re- sponse to anthropogenic climate forcing, where a small perturbation at a critical point qualitatively alters the future fate of the system. They could be triggered this century and would undergo a qualitative change within this millennium. We exclude from the map systems in which any threshold appears inaccessible this century (e.g., East Antarctic Ice Sheet) or the qualitative change would appear beyond this millennium (e.g., marine methane hydrates). Question marks indicate systems whose status as tipping elements is particularly uncertain.
PERSPECTIVE
The climate system can be divided up into subsystems, called tipping elements (Fig. 1), with each tipping element containing a tipping point (Lenton et al., 2008). Lenton et al.
(2008) found several policy-relevant tipping elements (Fig. 1), which can affect a significant number of people in the future. For example the Sahara Greening or a West African Monsoon Shift would affect directly a large number of people (see Fig. 1 population density). Large scale anoxia would also affect a large number of people indirectly by affecting the marine ecosystem and fishery.
The aim of this PhD thesis is to advance the research in tipping elements. A large number of tipping elements exist and therefore two case studies are performed with a focus on Earth system feedbacks:
1. Atmospheric feedbacks in North Africa driven by an irrigated afforested Sahara (Chapter 2, 3)
2. Biogeochemical feedbacks related to the phosphorus cycle and its link to oceanic deoxygenation (Chapter 4, 5)
The structure of the thesis is as follows. First a general introduction (Section 1.2) is given. The general introduction describes the beginning of human climate intervention and their feedbacks (Section 1.2.1), a linear concept for climate feedbacks (Section 1.2.1.1) and how model development expands the representation of feedbacks in Earth- system models (Section 1.2.2).
In the first case study, atmospheric feedbacks in the North African climate system (introduced in Section 1.3) to an artificial afforestation are investigated. Artificial afforestation is proposed as one climate engineering option to sequester carbon dioxide from the atmosphere (Ornstein et al., 2009; Keller et al., 2014; Bowring et al., 2014).
The past greening of the Sahara (Section 1.4) could suggest that initiated atmospheric feedbacks by irrigation and afforestation could sustain a Green Sahara, which would, in turn, reduce irrigation efforts (“Artificial Green Sahara" is used in the following as a synonym for an irrigated and afforested Sahara). In this thesis the self-sustainability of an artificial Green Sahara, the effect on the West African Monsoon (Chapter 2) and potential consequences for tropical cyclone development (Chapter 3) are assessed.
In the second case study, future deoxygenation of the ocean under a “business-as-usual"
scenario is investigated. The role of enhanced phosphate weathering, anthropogenic phosphate fluxes, sediment fluxes and their feedbacks are considered. In contrast to the annual to decadal timescales associated with atmospheric feedbacks (first case study), weathering and sediment fluxes influence the ocean on millennial timescales. In an anoxic environment, redox conditions can lead to an excess release of P from the sediment and lead to high rates of recycling of P in the ocean (see biogeochemical
1.2. General Introduction
feedbacks related to the ocean oxygen inventory in Section 1.5). Several Oceanic Anoxic Events (OAEs) occurred already in the past, which probably caused mass extinctions in the ocean (Section 1.6). The relevance of the phosphorus-oxygen feedback for the development of potential future OAEs (Chapter 4) and its uncertainties (Chapter 5) are assessed.
The research questions are formulated in Section 1.7. Chapters 2 and 3 present the first case study and Chapters 4 and 5 the second case study. The overall conclusion can be found in Section 6.
1.2 General Introduction
1.2.1 Early signs of human climate intervention: The Ruddiman Hypothesis The Ruddiman Hypothesis (Ruddiman, 2003) states that anthropogenic forcing changed the Earth system already thousand years ago. This hypothesis is supported by ice core records and proxy data (Fuller et al., 2011; Kaplan et al., 2011; Marcott et al., 2013;
Mitchell et al., 2013). 10000 years ago, orbital driven methane (CH4) and carbon dioxide (CO2) removal would have initiated the beginning of a new ice age cycle, if not inhibited by anthropogenic climate warming (Fig. 2.2; Ruddiman et al., 2005). Already 5000 years ago anthropogenic CH4 emissions started due to irrigation for rice in Asia and lead to a greenhouse effect on temperature (Ruddiman, 2003). Anthropogenic CH4
accumulated in the atmosphere by 230 ppb until the beginning of industrialization (Fig.
2.2a), whereby approximately 9 to 22% of the CH4 emissions are related to temperature feedbacks (Ruddiman, 2006). Rising temperatures due to anthropogenic CO2 and CH4
forcing lead to a release of CH4 from wetlands, this enhances the greenhouse effect and consequentially results in an additional release of CH4 from wetlands.
Anthropogenic CO2 emissions started 8000 years ago driven by deforestation in Europe to grow crops (Ruddiman, 2003). This leads to an increase in atmospheric CO2
concentration of 40 ppm until the start of the industrial era (Fig. 2.2b), but only 9 ppm were caused by direct emissions (Ruddiman, 2006). The remaining 75% of the emissions were likely driven by a feedback between climate warming and the ability of the ocean to take up CO2. At higher temperatures, the solubility of CO2 in the ocean decreases and stratification increases, therefore less anthropogenic CO2 can be taken up by the ocean.
The pre-industrial climate warming occurs on millennial timescales much longer timescales than the industrial climate warming. On these different timescales, the contribution and relevance of feedbacks for global temperature development can vary.
The preindustrial anthropogenic emissions of CH4 and CO2 caused a net warming of 0.75K (Fig. 2.2c), similar to the industrial warming of 0.85K since 1850 (IPCC, 2013), but the release of anthropogenic CO2 and CH4 is much larger during the industrial time than during the pre-industrial time (Fig. 2.2a, b). This indicates that timescales matter
4
for the response of the climate system to an anthropogenic forcing. Earth system components react on different timescales and therefore different feedbacks are involved, for example processes in the deep ocean and ocean sediments act on millennial timescales in contrast to the atmosphere and the upper ocean, which react on much shorter timescales.
Fig. 2 Net anthropogenic contribution during the Holocene to (a) atmospheric CH4 concentration, (b) CO2
concentration, and (c) global mean temperature. Figure adapted from Ruddiman (2006).
1.2.1.1 A linear concept for climate feedbacks: Climate sensitivity, forcing and climate effect
Observations of greenhouse gas (GHG) concentrations and emissions are much better confined for the time after the industrial revolution. This contains estimates for CO2, CH4, N2O, hydrofluorcarocarbons, perflurocarbons and other GHGs (Meinshausen et al., 2011). In current research, a large focus lies on the investigation of climate feedbacks due to increasing GHG concentrations and their effect on global temperature (ΔT). Anthropogenic GHG emissions perturb the radiation balance at the top of the atmosphere and lead to a change in radiative forcing (ΔR). Radiative forcing and global
ago, a time when global population began a 300-year interval of unusually rapid growth?
11. CONCLUSIONS
[228] This review has addressed major challenges to the anthropogenic explanation for late Holocene CO2and CH4
increases. Sections 4 – 6 concluded that the CO2 and CH4 anomalies are !35 ppm and !230 ppb, respectively, or about 90% as large as those initially proposed byRuddiman [2003]. Section 7 concluded that the CH4 anomaly can reasonably be explained by early human agricultural activ- ities and by climate feedbacks. Section 8 concluded that deforestation and coal burning cannot account for more than
!25% of the !35-ppm CO2 anomaly, but the CO2 trend remains anomalous by that amount and is thus still likely to be of anthropogenic origin. The most likely source of the remaining CO2anomaly is carbon from a Holocene ocean that failed to cool as much as it had early in previous interglaciations. The carbon source for the other 75% of the 35-ppm CO2 anomaly is the largest remaining uncertainty concerning the early anthropogenic hypothesis.
[229] These conclusions should be weighed against the opposite perspective: the validity of natural explanations for the late Holocene gas increases. From the outset, natural explanations encounter the problem that they cannot explain why the gas concentrations fell during similar intervals of the last four interglaciations (stages 5, 7, 9, and 11). An
explanation for the Holocene rise cannot explain these earlier drops.
[230] Broecker et al. [2001] posed the only natural explanation yet published for the Holocene CO2trend: the ocean chemistry hypothesis. They interpreted the Holocene CO2 rise as a delayed response of the ocean carbonate system to reforestation of the northern continents during the previous deglaciation thousands of years earlier [see also Joos et al., 2004; Broecker and Stocker, 2006]. Yet this hypothesis encounters the problem noted above: Why was the Holocene trend entirely different from those during previous interglaciations? Toward the end of the deglacia- tions leading to interglacial stages 5, 7, 9, and 11, the ice sheets melted and the forests advanced northward, just as they did prior to stage 1. The ocean chemistry hypothesis thus predicts that a CO2rise should have occurred early in stages 5, 7, 9, and 11. Yet in each case the CO2trend went down not up. The ocean chemistry hypothesis fails all four of these tests.
[231] Both ice cores and marine sediments suggest that interglacial stages 5, 7, 9, and 11 may be the only ones that can serve as definitive tests of the early anthropogenic hypothesis. Peak interglacial intervals in isotopic stages 13 and 15 had lower CO2 values [Siegenthaler et al., 2005a] and less negative marine d18O values [Imbrie et al., 1984;Lisiecki and Raymo, 2005] compared to intergla- cial stage 11 and the subsequent interglaciations. Conse- quently, natural explanations for the late Holocene greenhouse gas rises fail the only four tests available.
[232] Crutzen and Stoermer[2000] defined the ‘‘Anthro- pocene’’ as the interval in time, the last 2 centuries, when humans caused exponential increases in greenhouse gas concentrations in the atmosphere and accelerating altera- tions of Earth’s surface. The analysis here supports the contention by Ruddiman [2003] that human impacts on Earth’s surface, on greenhouse gas concentrations, and on global climate began much earlier but at much slower rates (Figure 22).
[233] Although slow in developing, the climatic effect of these early agricultural factors by late in the Holocene rivaled that of the subsequent industrial portion (Figure 22c).
Because the climate system had time to come to full equilibrium with the slow greenhouse gas increase over thousands of years, the cumulative effect on global temper- ature during the time just before the industrial era had risen to !0.7!C (for a doubled-CO2 sensitivity of 2.5!C and anomalies of 35 ppm for CO2and 230 ppb for CH4). By the early 2000s the global mean warming of the industrial era had also reached 0.7!C, but the rise in gas concentrations during the past century was so rapid that the climate system has not had time to reach the full equilibrium warming. In addition, part of the greenhouse warming effect has been canceled by cooling from anthropogenic aerosols. As a result the estimated preindustrial anthropogenic warming of!0.7!C effectively doubles the total net effect of humans on global temperature to!1.4!C.
[234] A final implication of the early anthropogenic hypothesis is that no natural (preanthropogenic) baseline Figure 22. Net anthropogenic contributions during the
Holocene to (a) atmospheric CH4 concentration, (b) CO2
concentration, and (c) global mean temperature.
RG4001 Ruddiman: EARLY ANTHROPOGENIC HYPOTHESIS RG4001
1.2. General Introduction
temperature changes are often considered with a linear relationship scaled by climate sensitivity (λ):
∆𝑇=𝜆∙∆𝑅. (1)
Different definitions and calculations for the climate sensitivities λ exist, for example the equilibrium and transient climate sensitivity (IPCC, 2013). The equilibrium (transient) climate sensitivity gives the response in global temperature to a forcing R on multi-century (decadal to century) timescales. The equilibrium response is smaller than the transient response, because some feedbacks react on much longer timescales (compare also to Fig. 2.2). The climate sensitivity parameter λ summarizes a large number of climate processes and feedbacks in one number, but obviously this is hard to obtain. Different components of the Earth system respond to anthropogenic forcing R at the same time.
Various climate models are used to determine λ as accurately as possible. Equilibrium climate sensitivity is likely in the range from 1.5 to 4.5°C for doubling of atmospheric CO2 (IPCC, 2013). These large uncertainties are attributed to not fully understood climate feedbacks and climate forcings. Eq. (1) can be used as a simplified approach to assess the impact of human intervention on climate, limited to temperature change in response to increasing GHG concentrations until the end of the 21st century. This simplification helps to build a common basis for different disciplines of climate science (e.g. climate modelling, climate policy making and economic modelling), but there are also other feedbacks, beside climate feedbacks, relevant for human beings. This could be for example biogeochemical feedbacks affecting the marine ecosystems and the ocean oxygen state.
1.2.2 Model complexity and the representation of Earth system feedbacks
The growing complexity of climate models (Fig. 3) increased the numbers of feedbacks which models are able to simulate. In the very beginning simple zero- and one- dimensional energy balance models were used to explain and predict climate dynamics (Budyko, 1968), but these models could not simulate realistic meridional temperature profiles of the Earth. The establishment of computers in climate science led to a new generation of climate models, the so-called general circulation models (GCMs). In the beginning, ocean and atmosphere were modelled independently, followed by development of coupled atmosphere-ocean GCMs in the 80s (see Fig. 3). In GCMs, ocean and atmosphere dynamics are represented by a set of primitive equations. These equations conserve momentum, mass and energy for every grid cell in the atmosphere and in the ocean. GCMs are well suited to understand and model climate feedbacks caused by changes in water vapour, surface albedo and clouds. These and other feedbacks (introduced in Section 1.3), affect for example the response of the North African climate system to the irrigation and afforestation of the Sahara (case study one).
In the late 90s and in the beginning of the 21st century, biogeochemical processes were implemented in the so-called Earth System Models (ESMs). This includes representations of aerosol and dust processes, vegetation dynamics, a dynamic carbon cycle in the ocean, atmosphere and/or on land and other biogeochemical cycles. In this thesis the future ocean deoxygenation and its consequence for ocean anoxia are investigated (case study two) and therefore biogeochemical feedbacks only related to the ocean oxygen inventory are presented (see Section 1.5).
Fig. 3 Historical development of Earth system components, which are represented and simulated with climate models. Picture is used with kind permission from the University Corporation for Atmospheric Research (UCAR).
1.3 Atmospheric feedbacks in the North African climate system
This section will provide an overview of atmospheric feedbacks in the North African climate system, which could affect the afforestation and irrigation of the Sahara in a climate engineering scenario (first case study). The irrigated afforestation of the Sahara is proposed as a climate engineering measure for CO2 removal, but also associated with substantial irrigation costs (Ornstein et al., 2009). The degree of self-sustainability of an artificial Green Sahara affects the required irrigation costs, therefore contributions of atmospheric feedbacks to the self-sustainability are analyzed in the first case study. The relevance of these feedbacks for the mid-Holocene Green Sahara are given in Section 1.4.
1.3. Atmospheric feedbacks in the North African climate system
1.3.1 Vegetation albedo feedback or Charney feedback
Charney (1975) suggested a vegetation albedo feedback (Fig. 4) to explain circulation and precipitation dynamics in the North African climate system. The vegetation albedo is lower than the desert albedo. A larger vegetation cover would increase the surface temperature due to the absorption of shortwave (SW) radiation. Warmer temperatures result in more moist static energy, which could destabilize the atmospheric air column.
In North Africa, this could affect the descending branch of the Hadley Cell and consequently affect precipitation strength and location of the West African Monsoon (Charney, 1975). More precipitation results in expanding vegetation and consequently leads to a positive feedback loop.
Fig. 4 The vegetation albedo feedback is triggered by changes in vegetation cover. Different albedos of bare soil and vegetation affect absorbed shortwave (SW) radiation and the surface air temperature. Low-level moist static energy increases (decreases) with higher (lower) surface air temperature and could lead to more (less) precipitation, which feeds back to vegetation cover.
1.3.2 Vegetation water recycling feedback
Regions with trees as vegetation can store a substantial amount of water.
Evapotranspiration releases the stored water and leads to higher atmospheric moisture content than in deserts or grasslands. The increase in low-level moist static energy could destabilize the air column and result in local re-precipitation. This local precipitation could extend the length of the growing season and increase the vegetation cover as long the feedback is not interrupted by horizontal moisture advection. This so-called vegetation water recycling feedback (Fig. 5) could help to establish an artificial Green Sahara by recycling evaporated water and reducing irrigation costs.
Water vapor feedback
Cloud feedback
Vegetation albedo feedback or charney feedback
Watervapor
Greenhouse effect
Surfaceair temperature Vapour
pressure Evapotranspi
ration
+ +
+ +
+
Positive feedback
Water vapor
Clouds
Greenhouse effect or reflection of SW radiation
Surface air temperature Evapotranspi
ration
+/- +
+ +
+
Positive or negative feedback
Vegetation cover
Albedo
Absorption of SW radiation Surface air
temperature Precipitation
+ +
+ -
-
Positive feedback
Fig. 5 Vegetation water recycling feedback: Direct local water recycling by precipitation of evaporated water could promote growth of vegetation and the vegetation cover.
The effectiveness of local water recycling can depend hereby on many different aspect, for example the location of the vegetation. Zhang et al. (1996) found that local water recycling is important in the Amazon Basin, but less in Southeast Asia or in tropical Africa. In the Sahara the water recycling feedback played a minor role for precipitation during the early- to mid-Holocene (Rachmayani et al., 2015). Instead, soil moisture was more important to influence circulation dynamics in North Africa and effect precipitation as described in the next subsection.
1.3.3 Vegetation circulation feedback or soil moisture feedback
The vegetation circulation feedback (Fig. 6) interacts between vegetation and the African Easterly Jet (AEJ). The AEJ is part of the zonal jets system over North Africa.
Position and strength of the AEJ affects precipitation over the Sahara and the Sahel zone. The AEJ transports moisture off the continent, so that a weaker AEJ would result in mid-tropospheric moisture convergence and a positive precipitation anomaly (Cook, 1999). The AEJ is driven by the positive meridional temperature gradient between the Sahara and the Sahel zone via geostrophy and the thermal wind equation.
The vegetation circulation feedback affects the strength of the AEJ and is most efficient, when the vegetation change appears north of the AEJ (18°N) in North Africa (Patricola and Cook, 2008). Enhanced coverage of vegetation in the Sahara cools the surface by enhanced latent heat fluxes. This reduces the meridional temperature gradient and the strength of the AEJ. A weaker AEJ reduces the moisture divergence over the Sahara and potentially increases precipitation.
Water-recycling feedback
Vegetation-circulation feedback
Dust-precipitation feedback
Vegetation cover
Dust emission
Incoming SW radiation Surface
temperature Precipitation
Vegetation cover
Evapotranspi ration
Atmospheric moisture
content Precipitation
Length of growing
season
+ +
+ +
+
Positive feedback
Vegetation
Latent heat flux
Surface temperature
Meridional temperature gradient AEJ strength
Precipitation
+ -
+ +
Positive -
feedback
+
+ +
+ -
-
Positive feedback
1.3. Atmospheric feedbacks in the North African climate system
Fig. 6 The vegetation circulation feedback is described by a complex interplay between vegetation and the African Easterly Jet (AEJ) (details see text). This feedback is primary restricted to areas north of the AEJ in North Africa.
1.3.4 Dust precipitation feedback
Reduction in dust coverage over North Africa could promote precipitation in the Sahara due to a dust precipitation feedback (Fig. 7). Strong dust emissions occur in a dry bare- soil region like the Saharan desert. The dust precipitation feedback is triggered by increasing vegetation cover. Increased vegetation cover reduces surface wind speeds and the wind exposed soil areas. Less atmospheric dust reduces scattering of SW radiation, which warms the surface. As a result, moist static energy increases in the lower troposphere, thereby promoting precipitation and vegetation growth. Model simulations show that dust reduction during the mid-Holocene could have led to a 500 km northward expansion of the West African Monsoon (Pausata et al., 2016).
However, the representation of the dust cycle in North Africa is subject to considerable biases (Parajuli et al., 2016) and more detailed evaluation of dust processes is needed until reliable predictions can be done.
Water-recycling feedback
Vegetation-circulation feedback
Dust-precipitation feedback
Vegetation cover
Dust emission
Incoming SW radiation Surface
temperature Precipitation
Vegetation cover
Evapotranspi ration
Atmospheric moisture
content Precipitation
Length of growing
season
+ +
+ +
+
Positive feedback
Vegetation
Latent heat flux
Surface temperature
Meridional temperature
gradient AEJ strength
Precipitation
+ -
+ +
Positive -
feedback
+
+ +
+ -
-
Positive feedback
Chapter 1. Introduction
10
Fig. 7 The dust precipitation feedback is triggered by an increase in vegetation cover. Dust emissions are reduced in areas, where vegetation replaces bare soil areas or grassland. Less atmospheric dust reduces scattering of shortwave (SW) radiation and warms the Earth surface. Low-level moist static energy increases with higher surface air temperature and could lead to more precipitation, which feeds back to vegetation cover.
1.3.5 Water vapor feedback
Water vapor as a greenhouse gas increases surface air temperature in a positive feedback loop (Fig. 8). A positive water vapor anomaly in the atmosphere affects the radiative forcing of the atmosphere. Water vapor absorbs longwave radiation from the Earth surface and reemits half of it back to the Earth surface. Consequentially, surface air warms and increases the saturation vapor pressure by approximately 7% per Kelvin as derived from the Clausius-Clapeyron relationship. Enhanced evaporation closes the feedback loop and leads to more moisture content in the atmosphere. This feedback is generally analyzed for climate warming scenarios (Held and Soden, 2000) and works best for ocean areas where no water limitation appears.
Fig. 8 Water vapor feedback: Climate warming or irrigation as anthropogenic water vapor source can initiate this feedback. More water vapor in the atmosphere enhances the greenhouse effect and warms the surface and surface air temperature. Warmer air can hold more water vapor, thereby promote evapotranspiration. This amplifies the initial change and is therefore a positive feedback.
Vegetation-circulation feedback
Dust-precipitation feedback
Vegetation cover
Dust emission
Incoming SW radiation Surface
temperature Precipitation
Vegetation cover
Evapotranspi ration
Atmospheric moisture
content Precipitation
Length of growing
season
+ +
+ +
+
Positive feedback
Vegetation
Latent heat flux
Surface temperature
Meridional temperature gradient AEJ strength
Precipitation
+ -
+ +
Positive -
feedback
+
+ +
+ -
-
Positive feedback
Water vapor feedback
Cloud feedback
Vegetation albedo feedback or charney feedback
Watervapor
Greenhouse effect
Surfaceair temperature Vapour
pressure Evapotranspi
ration
+ +
+ +
+
Positive feedback
Water vapor
Clouds
Greenhouse effect or reflection of SW radiation
Surface air temperature Evapotranspi
ration
+/- +
+ +
+
Positive or negative feedback
Vegetation cover
Albedo
Absorption of SW radiation Surface air
temperature Precipitation
+ +
+ -
-
Positive feedback
1.4. Mid-Holocene and artificial Green Sahara: Self-sustainability and feedbacks
11 1.3.6 Cloud feedback
Clouds have a warming effect on the surface by absorption and reemission of longwave (LW) radiation and a cooling effect by reflecting incoming shortwave (SW) radiation.
The net effect of clouds depends on the sum of the LW and SW forcing radiation. Low clouds act to cool the surface due to the reflection of SW radiation, whereas high clouds lead to warmer surface temperatures. Reflection of SW radiation of high clouds is less effective than the absorption of LW radiation and hence the greenhouse effect is enhanced (Liou, 2002). The radiative forcing of clouds could also interact with the water vapor feedback (see Fig. 9). On a global scale, radiative forcing of clouds significantly enhances the water vapor feedback (Hall and Manabe, 1999), but regionally a change in cloudiness could lead to positive or negative cloud feedbacks.
The example for cloud feedbacks presented here does not describe all possible interactions of clouds with the climate system. Scientific discussion about cloud feedbacks is still controversial, but an inter-comparison project started recently (Webb et al., 2017) to give a more complete picture about cloud processes and related feedbacks.
Fig. 9 Cloud feedback: Cloud radiative processes are integrated into the water vapor feedback (Fig. 8), which represents one possible cloud feedback among others. The sign of the feedbacks depends on net effect of the clouds on the surface temperature (details see text).
1.4 Mid-Holocene and artificial Green Sahara: Self-sustainability and feedbacks
It appears promising that, compared to today, the Sahara was once probably much greener during the mid-Holocene (circa 10000-5500 before present, e.g. Prentice and Jolly, 2000). Atmospheric feedbacks were important to establish a Green Sahara during the mid-Holocene. During the mid-Holocene, orbital forcing acted as a trigger for rapid climate change initiating vegetation feedbacks to drive the Sahara from a green into a desert state (Claussen et al., 1999). Similarly, in a climate engineered Green Sahara the irrigation could be the trigger to establish an artificial Green Sahara, but atmospheric
Water vapor feedback
Cloud feedback
Vegetation albedo feedback or charney feedback
Watervapor
Greenhouse effect
Surfaceair temperature Vapour
pressure Evapotranspi
ration
+ +
+ +
+
Positive feedback
Water vapor
Clouds
Greenhouse effect or reflection of SW radiation
Surface air temperature Evapotranspi
ration
+/- +
+ +
+
Positive or negative feedback
Vegetation cover
Albedo
Absorption of SW radiation Surface air
temperature Precipitation
+ +
+ -
-
Positive feedback
![Fig. A3 Seasonal summer (a) and winter (b) long-term (30-year) mean differences between the AF and the CTR experiments in surface air temperatures in Kelvin [K] (shaded) and surface wind anomalies (arrows)](https://thumb-eu.123doks.com/thumbv2/1library_info/5333857.1681028/65.892.151.787.114.324/seasonal-differences-experiments-surface-temperatures-kelvin-surface-anomalies.webp)