Effects of experimental warming on biodiversity depend on ecosystem type and local species composition
Daniel S. Gruner, Matthew E. S. Bracken, Stella A. Berger, Britas Klemens Eriksson, Lars Gamfeldt, Birte Matthiessen, Stefanie Moorthi, Ulrich Sommer and Helmut Hillebrand
D. S. Gruner (http://orcid.org/0000-0002-3153-4297)(dsgruner@umd.edu), Dept of Entomology, Univ. of Maryland, College Park, MD 20742-4454, USA. – M. E. S. Bracken, Dept of Ecology and Evolutionary Biology, Univ. of California, Irvine, CA, USA. – S. A. Berger, Leibniz-Inst. of Freshwater Ecology and Inland Fisheries (IGB), Dept of Experimental Limnology, Stechlin, Germany. – B. K. Eriksson, Marine Benthic Ecology and Evolution, Centre for Ecological and Evolutionary Studies, Univ. of Groningen, Groningen, the Netherlands. – L.
Gamfeldt, Dept of Marine Sciences, Univ. of Gothenburg, Gothenburg, Sweden. – B. Matthiessen and U. Sommer, Helmoltz Centre for Ocean Research (GEOMAR), Kiel, Germany. – S. Moorthi and H. Hillebrand, Inst. for Chemistry and Biology of the Marine Environment (ICBM), Carl-von-Ossietzky Univ. Oldenburg, Wilhelmshaven, Germany.
Climatic warming is a primary driver of change in ecosystems worldwide. Here, we synthesize responses of species richness and evenness from 187 experimental warming studies in a quantitative meta-analysis. We asked 1) whether effects of warming on diversity were detectable and consistent across terrestrial, freshwater and marine ecosystems, 2) if effects on diversity correlated with intensity, duration, and experimental unit size of temperature change manipulations, and 3) whether these experimental effects on diversity interacted with ecosystem types. Using multilevel mixed linear models and model averaging, we also tested the relative importance of variables that described uncontrolled environmental variation and attributes of experimental units. Overall, experimental warming reduced richness across ecosystems (mean log-response ratio –0.091, 95% bootstrapped CI: –0.13, –0.05) representing an 8.9% decline relative to ambient temperature treatments. Richness did not change in response to warming in freshwater systems, but was more strongly negative in terrestrial (–11.8%) and marine (–10.5%) experiments. In contrast, warming impacts on evenness were neutral overall and in aquatic systems, but weakly negative on land (7.6%). Intensity and duration of experimental warming did not explain variation in diversity responses, but negative effects on richness were stronger in smaller experimental units, particularly in marine systems. Model-averaged parameter estimation confirmed these main effects while accounting for variation in latitude, ambient temperature at the sites of manipulations, venue (field versus lab), community trophic type, and whether experiments were open or closed to colonization. These analyses synthesize extensive experimental evidence showing declines in local richness with increased temperature, particularly in terrestrial and marine communities. However, the more variable effects of warming on evenness were better explained by the random effect of site identity, suggesting that effects on species’ relative abundances were contingent on local species composition.
Climatic warming is a major driver of change in ecosystems worldwide. Shifts in species ranges, phenology, and relative abundances, with resulting changes in species interactions,
are predicted to alter local biodiversity within ecosystems (Dawson et al. 2011). At the organismal level, metabolic, behavioral, or evolutionary mechanisms may drive popula- tion responses to altered temperatures, including changes in body size or dispersal and range expansion in pace with the changing environment (Parmesan 2006, Bell and Gonzalez 2009, Lavergne et al. 2010, Gardner et al. 2011,
© 2016 The Authors. This article is Online Open Subject Editor: Richard Michalet. Editor-in-Chief: Chistopher Lortie. Accepted 14 July 2016 Oikos 126: 8–17, 2017 doi: 10.1111/oik.03688
This work is licensed under a Creative Commons Attribution 4.0 International License (CC-BY) < http://creativecommons.org/
licenses/by/4.0/ >.
C h o i c e E di t o r’s
OIKOS
A global research priority is to understand the consequences of climate change for biodiversity. A growing number of experimental studies have manipulated climatic drivers, in particular changes in temperature, in local communities. In the first quantitative meta-analysis of community-level studies across freshwater, marine and terrestrial experiments, species richness declined consistently with experimental warming. This effect was insensitive to warming intensity, duration, and multiple environmental and procedural covariates. However, evenness responses were weakly negative only in terrestrial systems and more variable across ecosystem types.
Linear mixed model analyses revealed that the identity of local sites explained nearly 50% of variance in even- ness effect sizes, compared to only 10% for richness. This result provides evidence that local species composition strongly constrains changes in relative species abundances in response to warming.
Synthesis
Urban et al. 2012, Reuman et al. 2014). Community-level responses are more complicated, as changing temperature may differentially favor the vital rates or demographic attri- butes of some species while penalizing others (Elmendorf et al. 2012). The magnitude or sign of species interactions also may change, thereby disrupting mutualisms, trophic interactions, competitive hierarchies, and ultimately species coexistence (Gedan and Bertness 2009, Zarnetske et al.
2012, Blois et al. 2013, Sorte and White 2013, Sentis et al.
2014).
Long-term observational data have been highly infor- mative in connecting changing climatic means, variability, and timing of events or phenology with species geographical distributions over time (Blenckner et al. 2007, Wischnewski et al. 2011, CaraDonna et al. 2014). Paleo-ecological recon- structions and climate-envelope niche modeling efforts, matching past and present climatic regimes with species distributions, often form the basis for projections of population and community responses and the future of bio- diversity (Ibáñez et al. 2006, Thuiller et al. 2008, Roberts and Hamann 2012, Maguire et al. 2015). A clear advan- tage of these approaches is that the large-grained spatial and temporal projections scale to variation in climatic stressors that may alter species geographic distributions. However, species distribution modelling does not in general account for interspecific biotic interactions (but see Trainor et al.
2014), which is a strength of community-level experimenta- tion. Moreover, many factors covary with temporal trends in temperature that compromise attempts to infer causality (Tylianakis et al. 2008, Dawson et al. 2011), and models produced with incomplete occurrence records may gener- ate truncated bioclimatic niche spaces, unstable response functions, and systematic prediction errors (Hannemann et al. 2016). Efforts to then integrate species distribution models with downscaled climate projections, extended to the community level, are still under development (Baselga and Araújo 2009, Maguire et al. 2015). Such approaches must be complemented with experimental manipulations of climatic variables to test alternative mechanistic hypotheses for biodiversity change in local communities (Shaver et al.
2000, Petersen et al. 2009).
Controlled tests that evaluate the role of predicted future temperatures in mediating diversity have been implemented in different environments as sustained warming experiments in field (Klein et al. 2004) and laboratory settings (Petchey et al. 1999). The results of these studies reveal variable, context-dependent, and heterogeneous outcomes in space and time, necessitating efforts to synthesize patterns and generate hypotheses across systems (Elmendorf et al. 2012).
Recent meta-analyses of warming experiments have analyzed broad trends in responses of terrestrial plant growth and ecosystem carbon balance (Wu et al. 2011), soil ecosystem fluxes (Rustad et al. 2001), abundance of belowground biotic groups (Blankinship et al. 2011), and the relative perfor- mance of co-occurring native and non-native species across aquatic and terrestrial systems (Sorte et al. 2013). Syntheses from experimental studies in the Arctic tundra biome show consistent negative impacts of experimental warming on richness and evenness of plant communities, but with effects contingent on species composition, functional diversity, and a suite of environmental variables including soil moisture
(Walker et al. 2006, Elmendorf et al. 2012). To date, we lack a systematic quantitative assessment of empirical results that characterize effects on biodiversity across globally distributed experiments and systems.
Here, we synthesize evidence for the effects of warming on community diversity (richness and evenness) in a meta-anal- ysis of 187 experimental temperature manipulation studies across freshwater, marine and terrestrial ecosystems. In par- ticular, we asked 1) whether increased temperatures impacted community species richness and evenness differentially across ecosystem types, 2) if effects on diversity increased as a function of increasing intensity, duration, and unit size of temperature change manipulations, and 3) whether these experimental effects on diversity interacted with ecosystem types. We expected stronger, more negative effect sizes with larger mean temperature change, over longer study durations, and in smaller experimental units. Beyond these hypotheses tests, we used model selection and model averaging to assess the relative importance of categorical and quantitative vari- ables extracted from the literature to describe habitat, organ- ismal types, and a range of procedural covariates.
Methods
Data extraction
We assembled the results from 187 separate experiments worldwide (Supplementary material Appendix 1 Fig. A1), extracted from 72 publications and three unpublished datasets that evaluated the effects of increased tempera- ture on species richness (n 169 experiments) or evenness (n 121 experiments); many studies reported both richness and evenness. Experiments were identified with literature searches (Web of Science and Google Scholar) using the search string ‘(temperature or warming) AND (diversity or evenness or richness) AND (experiment* or mesocosm* or manipul*)’. We also followed relevant literature trails from each paper to identify as many experiments as pos- sible through 2015. A study was included if it contained a sustained temperature manipulation treatment with a corre- sponding control in a replicated design. When studies used repeated measures designs, a priori we used the endpoint of the time series and did not retain the intermediate time points for analyses. We excluded studies with temperature manipulation (ΔT) in excess of 6°C, as these exceed even the most extreme projections for global temperature increases by the end of the 21st century (Stocker et al. 2013). In studies that reported manipulations at multiple temperatures, we used the greatest difference from ambient control tempera- ture (where ΔT 6°C). Although it is important to recognize that increases in both mean temperatures and in temperature variability (e.g. heat waves, freeze events) are predicted by global change models (Stocker et al. 2013), many studies did not explicitly manipulate or report temperature variance estimates that could be used in the analyses.
We used the log-response ratio as our effect-size metric for temperature effects on species richness (Ŝ) and evenness (Ê):
S=
In 1
0
S
S (1)
Ê=
In 1
0
E
E (2)
where the effect size is defined as the natural log of the ratio between the richness (S) or evenness (E) at the experimen- tally warmed temperature (S1 or E1, respectively) and S or E at the baseline ambient temperature (S0 or E0, respec- tively). The log-response ratio is one of the most robust and widely used metrics in ecological meta-analyses (Hedges et al.
1999). Unlike Hedge’s d (another commonly used metric), the log-response ratio does not require a measure of sam- ple variability, which allowed the retention of many studies that did not report comparable variances. Furthermore, the log-response ratio is easily interpretable (it represents the proportional change in the response variable, relative to controls), it shows the least bias of the commonly used effect size metrics, and its sampling distribution approximates normality (Hedges et al. 1999).
We endeavored to include as many disparate studies as possible across different ecosystems, while recording biotic and methodological covariates in order to better under- stand cross-systemic variation (Englund et al. 1999). Thus we collected data from each study on environmental vari- ables and experimental conditions (sample sizes (n) refer to all studies including richness, evenness, or both responses, n 187) that may mediate any warming effects on diversity.
Beginning with categorical variables, we hypothesized that warming effects differed between broad types of ‘ecosystem’, which were categorized as terrestrial (n 123 experiments), marine (n 28) or freshwater (n 36). We classified studies by the primary trophic axis of the measured ‘trophic type’, whether producers (n 110) or consumers (n 77). Only in three studies were data for producers and consumers pre- sented together in aggregate diversity measurements, all for invertebrates and algae in rocky intertidal communities. For analyses, these studies were grouped with ‘consumer’ com- munities because responses to experimental warming were attributed by the authors largely to the invertebrates (Kordas et al. 2015). Within communities, we recorded the domi- nant ‘biotic type’ as follows: within marine and freshwater studies, focal biota were either algae (phytoplankton, per- iphyton or macroalgae, n 29) or aquatic fauna (n 34, primarily invertebrates, with two protist studies and one study of juvenile fish). Terrestrial experiments documented responses of vascular plants (n 66), cryptogams (n 21, including lichens, mosses, fungi), arthropods (n 26), or soil fauna (n 11). And we grouped studies into ‘habitat’
categories; aquatic studies mapped as benthic (n 22), pelagic (n 33), or in running waters (n 9), and terres- trial experiments were classified into grassland or herba- ceous (n 52), shrubland (n 15), tundra (n 31), and soil habitats (n 25). We characterized the study ‘venue’
as field (n 140) or laboratory (n 47) experiments to compare studies embedded in situ with those performed under more controlled artificial conditions. We anticipated differences between experiments that were open (n 126) or closed (n 61) to dispersal of organisms (‘openness’). A local extinction within a closed system may not be reversible, whereas new propagules or species are more likely to enter open systems. The temperature apparatus or ‘manipulation’
was scored as either climate chambers (n 13), greenhouses
(closed top, n 6), reflective covers (n 6), open top chambers (n 56), or direct heating (n 106).
We also obtained information on five continuous explan- atory variables from each study. We hypothesized that both the environmental mean ambient temperature (°C; ‘ambient T’) and the experimentally induced divergence in tempera- ture (°C; ‘ΔT’) could mediate the sign and magnitude of warming effect sizes. Therefore, we extracted ambient tem- peratures reported in original publications during the course of the study. For aquatic ecosystems, ambient temperature was taken as the mean water temperature observed during experiments, and we used mean air or soil temperature, as appropriate to the study, for the terrestrial experiments.
Furthermore, we obtained information on the ‘latitude’
(absolute value °N or °S), the ‘duration’ of the experiment (in days), and the size of the total experimental temperature manipulation unit (experiment size, as surface ‘area’ in m²).
Extracted data from all experiments included in the meta- analysis are presented in full with corresponding citations in Supplementary material Appendix 1 Table A1 (see also Gruner et al. 2016).
Statistical analysis
We first calculated grand mean effect sizes across all studies for Ŝ and Ê with their bootstrapped 95% confidence inter- vals (CI) using the boot package (Canty and Ripley 2014) in R software, ver. 3.2.3 (< www.r-project.org >). We also obtained separate mean effect sizes and 95% bootstrapped CIs for ecosystem types (marine, terrestrial and freshwater) and for each level of categorical predictors. Bootstrapped CIs not overlapping zero indicated a central tendency sig- nificantly different from null across all included studies.
We used an unweighted meta-analysis, as weighting by sample size could favour highly replicated artificial micro- cosm studies in contrast to typically less replicated but more realistic field studies (but see Hillebrand and Gurevitch 2014). Moreover only a minority of studies reported some measure of variation that would allow weighting of effect sizes. Although each experimental study had equal weight on the overall result, studies were not necessarily indepen- dent because our study selection criteria allowed for mul- tiple experiments from common geographic locations to be treated as separate studies. If studies were set up indepen- dently in multiple years, or in multiple localities within a site, they may share multiple predictors in common at those sites. Therefore, we created a random grouping variable for site identity to partition variance within versus among sites in multilevel mixed models (n 79 total sites for 187 studies). Statistical assumptions and procedures for simi- lar multilevel mixed models are detailed in supplementary appendices of several previously published ecological meta- analyses (O’Connor et al. 2007, Qian et al. 2010, Yang et al.
2010).
A priori, we tested effects of experimental warming on richness and evenness 1) across terrestrial, freshwater, and marine ecosystem types; 2) as a function of the magnitude of temperature change (ΔT), the duration of experimental temperature change, and the size of the experimental units upon which treatments were imposed; and 3) as statistical interactions of 1) and 2). We first used ANCOVA to test the
Moussalli 2011). The final model sets were simplified from all 512 possible models by retaining only the top models within 4 units of ΔAICc of the ‘best’ model. To estimate parameter coefficients in the final model set, we calculated conditional values using the mean of regression coefficients weighted by the AICc weight (wi) from each model including that variable (Buckland et al. 1997, Burnham and Anderson 2002). Predictor relative importance, or variable weights, were calculated for each term in the models via the natural average method as for the coefficients; that is, by summing the weights of models where each variable appears (Ander- son 2008, Grueber et al. 2011, Galipaud et al. 2014). Using z-tests, individual parameters in model-averaged sets were tested for statistical significance as the deviation of coeffi- cients from zero.
Data deposition
Data available from the Dryad Digital Repository: < http://
dx.doi.org/10.5061/dryad.f5r3k > (Gruner et al. 2016).
Results
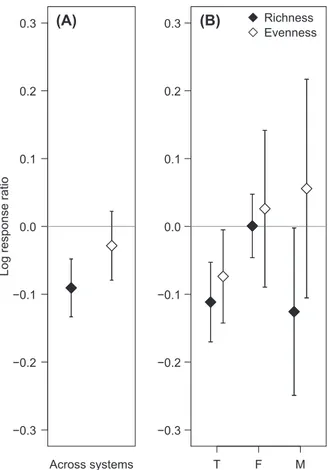
Across all studies, experimental warming reduced species richness on average by 8.9% compared to ambient tem- peratures (mean boot-strapped richness log-response ratio Ŝ –0.091, Fig. 1A). However, richness effects differed depending on the ecosystem type in which experiments were conducted (Fig. 1B). Negative overall effects of warm- ing on richness were driven by negative responses in marine (Ŝ –0.126, or 11.8% decline relative to controls) and ter- restrial ecosystems (Ŝ –0.112, –10.5%), whereas richness did not change overall in freshwater ecosystems (Ŝ 0.001).
The overall mean effect on evenness (mean boot-strapped evenness log-response ratio Ê –0.028) across ecosystems was not different from zero (Fig. 1A). Neutral responses in aquatic systems (marine Ê 0.026, freshwater Ê 0.056) swamped a weak reduction in evenness in terrestrial ecosys- tems (Ê –0.074).
Across the range of experimental warming (ΔT) in these experiments (to 6°C), increasing intensity had no consis- tent effect on diversity effect sizes Ŝ or Ê, nor were there interactions with ecosystem type (Fig. 2A, D; Supplemen- tary material Appendix 2 Table A2). Qualitatively, the same lack of pattern was evident for experimental duration, which spanned three orders of magnitude in the dataset from a minimum of 8 to over 7000 days (Fig. 2B, E), and for the influence of unit area on Ê (Fig. 2F). However, there was a significant interaction between system and unit area (range:
2.8 cm2 to 298 m2) affecting Ŝ in both ANCOVA analy- sis and in mixed effect models including the random site grouping (Fig. 2C; F2,163 3.573, p 0.030; type II Wald c2 7.28, DF 2, p 0.026). This relationship resulted from a steeper positive slope in marine experiments, reflect- ing a more strongly negative effect on richness observed in the smallest experimental units.
Incorporating the random term for site identity into these mixed effect models explained more variance for both richness and evenness, but models for evenness effects recovered far stronger site-level contingencies (Supplementary material effects of the continuous variables and their statistical inter-
action by ecosystem type (freshwater, marine, or terrestrial) on the responses Ŝ and Ê. Parametric assumptions of linear models were verified using plots of residuals for normality and homoscedasticity. Experimental duration (days) and unit size (area, m2) were natural log-transformed for analyses to meet the assumptions of linear models. With the lme4 package in R software (Bates et al. 2014, < www.r-project.
org >), we then ran the model structures using mixed effects linear models to partition variation within and across sites.
To assess the variance explained by site in random intercept models, we calculated the marginal and conditional coeffi- cients of determination (R2), for fixed effects and both fixed and random effects, respectively, with the MuMIn package (Nakagawa and Schielzeth 2013, Barton 2015).
Multimodel inference
An analytical challenge in ecological meta-analyses is that datasets are rarely balanced or fully independent across the full model matrix. Some variables may be collinear, whereas other factor level combinations are not possible (e.g. pelagic habitat in terrestrial system). To assess the potential influences of other environmental and procedural covariates altogether, we used a multimodel selection and averaging approach (Grueber et al. 2011). The goal of this analysis was not to select a single ‘best’ model, but instead to retain a set of top models weighted by infor- mation theoretic criteria to account for model selection bias (Anderson 2008, Lukacs et al. 2010, Symonds and Moussalli 2011). Traditional stepwise model selection approaches, by contrast, ignore model uncertainty, may depend on stepwise order, and can lead to spurious out- comes if predictor variables have even modest collinearity (Whittingham et al. 2006).
We began model selection and averaging with a total model set for both Ŝ and Ê with every additive combination of nine explanatory variables as fixed effects, excluding all interaction terms and polynomials. The categorical variables for habitat and manipulation types were excluded because they were imbalanced severely across ecosystem types (e.g. grasslands and greenhouses were not applicable to marine ecosystems).
Prior to analysis, continuous regressors were centered (sub- tracting the mean from all values) and scaled (dividing by the standard deviation). Similarly, the coefficients for categorical predictors were standardized by constructing dummy vari- ables and then by removing the intercept term to the effects parameterization in model selection (Schielzeth 2010). Site as a random effect was included in all models and not sub- ject to model selection. Thus, model selection confronted 512 (29 possible, without higher order terms) models in ini- tial sets for both Ŝ and Ê. Models were fit using maximum likelihood in the lme4 R package (Bates et al. 2015).
For each model set, we generated and evaluated the small-sample corrected Akaike information criterion (AICc), ΔAICc, and AICc model weights (wi) using the dredge func- tion within the MuMIn package (Barton 2015). Because we did not expect a single, best model to emerge from each of the large model sets, model averaging procedures accounted for uncertainty and model selection bias (Anderson 2008, Lukacs et al. 2010, Grueber et al. 2011, Symonds and
using ANCOVA and mixed effects models, the coefficient for experimental unit area was significantly different from zero in the final model set for Ŝ (b 0.058 0.025 SE, z 2.28, p 0.022; Table 1). Coefficients for both marine (b –0.121 0.066 SE, z 1.82, p 0.068) and terres- trial (b –0.119 0.065 SE, z 1.84, p 0.066) effects on Ŝ were negative but not significantly different from zero at a 0.05. No parameter coefficient differed significantly from zero in the model set for Ê; the only marginal effect observed was a more negative effect of experimental warming on producers (b –0.098 0.051 SE, z 1.90, p 0.058) than for consumer communities (b –0.003 0.053 SE, z 0.05, p 0.957).
Discussion
Our synthesis of temperature manipulation experiments from freshwater, marine, and terrestrial communities demonstrates a strong negative effect of experimental warming on species richness, particularly in terrestrial and marine ecosystems. We found no overall effect of warming on evenness, although a weak negative effect of warming on evenness was evident in terrestrial systems. Across all stud- ies, these effects were consistent regardless of the intensity or duration of warming experiments. Given a likely projected global mean temperature increase of 1.5–4.5°C over the next century (Stocker et al. 2013), our analyses highlight the potential for major changes in community structure across ecosystems, particularly the potential for declines in species richness (i.e. via localized losses of species; Kardol et al. 2010).
Responses to experimental intensity, duration and size Contrary to predictions, there was no consistent effect of the magnitude of the experimentally increased temperature on diversity across ecosystems (Fig. 2A, D; Supplementary mate- rial Appendix 2 Table A2). In filtering experimental studies for inclusion in our database, we deliberately excluded stud- ies that included warming in excess of 6°C. Temperatures were increased, on average, by ∼ 3°C, which is well within the range of predicted global mean temperature increases by 2100 (Stocker et al. 2013). This temperature increase is also an order of magnitude lower than the typical annual temperature range at study locations, so warming was unlikely, on average, to surpass organisms’ physiological tolerances. Instead, effects on richness were likely to be associated not with temperature effects on species fundamental niches, but with effects on their realized niches via changes in species interactions (Klanderud and Totland 2005, Olsen and Klanderud 2014).
We also found no systematic support for study duration as an important source of variation in community rich- ness or evenness effects (Fig. 2B, E; Supplementary mate- rial Appendix 2 Table A2). The studies in this synthesis were conducted over a broad range of temporal scales (days, min 8, max 7332, median 720), and we roughly estimate that their durations ranged from 1 to 100 generations of the organisms involved. Although transient dynamics cannot be ruled out for many studies, experimental duration does not explain the consistent central tendency Appendix 2 Table A2). For example, fixed effects (marginal
coefficient of determination, R2) for the two-way interac- tive model with effects of ΔT and ecosystem type accounted for an estimated 5.3% of variance in Ê, whereas both fixed and random effects soaked up more than 50% (conditional R2 0.513). In the same model structure for Ŝ, the ran- dom site effect approximately tripled the variance explained (marginal R2 0.049, conditional R2 0.148).
Because the 187 studies contributing to this meta-analysis did not comprise a balanced sample across global biota and habitats, we used multilevel linear mixed models and model averaging using information criteria to evaluate hypotheses alongside variation from study designs, geography, and environmental contexts in source datasets. Beginning with model sets including all possible linear combinations of nine biotic and methodological predictors, each fitted with maxi- mum likelihood in linear mixed models, we reduced to sub- sets by discarding all models greater than 4 AICc units of the top-ranked model. For Ŝ and Ê this resulted in 77 and 26 models, respectively, in the final sets (Supplementary mate- rial Appendix 4). Estimation of standardized coefficients via model averaging recovered qualitative results largely consis- tent with univariate analyses of boot-strapped confidence intervals and two-way ANCOVA (Table 1). As with analyses
−0.3
−0.2
−0.1 0.0 0.1 0.2 0.3
Log response ratio
(A)
Across systems
(B)
T F M
Richness Evenness
−0.3
−0.2
−0.1 0.0 0.1 0.2 0.3
Figure 1. Mean effect sizes 95% bootstrapped confidence intervals from temperature change experiments on community species rich- ness and evenness across ecosystems. (A) Overall mean temperature effects on log-response ratios for richness (Ŝ) and evenness (Ê) across ecosystem types. (B) Mean temperature effects on richness and evenness in terrestrial, freshwater and marine ecosystems.
Closed symbols indicate log-response ratios for richness (Ŝ), and open symbols represent evenness (Ê).
Figure 2. Bivariate relationships of the (A, D) intensity of experimental temperature change (ΔT in degrees centigrade); (B, E) experimental duration (ln-transformed days), and (C, F) experimental unit area (ln-transformed m2) with log-response ratios of (A–C) richness (Ŝ) and (D–F) evenness. Each point represents the log-response ratio from one independent experiment (terrestrial, black circles; freshwater, dark grey squares; marine, light grey triangles). System-specific regression lines (terrestrial, heavy dash; freshwater, stipple; marine, dash-stipple) are shown to indicate significant statistical interaction in ANCOVA analysis (richness ∼ logarea system).
effects of warming. As with study duration in our database, the spatial scale of experimental units (e.g. the footprint of open-top warming chambers) was tied to ecosystem types, with larger experimental units more typical on land. In con- trast to scales of time, experimental unit area was positively related to Ŝ, but only in marine studies (Fig. 2C; Supple- mentary material Appendix 2 Table A2). In marine experi- ments, the effects of warming on richness were more strongly negative in the smallest experimental units, which may reflect more consistent and effective warming of smaller volumes of water and a greater likelihood that fewer individuals and species were included within units.
Chase and Knight (2013) recently warned of other sources of scale-dependence in log response ratios of species diversity. Using simulations, they showed that effect sizes of of declining richness over time scales relevant to both the
growth of individual species and to community dynamics.
Nonetheless, short-term experiments are not necessarily predictive of longer-term experiments (Chapin et al. 1995), which remain critical to identification of the mechanisms of community change, species migration, and local extinction predicted with sustained environmental change (Fridley et al.
2011, Elmendorf et al. 2012, Rudgers et al. 2014). More- over, the general importance of adaptive or evolutionary responses, which can delay or prevent extinction following environmental change, warrants further study (Parmesan 2006, Bell and Gonzalez 2009, Lavergne et al. 2010).
Given that habitat size is a canonical determinant of species diversity from local to global scales, we also hypothesized that the size (area) of treatment units may influence experimental
Table 1. Model-averaged coefficients, standard errors, z-tests at p-values for parameters included within final model sets for richness (Ŝ) and evenness (Ê). Each coefficient is the weighted average, proportional to the Akaike weights (wi) for each model, across the subset of models which contained that variable.
Richness LRR (Ŝ) Evenness LRR (Ê)
Source Estimate SE z p Estimate SE z p
(Intercept) –0.091 0.022 4.10 0.001 –0.060 0.037 1.61 0.108
system: freshwater 0.022 0.050 0.43 0.665 0.014 0.087 0.16 0.877
system: marine –0.121 0.066 1.82 0.068 –0.007 0.103 0.06 0.949
system: terrestrial –0.119 0.065 1.84 0.066 –0.088 0.077 1.13 0.259
openness: closed 0.053 0.074 0.71 0.479 0.001 0.075 0.01 0.994
openness: open –0.036 0.060 0.60 0.551 –0.027 0.057 0.48 0.635
trophic: consumers –0.011 0.066 0.17 0.862 –0.003 0.053 0.05 0.957
trophic: producers –0.101 0.061 1.66 0.097 –0.098 0.051 1.90 0.058
venue: lab 0.126 0.071 1.77 0.077 –0.049 0.090 0.54 0.590
venue: field –0.024 0.068 0.35 0.729 –0.052 0.044 1.18 0.237
ΔT –0.023 0.026 0.86 0.389 0.008 0.034 0.23 0.818
duration –0.024 0.031 0.79 0.432 –0.016 0.039 0.40 0.689
area 0.058 0.025 2.28 0.022 –0.023 0.037 0.61 0.540
ambient T –0.036 0.021 1.68 0.092 –0.014 0.038 0.37 0.712
latitude 0.015 0.023 0.65 0.515 –0.026 0.035 0.71 0.476
Freshwater systems seem to indicate a third pattern, as species diversity (evenness and richness) was unaffected on average by temperature manipulations. Biotic commu- nities in rivers, ponds and many lakes may be resistant or resilient to abrupt or persistent changes in temperature, as such traits should be adaptive for species in smaller water bodies that are exposed to frequent temperature swings (de Senerpont Domis et al. 2013). For example, in freshwater mesocosm experiments, warming resulted in stronger producer-consumer interactions, leading to shifts in the timing of spring blooms but not to changes in diversity (Berger et al. 2010, 2014). Although this scenario was not represented in our database, with warming these systems can be susceptible to blooms of toxic cyanobacteria, particularly when synergized with nutrient loading and reduced grazing, that may reduce local richness and evenness (Hillebrand et al.
2007, Paerl and Huisman 2008, Anneville et al. 2015).
General mechanisms
Our meta-analysis quantitatively tested the effects of sustained changes in temperature on species diversity in local communities, yet questions remain about the rela- tive importance of abiotic and biotic mechanisms. Species losses may be attributable directly to the rise of tempera- ture beyond species’ thermal tolerances, though average temperature increases were not large, and were an order of magnitude lower than annual temperature variability at study locations. This mechanism may be particularly impor- tant in environments that incorporate increased variance in temperature, where discrete heat shock events cause mass mortality of sensitive species in the community (Sorte et al.
2010). Alternatively, or in addition, increased temperatures may change the outcome of biotic interactions. Multiple reports included in our analysis argue that competitive displacement was an important mechanism for reductions in richness, with accelerated competitive exclusion related to warmer temperatures (Klanderud and Totland 2005, Limberger et al. 2014). In tundra ecosystems, declines in bryophytes, ferns and lichens are often attributable to enhanced growth of vascular plants that are more competi- tive at higher temperatures (Walker et al. 2006, Elmendorf et al. 2012). Warming can increase metabolism and activ- ity of consumers, which then mediate species coexistence of lower trophic levels via trophic interactions (Harley 2011, Li et al. 2011, Alsterberg et al. 2013). However, our data- base cannot quantitatively assess the overall and relative importance of complex, temperature-mediated abiotic and biotic interactions observed in specific studies (Tylianakis et al. 2008, Lavergne et al. 2010).
Rescue from deleterious temperature effects may depend on the potential for dispersal or colonization into local com- munities (Amarasekare 2003, Urban et al. 2012). However, in our analysis open systems exposed to warming did not retain more diversity than closed systems overall. In fact, results trended towards more negative effects of warming on richness in open than in closed experiments, and in field experiments relative to those in the lab (Table 1). Plots open to colonists also may be accessible by consumers or other antagonists that could reduce richness locally. However, ther- mal optima of species able to colonize from the immediate richness, species density, and rarefied richness (controlled
for abundance) can be sensitive to the spatial grain, spatial extent, and the size of the total species pool across studies.
Thus, to assess the scale-dependence of diversity effect sizes in this study, we extracted the total number of species observed, if reported by the authors in each study, as an estimate of the total species pool. We detected no relationship for richness or evenness effect sizes to the estimated species pool size (natural log-transformed), nor did these results vary by eco- system type (Supplementary material Appendix 5 Fig. A8).
The definition of regional pools of species is itself sensitive to scale and a notoriously problematic exercise (Cornell and Harrison 2014), yet this will remain important for future empirical work until authors uniformly report data for spatial grain and extent, species pool sizes, and levels of intraspecific aggregation within communities (Chase and Knight 2013).
Patterns within ecosystems
Negative richness and evenness responses in terrestrial systems suggest that warming caused an increase in dominance (lower evenness) related to the loss of species (lower richness).
Increased dominance of a single or few species can enhance the risk for cascading local extinctions (Zarnetske et al.
2012). These changes were often attributable to pronounced shifts in functional groups. For example in tundra ecosys- tems, with increasing temperatures vascular plants generally increase at the expense of mosses and lichens (Cornelissen et al. 2001, Walker et al. 2006, Lang et al. 2012). Mycorrhizal mutualists may respond positively to warming and differen- tially favor plant species, perhaps due to an enhanced role in water uptake with drier soils under experimental warming (Rudgers et al. 2014). A more intensive analysis of tundra studies showed that species turnover and shifts in community composition, although highly contingent on climatic condi- tions across regions, may be more pronounced than indicated by overall effects on richness (Elmendorf et al. 2012). In ter- restrial ecosystems more generally, rising mean temperatures are associated with increased evapotranspiration, variability in temperature and precipitation, drought or flooding, and heightened frequency and intensity of wildfires (Piñol et al.
1998, Huntington et al. 2009). General declines in local diversity observed here may be hastened by other aspects of global change on land, such as rising atmospheric CO2, nutri- ent addition, and the loss of organisms at higher trophic levels (Russell et al. 2009, Borer et al. 2014, Ripple et al. 2015).
Marine systems reflected the overall pattern across all systems: richness was strongly reduced by warming, but evenness was unaffected. This result suggests that rare species were not disproportionately impacted by warming, as the loss of rare species should result in increased evenness. This pattern has been described in some temperate intertidal ecosystems, where dominant species at moderate tempera- tures are more susceptible to higher mean temperatures and to extreme events (Harley and Paine 2009). Although our study could not address effects of changing variance in temperature, research in coastal zones highlights the poten- tial for threshold responses of biotic communities to rising frequency of severe heat waves or decreasing frequency of hard freeze events (Harley and Paine 2009, Smith 2011, Cavanaugh et al. 2014).
associated with warming. This discrepancy likely arises because the poleward edge of species ranges tends to move faster than the trailing, equator-ward edge of their ranges (Poloczanska et al. 2013). This reflects the relatively rapid potential rate of immigration towards a new area, compared to slower rates of extinction, for example with altered competi- tive or trophic interactions. The experiments synthesized here often precluded or reduced immigration, and thus address a facet of warming that is potentially masked in large-scale biogeographic studies: the role of local species interactions (Zarnetske et al. 2012). It is thus likely that our results have higher bearing on the effect of warming on local communi- ties than on larger scales. It is well-known that environmental effects vary across scales. For example, while biodiversity is generally decreasing on a global scale, it is frequently increases on local scales (Sax and Gaines 2003). Our meta-analysis thus provides a valuable addition to our understanding of how climate change affects local species communities.
The response of diversity to multiple changes in a human- dominated world will almost certainly be non-additive (Dukes et al. 2005, but see Williams et al. 2013) and con- tingent on local environments and species composition.
Careful, long-term, multifactorial studies will be necessary in order to estimate the potential for interactions between different drivers of global change as well as the mechanisms, including both direct (e.g. on individual species’ physi- ological tolerances, survival, growth, and reproduction) and indirect (e.g. on species interactions) effects of temperature on species, that impact biodiversity.
Acknowledgements – Helge Norf, Jonathan Shurin, Patrick Thomas, and Markus Weitere shared unpublished data, and Elsa Cleland provided additional temperature information. We thank Jarrett Byrnes and Kyle Edwards for statistical advice, and Jim Brown, Alexander Forde, Cora Johnston, Nathan Kraft, Brian Thompson and Peter Wragg for critical comments that improved the manuscript.
Statement of authorship – DSG and MESB contributed equally to this publication.
Funding – The collaboration leading to this analysis was fostered during a symposium and workshop on the “Effects of global change on carbon sequestration and food web structure across ecosystems”
held in Oldenburg and Wilhelmshaven, Germany, and funded by the German Science Foundation (DFG Hi848/9).
References
Alsterberg, C. et al. 2013. Consumers mediate the effects of experimental ocean acidification and warming on primary producers. – Proc. Natl Acad. Sci USA 110: 8603–8608.
Amarasekare, P. 2003. Competitive coexistence in spatially struc- tured environments: a synthesis. – Ecol. Lett. 6: 1109–1122.
Anderson, D. R. 2008. Model based inference in the life sciences:
a primer on evidence. – Springer.
Angert, A. L. et al. 2011. Do species’ traits predict recent shifts at expanding range edges? – Ecol. Lett. 14: 677–689.
Anneville, O. et al. 2015. Blue-green algae in a “Greenhouse Century”?
New insights from field data on climate change impacts on cyanobacteria abundance. – Ecosystems 18: 441–458.
Barton, K. 2015. MuMIn: multi-model inference. – R package ver.
1.14.0.
Baselga, A. and Araújo, M. B. 2009. Individualistic vs community modelling of species distributions under climate change.
– Ecography 32: 55–65.
vicinity may not be sufficiently different to rescue diversity of the warmed treatments. Instead, compensation for local species losses may require long-distance dispersal of species from regions with matching adaptive thermal tolerances.
Whereas climate-induced shifts in species’ ranges have been observed in distinctly different ecosystems (Greenstein and Pandolfi 2008, Lenoir et al. 2008, Chen et al. 2011), empiri- cal studies also show widespread failure of species or biomes to ‘keep up’ with the pace of change and resulting smaller species pools in shifting ranges (Colwell et al. 2008, Pauli et al. 2012). Prediction of range shifts by integrating spe- cies distribution and downscaled climate models remains an imperfect science (Thuiller et al. 2008, Angert et al. 2011), and such analyses require much greater temporal and larger spatial scales than those covered by localized experiments in our databases (Leuzinger et al. 2011).
The responses of community evenness to warming were inconsistent, variable, and not explained by environmental or methodological variables extracted for this analysis across ecosystems. However, in a striking contrast from richness responses, the random effect of site identity explained up to ten times more variation in evenness log-response ratios than fixed effects alone across different models (marginal versus conditional R2; Supplementary material Appendix 2 Table A2). This result suggests that changes in species rela- tive abundances due to warming were contingent on shared features of sites where multiple independent experiments were carried out. Local species composition will determine the distribution of species traits, which then constrain the relative abundance of species and the strength and sign of biotic interactions in the community (Hillebrand et al.
2008). We then expect that species composition and even- ness in unwarmed controls will be highly conserved across multiple experiments within a site, thus constraining species evenness responses to warming.
Conclusions and outlook
The experimental studies incorporated in our meta-analysis strongly suggest that, on average across major types of organisms and ecosystems, local species richness is likely to decline as temperatures increase. This result was robust despite wide variation in organisms and methodologies across marine, freshwater and terrestrial systems. Our meta-analysis evaluated effects of warming on communities of produc- ers and consumers, including studies on diverse organisms such as fungi, microbes, algae, nematodes, aquatic inverte- brates, terrestrial arthropods, and vascular and non-vascular plants. As is typical with controlled ecological experiments, many studies were of limited spatial and temporal scale, and longer-lived plant communities, such as forests, and mobile animal communities are notable deficiencies in the database.
Responses of species evenness were not well explained by environmental and methodological variables, but instead were constrained by initial species composition or other unmeasured variables within study sites.
Some observational studies have highlighted no change or even increases in richness over time as temperatures have warmed (Hiddink and ter Hofstede 2008, Rosset et al. 2010).
This contrasts sharply with the results of the experiments summarized here, which clearly show a decrease in richness
Galipaud, M. et al. 2014. Ecologists overestimate the importance of predictor variables in model averaging: a plea for cautious interpretations. – Meth. Ecol. Evol. 5: 983–991.
Gardner, J. L. et al. 2011. Declining body size: a third universal response to warming? – Trends Ecol. Evol. 26:
285–291.
Gedan, K. B. and Bertness, M. D. 2009. Experimental warming causes rapid loss of plant diversity in New England salt marshes.
– Ecol. Lett. 12: 842–848.
Greenstein, B. J. and Pandolfi, J. M. 2008. Escaping the heat: range shifts of reef coral taxa in coastal Western Australia. – Global Change Biol. 14: 513–528.
Grueber, C. E. et al. 2011. Multimodel inference in ecology and evolution: challenges and solutions. – J. Evol. Biol. 24:
699–711.
Gruner, D. S. et al. 2016. Data from: Effects of experimental warming on biodiversity depend on ecosystem type and local species composition. – Dryad Digital Repository, < http://
dx.doi.org/10.5061/dryad.f5r3k >.
Hannemann, H. et al. 2016. The devil is in the detail: unstable response functions in species distribution models challenge bulk ensemble modelling. – Global Ecol. Biogeogr. 25:
26–35.
Harley, C. D. G. 2011. Climate change, keystone predation, and biodiversity loss. – Science 334: 1124–1127.
Harley, C. D. G. and Paine, R. T. 2009. Contingencies and compounded rare perturbations dictate sudden distributional shifts during periods of gradual climate change. – Proc. Natl Acad. Sci USA 106: 11172–11176.
Hedges, L. V. et al. 1999. The meta-analysis of response ratios in experimental ecology. – Ecology 80: 1150–1156.
Hiddink, J. G. and ter Hofstede, R. 2008. Climate induced increases in species richness of marine fishes. – Global Change Biol. 14: 453–460.
Hillebrand, H. and Gurevitch, J. 2014. Meta-analysis results are unlikely to be biased by differences in variance and replication between ecological lab and field studies. – Oikos 123:
794–799.
Hillebrand, H. et al. 2007. Consumer versus resource control of producer diversity depends on ecosystem type and producer community structure. – Proc. Natl Acad. Sci USA 104:
10904–10909.
Hillebrand, H. et al. 2008. Consequences of dominance: a review of evenness effects on local and regional ecosystem processes.
– Ecology 89: 1510–1520.
Huntington, T. G. et al. 2009. Climate and hydrological changes in the northeastern United States: recent trends and implica- tions for forested and aquatic ecosystems. – Can. J. For. Res.
39: 199–212.
Ibáñez, I. et al. 2006. Predicting biodiversity change: outside the climate envelope, beyond the species-area curve. – Ecology 87:
1896–1906.
Kardol, P. et al. 2010. Climate change effects on plant biomass alter dominance patterns and community evenness in an experimental old-field ecosystem. – Global Change Biol. 16:
2676–2687.
Klanderud, K. and Totland, O. 2005. Simulated climate change altered dominance hierarchies and diversity of an alpine bio- diversity hotspot. – Ecology 86: 2047–2054.
Klein, J. A. et al. 2004. Experimental warming causes large and rapid species loss, dampened by simulated grazing, on the Tibetan Plateau. – Ecol. Lett. 7: 1170–1179.
Kordas, R. L. et al. 2015. Intertidal community responses to field-based experimental warming. – Oikos 124: 888–898.
Lang, S. I. et al. 2012. Arctic warming on two continents has consistent negative effects on lichen diversity and mixed effects on bryophyte diversity. – Global Change Biol. 18:
1096–1107.
Bates, D. et al. 2014. lme4: linear mixed-effects models using Eigen and S4. – R package ver. 1.1-7.
Bates, D. et al. 2015. Fitting linear mixed-effects models using lme4. – J. Stat. Softw. 67: 1–48.
Bell, G. and Gonzalez, A. 2009. Evolutionary rescue can prevent extinction following environmental change. – Ecol. Lett. 12:
942–948.
Berger, S. A. et al. 2010. Water temperature and stratification depth independently shift cardinal events during plankton spring succession. – Global Change Biol. 16: 1954–1965.
Berger, S. A. et al. 2014. Separating effects of climatic drivers and biotic feedbacks on seasonal plankton dynamics: no sign of trophic mismatch. – Freshwater Biol. 59: 2204–2220.
Blankinship, J. C. et al. 2011. A meta-analysis of responses of soil biota to global change. – Oecologia 165: 553–565.
Blenckner, T. et al. 2007. Large-scale climatic signatures in lakes across Europe: a meta-analysis. – Global Change Biol. 13:
1314–1326.
Blois, J. L. et al. 2013. Climate change and the past, present and future of biotic interactions. – Science 341: 499–504.
Borer, E. T. et al. 2014. Herbivores and nutrients control grassland plant diversity via light limitation. – Nature 508: 517–520.
Buckland, S. T. et al. 1997. Model selection: an integral part of inference. – Biometrics 53: 603–618.
Burnham, K. P. and Anderson, D. R. 2002. Model selection and multimodel inference: a practical information-theoretic approach. – Springer.
Canty, A. and Ripley, B. 2014. boot: bootstrap R (S-Plus) functions.
– R package ver. 1.3-1.
CaraDonna, P. J. et al. 2014. Shifts in flowering phenology reshape a subalpine plant community. – Proc. Natl Acad. Sci. USA 111: 4916–4921.
Cavanaugh, K. C. et al. 2014. Poleward expansion of mangroves is a threshold response to decreased frequency of extreme cold events. – Proc. Natl Acad. Sci. USA 111: 723–727.
Chapin, F. S. et al. 1995. Responses of arctic tundra to experimental and observed changes in climate. – Ecology 76: 694–711.
Chase, J. M. and Knight, T. M. 2013. Scale-dependent effect sizes of ecological drivers on biodiversity: why standardised sampling is not enough. – Ecol. Lett. 16: 17–26.
Chen, I.-C. et al. 2011. Rapid range shifts of species associated with high levels of climate warming. – Science 333: 1024–1026.
Colwell, R. K. et al. 2008. Global warming, elevational range shifts, and lowland biotic attrition in the wet tropics. – Science 322:
258–261.
Cornelissen, J. H. C. et al. 2001. Global change and arctic ecosystems: is lichen decline a function of increases in vascular plant biomass? – J. Ecol. 89: 984–994.
Cornell, H. V. and Harrison, S. P. 2014. What are species pools and when are they important? – Annu. Rev. Ecol. Evol. Syst.
45: 45–67.
Dawson, T. P. et al. 2011. Beyond predictions: biodiversity conservation in a changing climate. – Science 332: 53–58.
de Senerpont Domis, L. N. et al. 2013. Plankton dynamics under different climatic conditions in space and time. – Freshwater Biol. 58: 463–482.
Dukes, J. S. et al. 2005. Responses of grassland production to single and multiple global environmental changes. – PLoS Biology 3: e319.
Elmendorf, S. C. et al. 2012. Global assessment of experimental climate warming on tundra vegetation: heterogeneity over space and time. – Ecol. Lett. 15: 164–175.
Englund, G. et al. 1999. The importance of data-selection criteria:
meta-analyses of stream predation experiments. – Ecology 80:
1132–1141.
Fridley, J. D. et al. 2011. Soil heterogeneity buffers community response to climate change in species-rich grassland. – Global Change Biol. 17: 2002–2011.
Rustad, L. E. et al. 2001. A meta-analysis of the response of soil respiration, net nitrogen mineralization, and aboveground plant growth to experimental ecosystem warming. – Oecologia 126: 543–562.
Sax, D. F. and Gaines, S. D. 2003. Species diversity: from global decreases to local increases. – Trends Ecol. Evol. 18: 561–566.
Schielzeth, H. 2010. Simple means to improve the interpretability of regression coefficients. – Meth. Ecol. Evol. 1: 103–113.
Sentis, A. et al. 2014. Towards a mechanistic understanding of temperature and enrichment effects on species interaction strength, omnivory and food-web structure. – Ecol. Lett. 17:
785–793.
Shaver, G. R. et al. 2000. Global warming and terrestrial ecosys- tems: a conceptual framework for analysis. – BioScience 50:
871–882.
Smith, M. D. 2011. The ecological role of climate extremes: current understanding and future prospects. – J. Ecol. 99: 651–655.
Sorte, C. J. B. and White, J. W. 2013. Competitive and demographic leverage points of community shifts under climate warming.
– Proc. R. Soc. B 280.
Sorte, C. J. B. et al. 2010. Impacts of a simulated heat wave on com- position of a marine community. – Oikos 119: 1909–1918.
Sorte, C. J. B. et al. 2013. Poised to prosper? A cross-system com- parison of climate change effects on native and non-native species performance. – Ecol. Lett. 16: 261–270.
Stocker, T. F. et al. (eds) 2013. The physical science basis. Contrib.
Working Grp I to the 5th Assess. Rep. of the Intergovernmental Panel on Climate Change. – Cambridge Univ. Press.
Symonds, M. R. E. and Moussalli, A. 2011. A brief guide to model selection, multimodel inference and model averaging in behavioural ecology using Akaike’s information criterion.
– Behav. Ecol. Sociobiol. 65: 13–21.
Thuiller, W. et al. 2008. Predicting global change impacts on plant species’ distributions: future challenges. – Persp. Plant Ecol.
Evol. Syst. 9: 137–152.
Trainor, A. M. et al. 2014. Enhancing species distribution modeling by characterizing predator–prey interactions. – Ecol. Appl. 24:
204–216.
Tylianakis, J. M. et al. 2008. Global change and species interactions in terrestrial ecosystems. – Ecol. Lett. 11: 1351–1363.
Urban, M. C. et al. 2012. On a collision course: competition and dispersal differences create no-analogue communities and cause extinctions during climate change. – Proc. R. Soc. B 279:
2072–2080.
Walker, M. D. et al. 2006. Plant community responses to experimental warming across the tundra biome. – Proc. Natl Acad. Sci. USA 103: 1342–1346.
Whittingham, M. J. et al. 2006. Why do we still use stepwise modelling in ecology and behaviour? – J. Anim. Ecol. 75:
1182–1189.
Williams, S. L. et al. 2013. Additive effects of physical stress and herbivores on intertidal seaweed biodiversity. – Ecology 94:
1089–1101.
Wischnewski, J. et al. 2011. Terrestrial and aquatic responses to climate change and human impact on the southeastern Tibetan Plateau during the past two centuries. – Global Change Biol.
17: 3376–3391.
Wu, Z. et al. 2011. Responses of terrestrial ecosystems to temperature and precipitation change: a meta-analysis of experimental manipulation. – Global Change Biol. 17: 927–942.
Yang, L. H. et al. 2010. A meta-analysis of resource pulse–consumer interactions. – Ecol. Monogr. 80: 125–151.
Zarnetske, P. L. et al. 2012. Biotic multipliers of climate change.
– Science 336: 1516–1518.
Lavergne, S. et al. 2010. Biodiversity and climate change: integrating evolutionary and ecological responses of species and communi- ties. – Annu. Rev. Ecol. Evol. Syst. 41: 321–350.
Lenoir, J. et al. 2008. A significant upward shift in plant species optimum elevation during the 20th century. – Science 320:
1768–1771.
Leuzinger, S. et al. 2011. Do global change experiments overesti- mate impacts on terrestrial ecosystems? – Trends Ecol. Evol.
26: 236–241.
Li, G. et al. 2011. Experimental warming induces degradation of a Tibetan alpine meadow through trophic interactions. – J.
Appl. Ecol. 48: 659–667.
Limberger, R. et al. 2014. Final thermal conditions override the effects of temperature history and dispersal in experimental communities. – Proc. R. Soc. B 281: 20141540.
Lukacs, P. M. et al. 2010. Model selection bias and Freedman’s paradox. – Ann. Inst. Stat. Math. 62: 117–125.
Maguire, K. C. et al. 2015. Modeling species and community responses to past, present, and future episodes of climatic and ecological change. – Annu. Rev. Ecol. Evol. Syst. 46: 343–368.
Nakagawa, S. and Schielzeth, H. 2013. A general and simple method for obtaining R2 from generalized linear mixed-effects models. – Meth. Ecol. Evol. 4: 133–142.
O’Connor, M. I. et al. 2007. Temperature control of larval dispersal and the implications for marine ecology, evolution and conservation. – Proc. Natl Acad. Sci. USA 104: 1266–1271.
Olsen, S. L. and Klanderud, K. 2014. Biotic interactions limit species richness in an alpine plant community, especially under experimental warming. – Oikos 123: 71–78.
Paerl, H. W. and Huisman, J. 2008. Blooms like it hot. – Science 320: 57–58.
Parmesan, C. 2006. Ecological and evolutionary responses to recent climate change. – Annu. Rev. Ecol. Evol. Syst. 37: 637–669.
Pauli, H. et al. 2012. Recent plant diversity changes on Europe’s mountain summits. – Science 336: 353–355.
Petchey, O. L. et al. 1999. Environmental warming alters food-web structure and ecosystem function. – Nature 402: 69–72.
Petersen, J. E. et al. (eds) 2009. Enclosed experimental ecosystems and scale: tools for understanding and managing coastal ecosystems. – Springer.
Piñol, J. et al. 1998. Climate warming, wildfire hazard, and wildfire occurrence in coastal eastern Spain. – Climatic Change 38:
345–357.
Poloczanska, E. S. et al. 2013. Global imprint of climate change on marine life. – Nat. Climate Change 3: 919–925.
Qian, S. S. et al. 2010. On the application of multilevel modeling in environmental and ecological studies. – Ecology 91: 355–361.
Reuman, D. C. et al. 2014. A metabolic perspective on competition and body size reductions with warming. – J. Anim. Ecol. 83:
59–69.
Ripple, W. J. et al. 2015. Collapse of the world’s largest herbivores.
– Sci. Adv. 1: e1400103.
Roberts, D. R. and Hamann, A. 2012. Predicting potential climate change impacts with bioclimate envelope models: a palaeoeco- logical perspective. – Global Ecol. Biogeogr. 21: 121–133.
Rosset, V. et al. 2010. Warmer and richer? Predicting the impact of climate warming on species richness in small temperate waterbodies. – Global Change Biol. 16: 2376–2387.
Rudgers, J. A. et al. 2014. Responses of high-altitude graminoids and soil fungi to 20 years of experimental warming. – Ecology 95: 1918–1928.
Russell, B. D. et al. 2009. Synergistic effects of climate change and local stressors: CO2 and nutrient-driven change in subtidal rocky habitats. – Global Change Biol. 15: 2153–2162.
Supplementary material (available online as Appendix oik- 03688 at < www.oikosjournal.org/appendix/oik-03688 >).
Appendix 1–5.