Edited by:
Cecile Guieu, Centre National de la Recherche Scientifique (CNRS), France
Reviewed by:
Haimanti Biswas, National Institute of Oceanography, India Christophe Brunet, Stazione Zoologica Anton Dohrn, Italy
*Correspondence:
Kai G. Schulz kai.schulz@scu.edu.au
Specialty section:
This article was submitted to Marine Biogeochemistry, a section of the journal Frontiers in Marine Science
Received:02 December 2016 Accepted:20 February 2017 Published:22 March 2017
Citation:
Schulz KG, Bach LT, Bellerby RGJ, Bermúdez R, Büdenbender J, Boxhammer T, Czerny J, Engel A, Ludwig A, Meyerhöfer M, Larsen A, Paul AJ, Sswat M and Riebesell U (2017) Phytoplankton Blooms at Increasing Levels of Atmospheric Carbon Dioxide: Experimental Evidence for Negative Effects on Prymnesiophytes and Positive on Small Picoeukaryotes.
Front. Mar. Sci. 4:64.
doi: 10.3389/fmars.2017.00064
Phytoplankton Blooms at Increasing Levels of Atmospheric Carbon
Dioxide: Experimental Evidence for Negative Effects on Prymnesiophytes and Positive on Small Picoeukaryotes
Kai G. Schulz1, 2*, Lennart T. Bach2, Richard G. J. Bellerby3, 4, Rafael Bermúdez2, 5, Jan Büdenbender2, Tim Boxhammer2, Jan Czerny2, Anja Engel2, Andrea Ludwig2, Michael Meyerhöfer2, Aud Larsen6, Allanah J. Paul2, Michael Sswat2and Ulf Riebesell2
1Centre for Coastal Biogeochemistry, School of Environment, Science and Engineering, Southern Cross University, Lismore, NSW, Australia,2GEOMAR Helmholtz Centre for Ocean Research Kiel, Kiel, Germany,3SKLEC-NIVA Centre for Marine and Coastal Climate Research, East China Normal University, Shanghai, China,4Norwegian Institute for Water Research, Bergen, Norway,5Facultad de Ingeniería Marítima, Ciencias Biológicas, Oceánicas y Recursos Naturales, Escuela Superior Politécnica del Litoral (ESPOL), Guayaquil, Ecuador,6Uni Research Environment, Hjort Centre for Marine Ecosystems Dynamics, Bergen, Norway
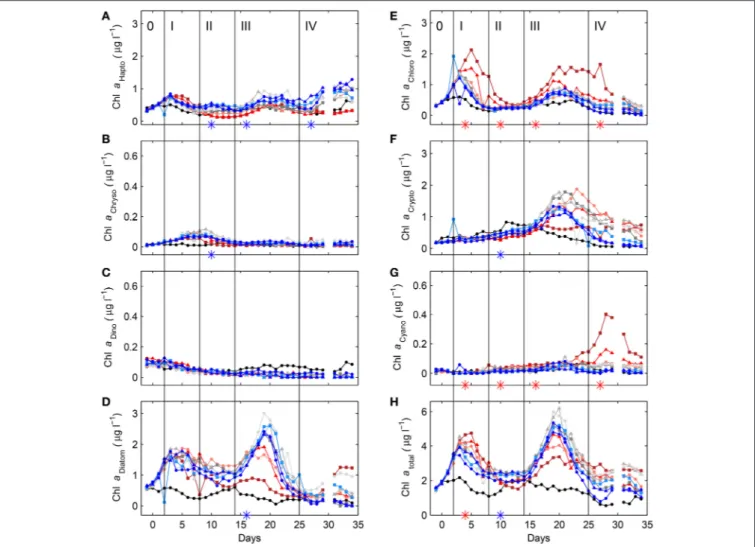
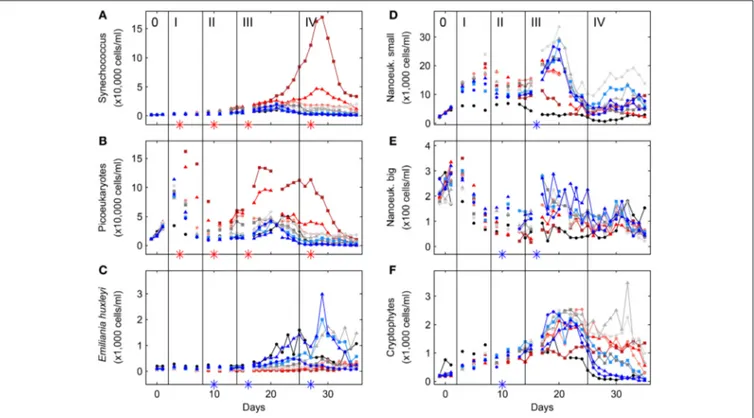
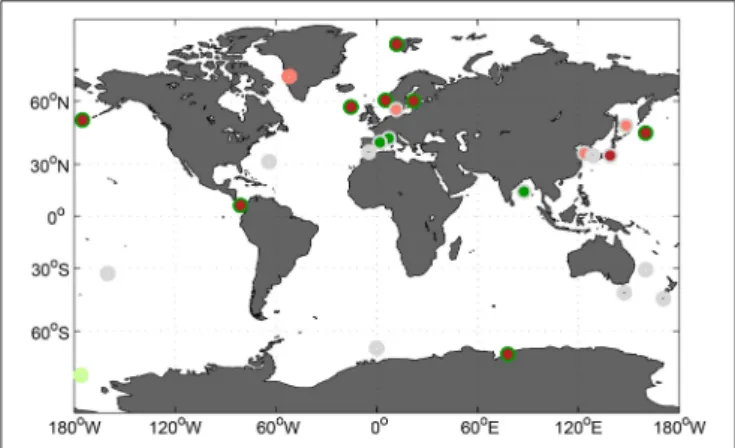
Anthropogenic emissions of carbon dioxide (CO2) and the ongoing accumulation in the surface ocean together with concomitantly decreasing pH and calcium carbonate saturation states have the potential to impact phytoplankton community composition and therefore biogeochemical element cycling on a global scale. Here we report on a recent mesocosm CO2 perturbation study (Raunefjorden, Norway), with a focus on organic matter and phytoplankton dynamics. Cell numbers of three phytoplankton groups were particularly affected by increasing levels of seawater CO2 throughout the entire experiment, with the cyanobacterium Synechococcus and picoeukaryotes (prasinophytes) profiting, and the coccolithophore Emiliania huxleyi (prymnesiophyte) being negatively impacted. Combining these results with other phytoplankton community CO2 experiments into a data-set of global coverage suggests that, whenever CO2 effects are found, prymnesiophyte (especially coccolithophore) abundances are negatively affected, while the opposite holds true for small picoeukaryotes belonging to the class of prasinophytes, or the division of chlorophytes in general. Future reductions in calcium carbonate-producing coccolithophores, providing ballast which accelerates the sinking of particulate organic matter, together with increases in picoeukaryotes, an important component of the microbial loop in the euphotic zone, have the potential to impact marine export production, with feedbacks to Earth’s climate system.
Keywords: phytoplankton, CO2, ocean acidification, community composition, prymnesiophytes, coccolithophores, picoeukaryotes
1. INTRODUCTION
Increasing levels of atmospheric carbon dioxide (CO2) as the result of anthropogenic burning of fossil fuels, and variations in land-use and deforestation are driving a number of environmental changes on a global scale (Ciais et al., 2013). In the surface ocean, simultaneous CO2 concentration increases reduce pH and calcium carbonate saturation states (). Increasing CO2 and decreasing seawater pH have the potential to selectively affect the photosynthetic activity and growth of marine phytoplankton, due to individual sensitivities of so-called carbon concentrating mechanisms (for a review see e.g.,Giordano et al., 2005; Reinfelder, 2010). Declining pH and are thought to be of special importance for marine calcifiers such as corals, mollusks or the autotrophic group of pelagic coccolithophores (see Kroeker et al., 2010for a meta- analysis but also Cyronak et al., 2016a,b; Waldbusser et al., 2016 for a discussion on the role of individual carbonate chemistry parameters). Furthermore, increasing surface ocean temperatures have been hypothesized to lead to the shoaling of the upper mixed layer depth, changing light and nutrient availability for marine primary producers. This has the potential to impact marine primary productivity (Bopp et al., 2001; Boyd and Doney, 2002) and marine export production (Laufkötter et al., 2016). The mechanisms behind such changes include phytoplankton species specific requirements and sensitivities for CO2 and HCO−3, pH, inorganic nutrients, light and temperature, which in turn will influence community composition, a major factor shaping export efficiency, i.e., the ratio of carbon exported to the depth of the euphotic zone (<1% light penetration) to surface net primary production, and transfer efficiency in the deep ocean, i.e., the ratio of carbon reaching deeper layers to export production. Together, the attenuation of the organic carbon flux with depth and marine primary productivity ultimately determine the amount of atmospheric carbon locked away in the deeper ocean for timescales beyond decades (compare e.g.,Buessler and Boyd, 2009; De La Rocha and Passow, 2014; Mouw et al., 2016).
Assessing the impact of increasing CO2 levels and associated carbonate chemistry changes on phytoplankton community composition require incubations of natural assemblages, allowing for species interaction and competition. Experimental setups vary in a number of aspects, including location, duration and volume (Table 1), which could influence observed responses. For instance, the larger the experimental volume, the more trophic levels can be accommodated, adding important processes such as grazing by and of herbivores (for an overview see Riebesell et al., 2013and references therein). And the longer an experiment can be run, the higher the likelihood for potential direct CO2
effects to become detectable and trigger indirect ones (Schulz et al., 2013).
There have been attempts to search for general patterns in phytoplankton community composition changes in response to changing carbonate chemistry by comparing past experiments (e.g.,Riebesell, 2004; Boyd et al., 2010; Gao et al., 2012). However, in the last 4 years alone the amount of studies investigating the effects of increasing CO2 levels on marine phytoplankton
community composition has more than doubled. This significant increase in available data should considerably facilitate the identification of general patterns.
Here we report on original results from a mesocosm CO2
perturbation study in Raunefjorden, Norway, in 2011 and compare the observed effects on phytoplankton community composition to similar studies at the same location. This allows identification of experimental differences, potentially responsible for differing results. In a second step, community composition responses to increasing CO2 are compared across thirty one studies, in an attempt to identify repeating general patterns within certain phytoplankton groups. Finally, potential impacts of changes in phytoplankton community composition on biogeochemical element cycling are discussed.
2. METHODS
2.1. Mesocosm Setup
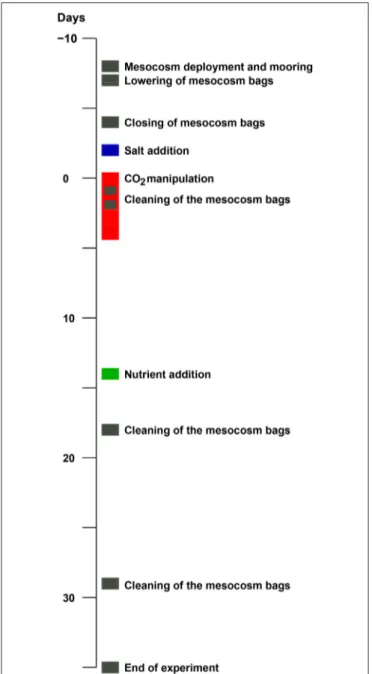
On 30 April 2011 (day -8) nine mesocosms were deployed from the research vessel R/V Alkor in Raunefjorden, Norway, and moored in rows of three at about 60.265◦N and 5.205◦E. The experimental setup and design of this KOSMOS study (Kiel Off- Shore Mesocosms for future Ocean Simulations) was similar to a previous one in Kongsfjorden on the west coast of Spitsbergen (for details seeRiebesell et al., 2013; Schulz et al., 2013). Briefly, following deployment and mooring of the floating structures (seeFigure 1for a chronology of major experimental events) the 25 m long and 2 m in diameter (0.5–1 mm thick) thermoplastic polyurethane bags were lowered to depth the next day, thereby enclosing a natural plankton community. Screens with a 3 mm mesh size attached to the bottom (instead of the funnel-shaped sediment trap) and top of the bags, excluded larger plankton species. Furthermore, the upper ring of the bags were pulled about 1.5 m underneath the water surface and the enclosed water was allowed to exchange freely with that of the surrounding fjord water passing by for an additional 3 days. Then on day−4 the screens were removed and the funnel-shaped sediment traps mounted by divers while the upper rings were pulled out of the water and attached about 1.5 m above the water line (see Figure S-1 for details). On top of the floating structures dome-shaped roofs were mounted to reduce potential freshwater and dirt input.
A full description of the KOSMOS setup can be found inRiebesell et al. (2013).
2.2. Volume Determination
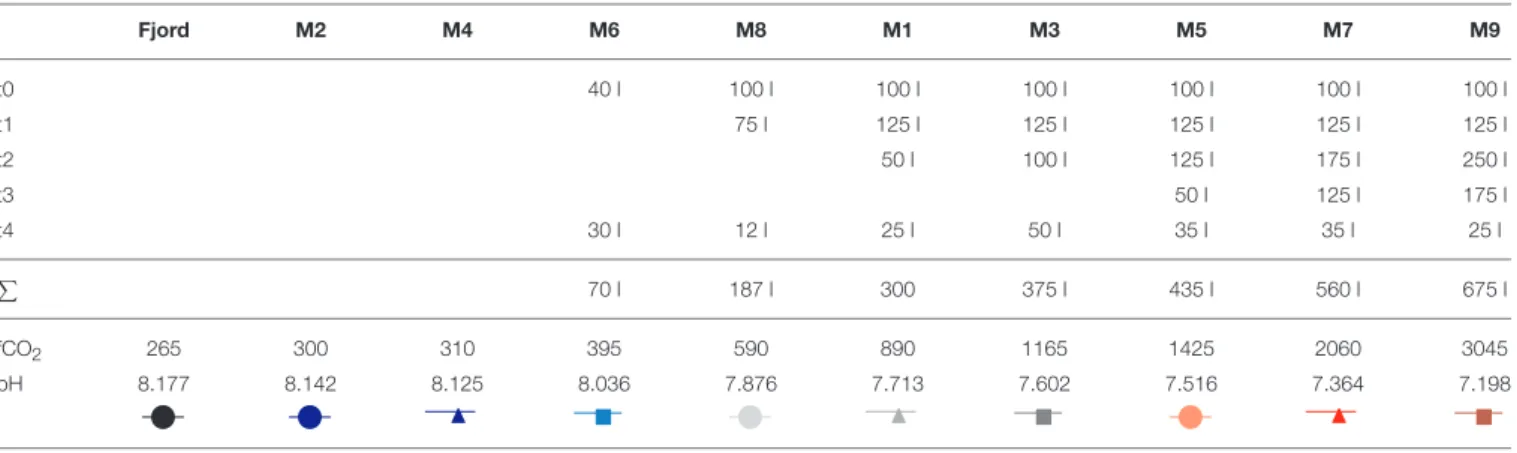
Adding a precisely calibrated brine solution of known mass to each of the mesocosms allows determination of the enclosed seawater volume by monitoring the change in salinity. Exact knowledge of the amount of seawater in each mesocosm is paramount for certain manipulations such as dissolved inorganic nutrient additions. A full description of this approach can be found inCzerny et al. (2013). To summarize, the hand-operated Sea and Sun Technology memory probe CTD 60M (for full sensor details and corresponding accuracy and precision see Schulz and Riebesell, 2013) was used to monitor vertical salinity profiles in each mesocosm before and after the even addition (∼100 kg per mesocosm) of the calibrated brine solution (∼300 g
TABLE1|ComparisonofpublishedexperimentsonCO2effectsonphytoplanktoncommunitycomposition,intermsofexperimentalsetupandfindings,i.e.,atdifferentlocations(Loc.),duration (Dur.)andnumberofsamplingdays(Sampl.),typeofincubation(Inc.)atin-situlightandtemperature(InSitu),semi-naturallightandtemperature(Deck)andfullycontrolledlightandtemperature (Lab)conditions,volume(Vol.),inorganicnutrient(Nut.)additionsandtiming,carbonatechemistrymanipulationapproach(Manip.),eitherbycombinedadditionsofsodiumcarbonate/bicarbonate andacid(Comb.),directCO2gasadditions(CO2),aerationattargetpCO2levels(Aer.),diffusiveCO2supply(Diff.),CO2saturatedseawateraddition(SWsat)oracid/baseadditions(Acid),number oftreatmentsandpCO2rangeapplied(CO2),methodsemployedtocharacterizephytoplanktoncommunitycomposition,beingitbylightmicroscopy(LM),flowcytometry(FM),pigmentanalysis (PA),FlowCam(FC)orgeneticapproaches(PCR),andmeasuredeffectsonparticulateorganicmatteringeneral(POM),diatoms(Diat.),haptophytes(Hapt.),picoeukaryotes(Pic.),Synechococcus (Syn.)orother(Oth.)phytoplanktongroupsincludingchrysophytes(Chrys.),cyanobacteriaingeneral(Cyano.),Prochlorococcus,(Prochl.)anddinoflagellates(Dino.). StudyLoc.Dur.(d)/Filtr.SetupInc.Vol.Nut.(d)Manip.CO2MethodsPOMDiat.Hapt.Pic.Syn.Oth.Rm. Smpl.(d)(µm)(L)(µatm) Biswasetal.,2012A5/2200batchDeck5.6+N,P(0)Comb.2(350–700)LM Biswasetal.,2015B5/2200batchDeck5*noneComb.3(460–730)LM,FM,PA⊗ Calbetetal.,2014C14/8nonebatchDeck2,500+N,P(0)CO22(400–1000)LM,FC1 Davidsonetal.,2016D10/6200batchLab650*noneSWsat6(80–2420)LM,FC¶2 Engeletal.,2005C19/18nonebatchInSitu15,000+N,P(0)Aer.3(200–700)FM1 Endoetal.,2013E14/4197batchDeck12noneAer.4(180-1000)LM,FM,PM Fengetal.,2009F14/2200s.-cont.Lab2.7+N,P(0)Aer.2(390–690)LM,FM,PAChrys.3 Gazeauetal.,2017G16-245000batchInSitu50,000noneSWsat6(450–1250)FM,PA§ Hamaetal.,2012H15/8100batchDeck500+N,P(0)Aer.3(400–1200)LM,FM4,5 Hopkinsetal.,2010C25/11-19nonebatchInSitu11,000+N,P(4)Aer.2(250–700)LM,FM¶1,6 Hoppeetal.,2013I30/2200s.-cont.Lab4*+Fe(0)Aer.3(190–800)LMrel.†7 Kimetal.,2006J14/360batchInSitu150+N,P(8)Aer.3(250–750)LMrel. Lawetal.,2012K5/3nonebatchDeck22noneDiff.2(400–750)FM,PCRCyano.8 Lomasetal.,2012L1-3/2nonebatchDeck1+N,P,Si,Fe(1)Comb.3(170–820)FMProchl. Maugendreetal., 2015G12/4200batchDeck4noneSWsat2(380–750)FM,PA Nealeetal.,2014G7/2-7200batchDeck20Remark8Aer.2(500–1000)LM,FM,PA9 Nielsenetal.,2010M14/4175s.-cont.Lab2.5*noneAcid3(500–1500)LM,PADiat.10 Nielsenetal.,2012N14/4250s.-cont.Lab2.5*noneAcid3(500–1500)LM,PA PaulA.J.etal.,2015O46/22-383000batchInSitu55,000*noneSWsat6(240–1650)LM,PA¶⊗11 Richieretal.,2014F4/3nonebatch.Lab4.5*noneComb.4(400–1000)LM,FM12 Rossoletal.,2013O30/7nonebatch.Lab300*+N,P,Si(8)Aer.5(390–4000)LMChrys.13 Salaetal.,2015G9/9nonebatch.Lab200‡noneCO22(400–800)LM,FMProchl.14 Schulzetal.,2008C25/18-23nonebatch.InSitu27,000+N,P(-1)Aer.3(350–1050)LM,FM,PA⊗1,15 Schulzetal.,2013P30/26-303000batch.InSitu45,000+N,P,Si(13)SWsat8(185–1420)LM,FM,PA§¶⊗16 Sommeretal.,2015O21/10nonebatch.Lab1,400*noneSWsat2(440–1040)LM,FMDino.17 Tattersetal.,2013Q14/280s.-cont.Lab1+N,P,Si,Fe(0)Aer.3(230–570)LM Thoisenetal.,2015Q16/4-9250s.-cont.Lab1.2*noneSWsat4(480–3800)LM•◦18 Tortelletal.,2002S11/4nones.-cont.Deck4*noneAer.2(150–750)LM,PM◦ (Continued)