BONUS BIO-C3
Biodiversity changes: causes, consequences and management implications
Deliverable No: 4.2 Workpackage number and leader: WP4, DTU Aqua
Date: 30.06.17 Delivery due date: July, 2017
Title: Report summarizing food web responses and interactions to changes in biodiversity and community species /trait composition
Lead partner for deliverable: DTU Aqua (P2)
Other contributing partners GEOMAR (P1), SU (P4), DHI (P9)
Authors Stefan Neuenfeldt, Burkhard v. Dewitz, Monika Winder, Anne Lise Middelboe
Neuenfeldt, S., Dewitz, B.v., Winder, M., Middelboe, A.L. (2017) Report summarizing food web responses and interactions to changes in biodiversity and community species/trait composition.
BIO-C3 Deliverable, D4.2. EU BONUS BIO-C3, 15 pp..+ 4 Appendices. DOI 10.3289/BIO-C3_D4.2.
Dissemination level (PU=public, PP=Restricted, CO=confidential) PU Nature of the Deliverable (RE=Report, OT=Other) RE
Acknowledgements
The research leading to these results is part of the BIO-C3 project and has received funding from BONUS, the joint Baltic Sea research and development programme (Art 185), funded jointly from the European Union’s Seventh Programme for research, technological development and demonstration and from national funding institutions.
1
BIO-C3 overview
The importance of biodiversity for ecosystems on land has long been acknowledged. In contrast, its role for marine ecosystems has gained less research attention. The overarching aim of BIO-C3 is to address biodiversity changes, their causes, consequences and possible management implications for the Baltic Sea. Scientists from 7 European countries and 13 partner institutes are involved. Project coordinator is the GEOMAR Helmholtz Centre for Ocean Research Kiel, Germany, assisted by DTU Aqua, National Institute of Aquatic Resources, Technical University of Denmark.
Why is Biodiversity important?
An estimated 130 animal and plant species go extinct every day. In 1992 the United Nations tried countering this process with the "Biodiversity Convention". It labeled biodiversity as worthy of preservation – at land as well as at sea. Biological variety should not only be preserved for ethical reasons: It also fulfils key ecosystem functions and provides ecosystem services. In the sea this includes healthy fish stocks, clear water without algal blooms but also the absorption of nutrients from agriculture.
Biodiversity and BIO-C3
To assess the role of biodiversity in marine ecosystems, BIO-C3 uses a natural laboratory: the Baltic Sea. The Baltic is perfectly suited since its species composition is very young, with current salt level persisting for only a few thousand years. It is also relatively species poor, and extinctions of residents or invasions of new species is therefore expected to have a more dramatic effect compared to species rich and presumably more stable ecosystems.
Moreover, human impacts on the Baltic ecosystem are larger than in most other sea regions, as this marginal sea is surrounded by densely populated areas. A further BIO-C3 focus is to predict and assess future anthropogenic impacts such as fishing and eutrophication, as well as changes related to global (climate) change using a suite of models.
If talking about biological variety, it is important to consider genetic diversity as well, a largely neglected issue. A central question is whether important organisms such as zooplankton and fish can cope or even adapt on contemporary time scales to changed environmental conditions anticipated under different global change scenarios.
BIO-C3 aims to increase understanding of both temporal changes in biodiversity - on all levels from genetic diversity to ecosystem composition - and of the environmental and anthropogenic pressures driving this change. For this purpose, we are able to exploit numerous long term data sets available from the project partners, including on fish stocks, plankton and benthos organisms as well as abiotic environmental conditions. Data series are extended and expanded through a network of Baltic cruises with the research vessels linked to the consortium, and complemented by extensive experimental, laboratory, and modeling work.
From science to management
The ultimate BIO-C3 goal is to use understanding of what happened in the past to predict what will happen in the future, under different climate projections and management scenarios: essential information for resource managers and politicians to decide on the course of actions to maintain and improve the biodiversity status of the Baltic Sea for future generations.
2
Contents
I. Executive Summary ... 3
II. Introduction ... 4
III. Core Activity ... 5
1. Impacts of changes in prey diversity on an exploited marine opportunistic predator ... 5
2. Efficiency of fisheries is increasing at the ecosystem level ... 6
3. Phytoplankton community interactions and environmental sensitivity in coastal and offshore habitats ... 8
4. Food web responses to eutrophication dynamics in a coastal environment: The Gulf of Riga ... 11
IV. Appendices ... 14
V. References ... 15
3
I. Executive Summary
In this deliverable, the goal was to synthesize the process knowledge generated in WPs 1-3 by including the findings into models that give information on population-, and ecosystem-level of organisation. This is a pre-requisite for projections (Task 4.3) and to derive indicators of ecosystem state (WP5).
Prey-dependent growth, including a bioenergetics sub-model and predator-prey-overlap, has been implemented in a multispecies model for Eastern Baltic cod, and sprat and benthic species.
Prey energy density is explicitly accounted for. The benthic species are represented by two different traits with different energy densities. Besides predation rates on sprat and small cod, the model can be used to assess the effects of changing benthic biodiversity on cod growth, but also secondary effects on compensatory feeding. The model can be falsified with historical growth rates, stomachs content information and survey data. The model is purely length based and circumnavigates the problem with age reading of Eastern Baltic cod. With the accumulation of historical growth rates (from the BONUS INSPIRE project) and monitoring cod growth in the future (currently initiated in a Baltic wide programme), the model will hopefully also be applicable in stock assessment.
Managing fisheries presents trade-offs between objectives, for example yields, profits, minimizing ecosystem impact, that have to be weighed against one another. These trade-offs are compounded by interacting species and fisheries at the ecosystem level. Weighing objectives becomes increasingly challenging when managers have to consider opposing objectives from different stakeholders. An alternative to weighing incomparable and conflicting objectives is to focus on win–wins until Pareto efficiency is achieved a state from which it is impossible to improve with respect to any objective without regressing at least one other. We investigated the ecosystem-level efficiency of fisheries in the Baltic and compared it to four other large marine ecosystems (LMEs) with respect to yield and an aggregate measure of ecosystem impact using a novel calibration of size-based ecosystem models. We estimated that fishing patterns in three LMEs (North Sea, Barents Sea and Benguela Current) are nearly efficient with respect to long-term yield and ecosystem impact and that efficiency has improved over the last 30 years. In two LM s (Baltic Sea and North East US Continental Shelf), fishing is inefficient and win–wins remain available. We additionally examined the efficiency of North Sea and Baltic Sea fisheries with respect to economic rent and ecosystem impact, finding both to be inefficient but steadily improving. Our results suggest the following: (i) a broad and encouraging trend towards ecosystem-level efficiency of fisheries; (ii) that ecosystem-scale win–wins, especially with respect to conservation and profits, may still be common; and (iii) single-species assessment approaches may overestimate the availability of win–wins by failing to account for trade-offs across interacting species.
A study on phytoplankton community interactions and environmental sensitivity in one coastal and offshore habitat in the Northern Baltic Proper has been published using multivariate autoregressive (MAR) models. Assessing the relative importance of environmental conditions and community interactions is necessary for evaluating the sensitivity of biological communities to anthropogenic change. Phytoplankton communities have a central role in aquatic food webs and biogeochemical cycles, therefore, consequences of differing community sensitivities may have broad ecosystem effects. Using two long-term time series (28 and 20 years) from the Baltic Sea, we evaluated coastal and offshore major phytoplankton taxonomic group biovolume patterns over annual and monthly time-scales and assessed their response to environmental drivers and biotic interactions. Overall, coastal phytoplankton responded more strongly to environmental anomalies than offshore phytoplankton, although the specific environmental driver changed with time scale. A trend indicating a state shift in annual biovolume anomalies occurred at both sites and the shift’s timing at the coastal site closely
4
tracked other long-term Baltic Sea ecosystem shifts. Cyanobacteria and the autotrophic ciliate Mesodinium rubrum were more strongly related than other groups to this trend with opposing relationships that were consistent across sites. On a monthly scale, biotic interactions within communities were rare and did not overlap between the coastal and offshore sites. Annual scales may be better able to assess general patterns across habitat types in the Baltic Sea, but monthly community dynamics may differ at relatively small spatial scales and consequently respond differently to future change
II. Introduction
Baltic Sea food webs are generally characterized by few key species supporting a high production of both marine and freshwater biota [HELCOM 2009, Ojaveer et al. 2010]. Because of this low complexity, Baltic pelagic and benthic ecosystems may be less resilient to perturbations that impact in particular those species exhibiting important ecosystem functions than other more species‐rich marine systems [HELCOM 2009,Loreau et al. 2001, Thompson et al. 2012]. The combination of future climate change (including increased temperature, reduced salinity and pH: [Meier et al. 2012] and other human forcing (e.g. eutrophication: [HELCOM 2007]) could significantly alter biodiversity and functions supported by it. However, these effects may be partly offset by immigration of non‐indigenous species capable of outcompeting or preying directly on local native populations. Exactly how Baltic Sea, and more generally marine, ecosystem functioning and Good Environmental Status (GES) depend on biodiversity, and vice versa, is unclear, as are the direction and magnitude of future changes in biodiversity‐
functioning relationships [HELCOM 2009, Tornroos & Bonsdorff 2012].
Work package 4 combines statistical analyses of existing long‐term national/international datasets and data generated in WPs 1‐3 with process and trait‐based modelling approaches and simulation modelling to investigate past and potential future variation of biodiversity. Scenarios will simulate how biodiversity will influence ecosystem functioning under changing multiple drivers (climate change, exploitation of fish and marine mammals, nutrient loading, non‐
indigenous species). Outputs will be provided to WP5 for GES and MFSD assessment.
The objectives are to:
• Review current hypotheses regarding relationships between biodiversity and ecosystem functioning for major functional groups and various trophic levels.
• Evaluate and synthesize effects of changing biodiversity (e. g. key species or trait assemblages) on food web interactions and ecosystem functioning using process and trait‐based models.
• Develop scenarios of the future biodiversity of the Baltic Sea at various levels of biological organization (populations, species, communities) and ecosystem
functioning under multiple combinations of drivers (climate change, exploitation of living resources, eutrophication, new species introductions).
In this deliverable the goal was to synthesize and scale the process knowledge generated in WPs 1-3 using (i) existing population and ecosystem models and (ii) food web models developed in task 2.1. These models are applied for case study regions and subsequently applied for projections (Task 4.3) and to derive MSFD indicators. The outputs are used in WP5 analyses of indicator sensitivities to external forcing, and quantification of impacts for marine protected areas.
5
III. Core Activity
1. Impacts of changes in prey diversity on an exploited marine opportunistic predator
Abstract /highlights
Prey-dependent growth, including a bioenergetics sub-model and predator-prey-overlap, has been implemented in a multispecies model for Eastern Baltic cod, and sprat and benthic species.
Prey energy density is explicitly accounted for. The benthic species are represented by two different traits with different energy densities. Besides predation rates on sprat and small cod, the model can be used to assess the effects of changing benthic biodiversity on cod growth, but also secondary effects on compensatory feeding. The model can be falsified with historical growth rates, stomachs content information and survey data. The model is purely length based and circumnavigates the problem with age reading of Eastern Baltic cod.
Progress
Analyses completed. An extended report is attached as Appendix.
Deviations from the work-plan None.
Introduction
The structuring impact of biodiversity on ecosystems in general and food-webs inside ecosystems in particular is to a large extent an auto-regressive process that is driven by trophic interactions. The objective of this study was to understand sprat population and cod growth dynamics in the wake of benthos decimation and changed diversity. A simple deterministic model has been set up consisting of a population dynamics part, a behaviour part and a bioenergetics part. The parts are linked so that the effect of changing benthic diversity on cod growth and sprat abundance at age can easiliy be extrapolated. Furthermore, the models allows for mechanistic interpretation and all parameters are measurable, at least theoretically.
Methods and results
The cod-sprat-benthos system was modelled using interlinked modules of population dynamics, predation and bioenergetics. The functional effects of changes in biodiversity were expressed as combination of prey abundances and their energy densities. It is, hence, impossible, to lump several prey species together according to energy density as descriptive trait.
Cod growth trajectories for cod staring at 18.4 cm total body length are depicted in Figure 1.
Under the baseline scenario A, cod grow during one year from 18.4 cm to about 37 cm length.
This increase is well in line with earlier, survey based observations in cod growth during the 1990s. However, for scenarios B and C, growth is clearly limited, although the decrease in consumption rate might imply a moderate decrease in growth. For scenario B, the cod grow only about 4 cm, and for scenario C 1 cm. The decrease in consumption of on average 18%
between Scenarios B and C results hence in a decrease in growth of about 85%. For more details, see Annex 1.
6
Figure 1: Cod length-growth according to the three Scenarios Scenario A green, Scenario B red, Scenario C blue.
Recommendations
The presented model is a minimum complication approach to quantifying the importance of biodiversity in food web interactions under the condition that only first principles are applied and all parameters should be measurable. It has shown that biodiversity has a massive impact on the food web, but that it is crucial how biodiversity is formulated. Using plainly the number of species in a system renders the accumulation of mechanistic knowledge almost impossible.
On the other hand, accounting for all species in the system the same wat as presented in our model might easily become very complex. One compromise would be a trait-based approach, and to this end, it appears useful to lump prey species together according to their energy content.
2. Efficiency of fisheries is increasing at the ecosystem level
Abstract /highlights
Managing fisheries presents trade-offs between objectives, for example yields, profits, minimizing ecosystem impact, that have to be weighed against one another. These trade-offs are compounded by interacting species and fisheries at the ecosystem level. Weighing objectives becomes increasingly challenging when managers have to consider opposing objectives from different stakeholders. An alternative to weighing incomparable and conflicting objectives is to focus on win–wins until Pareto efficiency is achieved: a state from which it is impossible to improve with respect to any objective without regressing at least one other. We investigate the ecosystem-level efficiency of fisheries in five large marine ecosystems (LMEs) with respect to yield and an aggregate measure of ecosystem impact using a novel calibration of size-based ecosystem models. We estimate that fishing patterns in three LMEs (North Sea, Barents Sea and Benguela Current) are nearly efficient with respect to long-term yield and ecosystem impact and that efficiency has improved over the last 30 years. In two LMEs (Baltic Sea and North East US Continental Shelf), fishing is inefficient and win–wins remain available.
We additionally examine the efficiency of North Sea and Baltic Sea fisheries with respect to
15 20 25 30 35 40
0 50 100 150 200 250 300 350 400
Length (cm)
Day
7
economic rent and ecosystem impact, finding both to be inefficient but steadily improving. Our results suggest the following: (i) a broad and encouraging trend towards ecosystem-level efficiency of fisheries; (ii) that ecosystem-scale win–wins, especially with respect to conservation and profits, may still be common; and (iii) single-species assessment approaches may overestimate the availability of win–wins by failing to account for trade-offs across interacting species.
Progress
Analyses completed. A published manuscript is attached as Appendix.
Deviations from the work-plan None.
Introduction
Efficiency frontier frameworks have become increasingly common in quantifying trade-offs in marine spatial planning, but have only sporadically been used to quantify trade-offs between broad fisheries management objectives at the scale of large marine ecosystems (LME). Here, we quantify trade-offs among yield, profit and ecosystem conservation objectives in five LMEs bordering three continents: the North Sea, the Baltic Sea, the Barents Sea, the Benguela Current and the North East US Continental Shelf (NEUSCS). To this end, we develop a novel calibration method for size-spectrum models that allows us to explore the effect of fishing different parts of the ecosystems. We use the calibrated models to simulate the efficiency frontier for each system and show how ecosystem exploitation. For more details, see Appendix 2.
Methods and results
We use size-spectrum models to calculate the effi- ciency frontiers in the considered LMEs.
Size-spectrum models are based on individual-level processes and therefore have the advantage that most of the parameters can be derived from metabolic theory or cross-species analysis. The models are based on a combination of the process of big individuals eating smaller ones leading to predation mortality on prey and available energy for predators, and a bioenergetic submodel that links the available energy for growth and reproduction to the asymptotic size of predator species
Fishery outcomes in the Baltic Sea were inefficient with respect to yield and ecological state.
We project that this large marine ecosystem has potential to increase yield over twofold without negatively impacting ecological state. The increase in our yield indicator in this system can be achieved by rebuilding stocks with lower exploitation rates than is employed in most recent year (Fig. 2).
8
Figure 2: Exploitation rate (mean yield per biomass, yield/biomass, for small, large and medium species) at the efficiency frontiers as a function of yield (1 mill. metric tonnes per year). The lines are smoothed by a loess function. Line thickness indicates fleets targeting small, medium or large species. 2010 exploitation pressure and total yield in equilibrium is denoted by the open circles (small, medium, large, for small, medium and large fleets, respectively).
Recommendations
We suggest using Pareto efficiency as a concept to guide management of exploited populations with conflicting objectives. The framework presented here emphasizes that the challenge of weighing objectives against one another does not have to impede consensus or progress as long as win–wins exist. In many of the cases in which the Pareto framework has been used – here included – available win–wins have been found to be common.
3. Phytoplankton community interactions and
environmental sensitivity in coastal and offshore habitats
Abstract /highlights
Assessing the relative importance of environmental conditions and community interactions is necessary for evaluating the sensitivity of biological communities to anthropogenic change.
Phytoplankton communities have a central role in aquatic food webs and biogeochemical cycles, therefore, consequences of differing community sensitivities may have broad ecosystem effects. Using two long-term time series (28 and 20 years) from the Baltic Sea, we evaluated coastal and offshore major phytoplankton taxonomic group biovolume patterns over annual and monthly time-scales and assessed their response to environmental drivers and biotic interactions. Overall, coastal phytoplankton responded more strongly to environmental anomalies than offshore phytoplankton, although the specific environmental driver changed with time scale. A trend indicating a state shift in annual biovolume anomalies occurred at both sites and the shift’s timing at the coastal site closely tracked other long-term Baltic Sea ecosystem shifts. Cyanobacteria and the autotrophic ciliate Mesodinium rubrum were more strongly related than other groups to this trend with opposing relationships that were consistent across sites. On a monthly scale, biotic interactions within communities were rare and did not overlap between the coastal and offshore sites. Annual scales may be better able to assess general patterns across habitat types in the Baltic Sea, but monthly community dynamics may differ at relatively small spatial scales and consequently respond differently to future change.
Progress
Analyses completed. A published manuscript is attached as Appendix.
Deviations from the work-plan None.
9 Introduction
As natural resource management is becoming increasingly holistic, with the focus shifting from individual species to whole ecosystems, there is substantial need to understand the relative importance of biotic interactions for the function and stability of ecosystems. Given the fundamental role of phytoplankton in aquatic systems, there is a need to better represent phytoplankton dynamics and variability in current food web models and other ecosystem model approaches. A first step in this direction is to characterize interactions within the phytoplankton community while accounting for environmental conditions to identify the relative importance of direct environmental effects, density dependent processes and inter-taxon interactions. We used time series analysis techniques to evaluate both long-term trends and community interactions in phytoplankton in the northern Baltic Sea and assessed the coherence of these patterns among coastal and offshore communities. Specifically, we addressed the following questions:
1. What is the sensitivity of major phytoplankton taxonomic group biovolumes to environmental conditions at monthly and annual scales?
2. Are there shared trends among annual major phytoplankton taxonomic group biovolume time series?
3. Do time series data reveal interactions within the phytoplankton community on a monthly scale and how wide-spread are interactions within the community?
For more details, see Appendix 3.
Methods and results
Coastal and offshore time series of northern Baltic Proper phytoplankton each demonstrated evidence of a trend shared among groups within the site but differed in their sensitivity to environmental conditions on both annual and monthly time scales (Figure 3). While interactions
10
among phytoplankton groups were rare overall, different group interactions were detected in coastal and offshore communities. These differences in interactions were observed despite strong similarities between sites in temperature and salinity, which are typically used to describe differences in community composition and taxa performance in the Baltic Sea. Some but not all taxonomic groups had significant autoregressive effects, with a similar range of magnitude at both sites. Our analyses indicated these two pelagic phytoplankton communities, from coastal and offshore habitats, differ in their relative sensitivity to environmental anomalies.
When coupled to a difference in interaction patterns, this suggests that these communities will respond in unique ways to future environmental change. It also underscores the challenge of inferring a more general understanding of community dynamics from single sites especially in highly variable and patchily distributed organisms. Dynamic factor analysis identified an underlying process (i.e. shared trend) which explained variation in annual biovolume of several phytoplankton groups in both coastal and offshore sites in addition to included environmental factors. Indeed, at both sites the trend transitioned in mean state although the shape and timing of the transition differed among sites. The coastal site had smooth transition initiated in the early-mid 1990s, while the offshore site trend had fluctuations from the mid- 1990s until an upward shift in mean state the early 2000s. This transition took place during a period previously described as having seen abrupt regime).
Recommendations
In many aspects the Baltic Sea can serve as a case study for the world’s estuaries due to its abiotic gradients and the many anthropogenic challenges facing it (e.g. eutrophication, fishing, invasive species). Yet we find that there is little predictability at the base of the food web as we investigate the monthly scale interactions of these rapidly responding primary producers. More coherent patterns among sites were observed on annual scales reinforcing that temporal scale affects our ability to generalize about taxa and community responses. Furthermore, capturing how complex ecological interactions will alter ecosystem functioning, and in turn services provided to people, is critical. Here we have taken the first step of evaluating plankton community interactions in a coastal and offshore site in the northern Baltic Sea. Analyses that broadly assess community interactions across the Baltic gradient, evaluate their dynamics over time, and connect them to emergent ecosystem properties are appropriate next steps to improve our understanding of community–ecosystem dynamics
Figure 3: Trend shared among annual major phytoplankton taxonomic group biovolume time series (left panel) and the effect of environmental covariates on group biovolume (right panel) from DFA models with greatest support for each site. Top row is the coastal site (1984–2011) and bottom row is the offshore site (1994–2011). Inset figures in the left panel show the phytoplankton group loadings onto the trend. Inset figures in the right panel show the time series of annual anomalies for the environmental covariate with the greatest explanatory power identified for each site. The coastal site DFA trend values and loading vectors (upper left plot) have been multiplied by –1 for visualization purposes
11
4. Food web responses to eutrophication dynamics in a coastal environment: The Gulf of Riga
Abstract /highlights
A downscaled benthic food-web model has been developed for the Gulf of Riga in order to reconstruct predator-prey interactions during the period of changing levels of eutrophication between 1990 and 2007. The coupled hydrodynamic, bio-geochemical and waterbird energetics modules predicted nutrient-related changes in phytoplankton growth, bivalve biomass and waterbird fitness. The results showed significant fine-scale covariance patterns across the entire food web with synchronous spatio-temporal trends between components. A 50 % decline in bivalve biomass was predicted in a well-defined zone characterised by the overall highest biomass of bivalves and highest densities of bivalve-feeding waterbirds. The nutrient-driven localised decline in productivity affected the entire food web with a predicted annual mortality of 72,000 Long-tailed Ducks. This model-based study suggests a strong nutrient control of the available food supply to predatory fish and birds in coastal areas. However, our results show that these effects are heterogenic with changing trends over the scale of less than 20 km. We argue that fine-scale ecosystem models are necessary tools to supplement national monitoring data and needed to achieve a process-based understanding of the ecological status of water bodies or MPAs.
Progress
Analyses completed. An extended report is attached as Appendix.
Deviations from the work-plan None.
Introduction
Although the nutrient literature abounds with studies identifying eutrophication and alterations of benthic animal populations among the dominant changes in estuarine systems (Pearson &
Rosenberg 1978, Cloern 2001, Bonsdorff et al. 2002) studies are lacking on food web responses to these changes. One of the most prominent components of benthivorous predators in the Baltic Sea is the concentrations of bivalve-feeding waterbirds during the non-breeding season. Of the approximately 10 million waterbirds wintering in the Baltic Sea more than 80 % are species specialized in foraging on bivalves (Durinck et al. 1994). Eutrophication impacts on bivalve populations differ between the different coastal regions of the Baltic Sea, and even within regions impacts may show a diversity of trends (Lundberg 2005). Thus, conceptual models showing responses of bivalve-feeding waterbirds to nutrient enrichment in coastal areas of the Baltic Sea may ideally represent a dome-shaped response reflecting both the impoverished benthic conditions and hypoxia in enclosed areas with mixing constraints and positive relations between eutrophication and the growth of bivalve stocks found in more exposed areas (Cloern 2001, Wolowicz et al. 2006).
A fine-scale ecosystem model has been set up in BIO-C3 for the Gulf of Riga covering the period between 1970 and 2007 (Rasmussen 2015). One of the main aims of the model has been to reconstruct dynamics in the benthic food webs based on local mussel populations and to estimate changes in predator-prey interactions during the period of changing levels of eutrophication between 1990 and 2007. To achieve this a seaduck energetics module has been
12
added to the model which estimates the condition, survival and mortality of two seaduck species, which function as key predators on mussels in the region; Long-tailed Duck Clangula hyemalis and Velvet Scoter Melanitta fusca.
Methods and results
A high-resolution food-web model complex has been developed to study the dynamics of the small-scale spatial structure of the biomasses of two bivalve species (Macoma baltica and Mytilus edulis) and related trophic interactions in the Gulf of Riga and Irbe Strait between 1990 and 2007 (Rasmussen 2015). The model complex consists of three interlinked components; an eutrophication model based on a coupled local biophysical and ecosystem model (MIKE 3 FM
& ECOLAB), a mussel population model and a seaduck energetics module. The eutrophication model describes the benthic ecosystem with phytoplankton, nitrogen (N) and phosphorus (P), chlorophyll-a, zooplankton, detritus (C, N & P), inorganic nutrients (dissolved inorganic nitrogen—DINNH4 N, NO3 N & PO4–P), total N and P nutrients (including dissolved organic N and P compounds) and dissolved Oxygen.
Weekly estimates of concentrations of Chl-a and biomass of mussels (g DW soft tissue/m2) were extracted and tested for spatio-temporal trends. As benthic productivity patterns typically show seasonal trends superimposed on spatial gradients the derivation of long-term trends in spatial structure and biomass was undertaken by analysing temporal trends on deseasoned biomass values at the scale of each grid node (5 km). Deseasoning was undertaken by subtracting the long-term average from each weekly estimate and standardising the resulting value to anomaly z-scores by dividing by the standard deviation. The non-parametric Median Trend (Theil 1950, Hoaglin et al. 2000) test was used to compute the size and significance of the trend for each of the 3040 grid nodes, which subsequently could be visualised to identify zones with similar trends. This is a robust non-parametric trend operator, which is highly recommended for assessing the rate of change in noisy time series, as it is less sensitive than least-squares estimators because it is much less sensitive to outliers. It is calculated by determining the slope between every pairwise combination and then finding the median value.
The Median Trend test was applied for the entire 18 year time series characterised by a steep decline in concentrations of Nitrogen between 1990 and 2007 (Skov 2016).
The seaduck energetics module was developed using an individual-based model describing the relationships between wintering Long-tailed Ducks and Velvet Scoters and their food resources with the aim of assessing possible impacts of change in mussel biomass caused by lower nutrient concentrations. The seaduck energetics module relates individual behaviours such as feeding activity, rate of food intake or interference to environmental factors and food availability and provides detailed insight into aspects, which constrain species fitness and numbers of birds using mussel resources. Also, the module accounts for already existing human pressures such as shipping traffic, by excluding birds from foraging in shipping lanes. The module is an adjusted version of the individual-based model on Common Eider developed in relation to the impacts assessment for the Fixed Link across the Fehmarn Belt between Germany and Denmark (FEBI 2013). The module was developed using a specialised software platform MORPH (Stillman 2008).
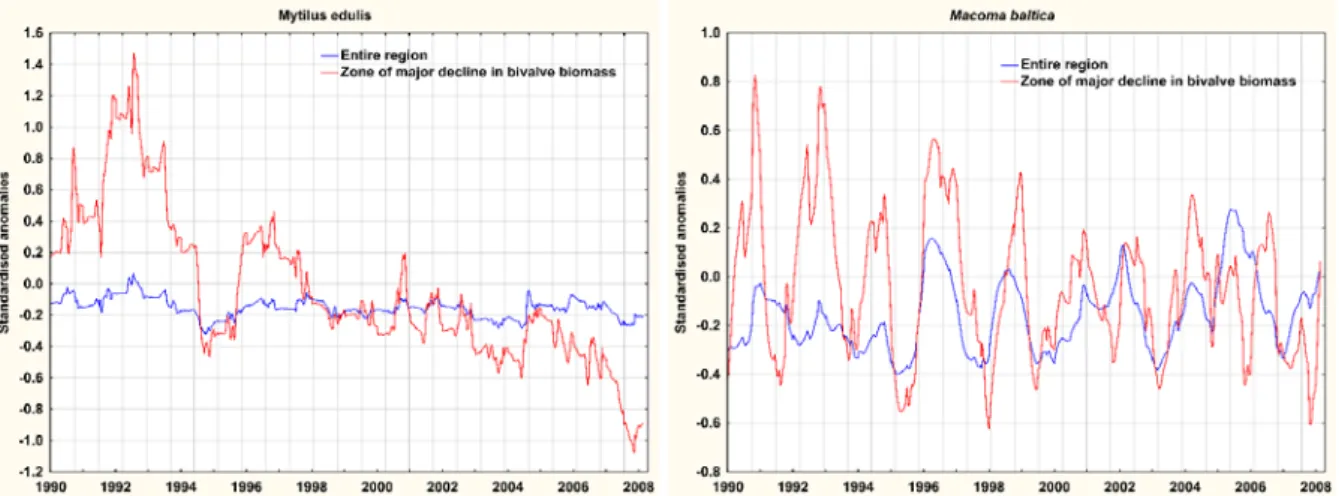
During the model period, synchronous spatio-temporal trends were identified across all food components with increasing trends in the southeastern part of the Gulf of Riga and the Gotland Basin and decreasing trends in the northwestern part of the Gulf of Riga and the Irbe Strait. The standardised trends in the components in the latter zone and the entire modelled region were strikingly different. In the region of decreasing productivity and benthic biomass a 50%
reduction in the biomass of blue mussels was estimated. When measured over the entire model
13
region no apparent trends in mussel biomass could be discerned. Standardised trends for Baltic clams were much weaker than for blue mussels, and negative z-scores were only estimated within the zone after 2006. Scenarios run with the seaduck energetics module estimated an extra mortality induced by the decline in mussel biomass of 73,000 Long-tailed Duck and 10,000 Velvet Scoter annually. The higher estimated mortality of Long-tailed Duck compared to Velvet Scoter is likely caused its stronger reliance on blue mussels.
Figure 4. Comparison of trends in biomass of Macoma baltica and Mytilus edulis between the area most affected by a decline in bivalve productivity and the entire Gulf of Riga during the period 1990-2007.
14
Figure 5. Modelled annual seaduck mortality in the Gulf of Riga depending on hypothetical change in bivalve resources from the level of 2001.
Recommendations
The model predictions, which indicate a severe knock-on effect of improved water quality management and reductions in nutrient (nitrate) concentrations on coastal ecosystems in the Baltic Sea stress the challenges ahead achieving synergies between targets for water quality and biodiversity conservation. The model predictions have been verified by strong declines in observed abundance of the two studied seaduck species between 1992 and 2009. Fine-scale ecosystem models provide strong tools to determine spatial gradients in the changes of coastal ecosystems. As such these models provide for an important supplement to monitoring activities in order to achieve a process-based understanding of the functioning and status required for a successful management of specific areas like marine protected areas.
IV. Appendices
1. Impacts of changes in prey diversity on an exploited marine opportunistic predator Unpublished and under embargo. Contact: Stefan Neuenfeldt, DTU Aqua,
stn@aqua.dtu.dk
2. Efficiency of fisheries is increasing at the ecosystem level
Available at: Jacobsen, N.S., Burgess, M.G. and Andersen, K.H., 2017. Efficiency of fisheries is increasing at the ecosystem level. Fish and Fisheries, 18(2), pp.199- 211. DOI: 10.1111/faf.12171
3. Phytoplankton community interactions and environmental sensitivity in coastal and offshore habitats
Available at: Griffiths, J.R., Hajdu, S., Downing, A.S., Hjerne, O., Larsson, U.
and Winder, M., 2016. Phytoplankton community interactions and environmental sensitivity in coastal and offshore habitats. Oikos, 125(8), pp.1134-1143.doi:
10.1111/oik.02405
15
4. Food web responses to eutrophication dynamics in a coastal environment: The Gulf of Riga
Unpublished and under embargo. Contact: Henrik Skov, DHI, hsk@dhigroup.com
V. References
Bonsdorff, E., C. Rönnberg, & K. Aarnio, 2002.Some ecological properties in relation to eutrophication in the Baltic Sea. Hydrobiologia 475/476: 371-377.
Cloern, J.E., 2001. Our evolving conceptual model of the coastal eutrophication model. Mar.
Ecol. Prog. Ser. 210: 223-253.
Durinck, J., H. Skov, F.P. Jensen & S. Pihl. 1994. Important Marine Areas for Wintering Birds in the Baltic Sea. EU DG XI research contract no. 2242/90-09-01. Ornis Consult report.
FEBI 2013. Fehmarnbelt Fixed Link Bird Services. Bird Investigations in Fehmarnbelt.
Baseline Report. Volume I-III. Report to Femern A/S.
Hoaglin, D.C., Mosteller, F., & Tukey, J.W. (2000) Understanding Robust and Exploratory Data Analysis. Wiley Classics Library Edition, New York, Wiley.
Helcom (2007) HELCOM Baltic Sea Action Plan 1‐101.
Helcom (2009) Biodiversity in the Baltic Sea – An integrated thematic assessment on
biodiversity and nature conservation in the Baltic. Balt. Sea Environ. Proc. No. 116B Loreau M, Naeem S, Inchausti P, Bengtsson J, Grime JP et al. (2001) Ecology ‐ biodiversity and ecosystem functioning: Current knowledge and future challenges. Science 294:
804‐808.
Meier HEM, Andersson HC, Arheimer B, Blenckner T, Chubarenko B et al. (2012) Comparing reconstructed past variations and future projections of the Baltic Sea ecosystem‐first results from multi‐model ensemble simulations. Environmental Research Letters 7: 034005 (8pp) doi:10.1088/1748‐9326/7/3/034005
Ojaveer H, Jaanus A, MacKenzie BR, Martin G, Olenin S et al. (2010) Status of Biodiversity in the Baltic Sea. PLoS ONE 5(9): e12467. doi:10.1371/journal.pone.0012467
Pearson,T. & R. Rosenberg. 1978. Macrobenthic succession in relation to organic enrichment and pollution of the marine environment, Oceanogr. Mar. Biol. Ann. Rev. 16: 229–
311.
Rasmussen, E.K. 2015. Development of ecosystem models. Input to BIO C3 WP 2.1. DHI.
Skov, H. 2016. Nutrient trends in the Baltic Sea 1970-2004. Input to BIO C3 WP 3.1. DHI.
Stillman, R.A. 2008. MORPH – An individual-based model to predict the effect of
environmental change on foraging animal populations. Ecological modelling, 216, 265-276.
Theil, H. 1950. A rank-invariant method of linear and polynomial regression analysis. I, II, III", Nederl. Akad. Wetensch., Proc., 53, 386–392, 521–525, 1397–1412.
Thompson RM, Brose U, Dunne JA, Hall RO, Hladyz S et al. (2012) Food webs: reconciling the structure and function of biodiversity. Trends in Ecology & Evolution 27: 689‐
697.
Tornroos A, Bonsdorff E (2012) Developing the multitrait concept for functional diversity:
lessons from a system rich in functions but poor in species. Ecological Applications 22: 2221‐2236.
Wolowicz, M., A. Sokolowski, A.S. Bawazir, & R. Lasota. 2006. Effect of eutrophication on the distribution and ecophysiology of the mussel Mytilus trossulus (Bivalvia) in southern Baltic Sea (the Gulf of Gdansk). Limnology and Oceanography 51 2-1: 580- 590.