Analysis
D I S S E R T A T I O N
zur Erlangung des akademischen Grades doctor rerum politicarum
(Doktor der Wirtschaftswissenschaft) im Fach Volkswirtschaft
eingereicht an der
Wirtschaftswissenschaftlichen Fakult¨at Humboldt-Universit¨at zu Berlin
von
Dipl.-Vw. Markus Kr¨atzig geboren am 16.11.1974 in Berlin
Pr¨asident der Humboldt-Universit¨at zu Berlin:
Prof. Dr. J¨urgen Mlynek
Dekan der Wirtschaftswissenschaftlichen Fakult¨at:
Prof. Dr. Joachim Schwalbach Gutachter:
1. Prof. Dr. Helmut L¨utkepohl 2. Prof. Dr. Bettina Berendt
eingereicht am: 21.12.2004
Tag der m¨undlichen Pr¨ufung: 04.02.2005
Es wird das Software FrameworkJStatComvorgestellt, welches die Enwick- lung von leistungsf¨ahigen grafischen Benutzerschnittstellen f¨ur Daten-basierte Analysemethoden wesentlich vereinfacht, wobei der Schwerpunkt auf Methoden der ¨Okonometrie, insbesondere der Zeitreihenanalyse liegt. Das Konzept besteht darin, s¨amtliche wiederkehrenden Aufgaben mit Hilfe von Java-Klassen zu l¨osen, sowie die Ausf¨uhrung von speziellen Algorithmen an externe Programme, wie z.B. Gauss oder Matlab, zu delegieren. Auf diese Weise k¨onnen schon existie- rende Prozeduren aus verschiedenen Programmiersprachen wiederverwendet wer- den. Weiterhin wird die ¨okonometrische AnwendungssoftwareJMulTi beschrie- ben, die auf Basis dieses Frameworks erstellt wurde.
Schlagw¨orter:
Zeitreihenanalyse, Wissenschaftliches Rechnen, Software Entwicklung, JMulTi
This work presents the software frameworkJStatComwhich is geared towards the development of powerful graphical user interfaces for data based analysis methods, especially for econometrics and time series analysis. The concept is to solve all recurring tasks with the help of Java classes and to delegate the exe- cution of special algorithms to external programs, for example Gauss or Matlab.
This way it is possible to reuse already existing procedures written in different programming languages. Furthermore, the econometric softwareJMulTiwill be presented which has been developed with the help of this framework.
Keywords:
time series analysis, scientific computing, software engineering, JMulTi
List of Figures xvi
List of Tables xviii
Abbreviations xix
Acknowledgements xxi
1 From Algorithms towards an integrated Framework 1
1.1 Problem Description . . . 1
1.2 JStatCom and JMulTi . . . 3
1.3 Access to Algorithms . . . 7
1.3.1 Using an Execution Engine . . . 7
1.3.2 Using Libraries and Toolkits . . . 9
1.3.3 Including Graphics . . . 11
1.3.4 Integrating available Tools . . . 13
1.4 JStatCom in comparison to other Approaches . . . 14
1.4.1 MulTi . . . 14
1.4.2 Observations on Entropy and Software Reuse . . . 14
1.4.3 The MMM Project . . . 16
1.4.4 The OmegaHat Project . . . 18
1.4.5 Creating GUI’s with Matlab . . . 19
1.4.6 Creating interactive Programs with Ox . . . 20
1.5 Concluding Remarks . . . 23
1.6 How to read this Thesis . . . 24 iv
2 A Motivating Example 26
2.1 Introduction . . . 26
2.2 A Step-by-Step Example . . . 27
2.2.1 System Requirements for this Example . . . 27
2.2.2 Step 1: Download/Install the Java Software Development Kit (J2SE SDK) . . . 28
2.2.3 Step 2: Download/Install the Eclipse IDE and some Plug-ins 28 2.2.4 Step 3: Download JStatCom and unpack it . . . 29
2.2.5 Step 4: Create an Eclipse Project . . . 30
2.2.6 Step 5: Create a new Package and a new Class . . . 31
2.2.7 Step 6: Layout the GUI with the Visual Editor . . . 36
2.2.8 Step 7: Add an Action to the Execute Button . . . 45
2.2.9 Step 8: Add the Module to the Main Application Frame . 45 2.2.10 Step 9: Integrate Gauss Algorithm . . . 47
2.2.11 Step 10: Implement the Execute Routine . . . 50
2.2.12 Step 11: Check running Module . . . 55
2.3 Final Remarks . . . 56
3 Design and Implementation 58 3.1 Documenting a Software Architecture . . . 58
3.2 JStatCom System Overview . . . 59
3.3 How Stakeholders Can Use the Documentation . . . 60
3.3.1 Typical Development Steps . . . 61
3.4 Background, Rationale, and Design Constraints . . . 63
3.4.1 Operational Context . . . 63
3.4.2 Key Data Management Features . . . 64
3.4.3 Key User Interface Features . . . 64
3.4.4 Key Interoperability Features . . . 65
3.4.5 Key Design Features . . . 66
3.5 JStatCom Architecture View Template . . . 69
3.6 View Packet 1: JStatCom . . . 70
3.6.1 Primary Presentation . . . 70
3.6.2 Element Catalog . . . 72
3.6.3 Context . . . 74
3.6.4 Architecture Background . . . 76
3.6.5 Related View Packets . . . 76
3.7 View Packet 2: Data Model . . . 76
3.7.1 Primary Presentation . . . 76
3.7.2 Element Catalog . . . 77
3.7.3 Context . . . 78
3.7.4 Architecture Background . . . 79
3.7.5 Related View Packets . . . 79
3.8 View Packet 3: Type System . . . 79
3.8.1 Primary Presentation . . . 79
3.8.2 Element Catalog . . . 82
3.8.3 Architecture Background . . . 83
3.8.4 Usage Example . . . 85
3.8.5 Related View Packets . . . 86
3.9 View Packet 4: Data Event System . . . 86
3.9.1 Primary Presentation . . . 86
3.9.2 Element Catalog . . . 87
3.9.3 Architecture Background . . . 88
3.9.4 Usage Example . . . 89
3.9.5 Related View Packets . . . 91
3.10 View Packet 5: Symbol Management . . . 91
3.10.1 Primary Presentation . . . 91
3.10.2 Element Catalog . . . 94
3.10.3 Architecture Background . . . 95
3.10.4 Usage Example . . . 96
3.10.5 Related View Packets . . . 100
3.11 View Packet 6: Symbol Event System . . . 101
3.11.1 Primary Presentation . . . 101
3.11.2 Element Catalog . . . 102
3.11.3 Architecture Background . . . 103
3.11.4 Usage Example . . . 104
3.11.5 Related View Packets . . . 106
3.12 View Packet 7: Symbol Control . . . 106
3.12.1 Primary Presentation . . . 106
3.12.2 Element Catalog . . . 110
3.12.3 Architecture Background . . . 111
3.12.4 Usage Example . . . 111
3.12.5 Related View Packets . . . 112
3.13 View Packet 8: Engine . . . 113
3.13.1 Primary Presentation . . . 113
3.13.2 Element Catalog . . . 119
3.13.3 Context . . . 121
3.13.4 Architecture Background . . . 122
3.13.5 Usage Example . . . 125
3.13.6 Related View Packets . . . 125
3.14 View Packet 9: Gauss . . . 126
3.14.1 Primary Presentation . . . 126
3.14.2 Element Catalog . . . 131
3.14.3 Architecture Background . . . 132
3.14.4 Usage Example . . . 133
3.14.5 Related View Packets . . . 135
3.15 View Packet 10: GRTE . . . 135
3.15.1 Primary Presentation . . . 135
3.15.2 Element Catalog . . . 140
3.15.3 Architecture Background . . . 140
3.15.4 Usage Example . . . 143
3.15.5 Related View Packets . . . 143
3.16 View Packet 11: Ox . . . 143
3.16.1 Primary Presentation . . . 143
3.16.2 Element Catalog . . . 145
3.16.3 Architecture Background . . . 146
3.16.4 Usage Example . . . 149
3.16.5 Related View Packets . . . 150
3.17 View Packet 12: Stub . . . 151
3.17.1 Primary Presentation . . . 151
3.17.2 Element Catalog . . . 154
3.17.3 Architecture Background . . . 155
3.17.4 Usage Example . . . 156
3.17.5 Related View Packets . . . 157
3.18 View Packet 13: MatLab . . . 158
3.18.1 Primary Presentation . . . 158
3.18.2 Element Catalog . . . 160
3.18.3 Architecture Background . . . 160
3.18.4 Usage Example . . . 161
3.18.5 Related View Packets . . . 162
3.19 View Packet 14: PCall . . . 162
3.19.1 Primary Presentation . . . 162
3.19.2 Element Catalog . . . 164
3.19.3 Architecture Background . . . 165
3.19.4 Usage Example . . . 167
3.19.5 Related View Packets . . . 169
3.20 View Packet 15: Time Series . . . 170
3.20.1 Primary Presentation . . . 170
3.20.2 Element Catalog . . . 171
3.20.3 Context . . . 173
3.20.4 Architecture Background . . . 173
3.20.5 Usage Example . . . 176
3.20.6 Related View Packets . . . 177
3.21 View Packet 16: List . . . 177
3.21.1 Primary Presentation . . . 177
3.21.2 Element Catalog . . . 180
3.21.3 Architecture Background . . . 182
3.21.4 Usage Example . . . 183
3.21.5 Related View Packets . . . 184
3.22 View Packet 17: Table . . . 184
3.22.1 Primary Presentation . . . 184
3.22.2 Element Catalog . . . 186
3.22.3 Architecture Background . . . 186
3.22.4 Related View Packets . . . 187
3.23 View Packet 18: Selection . . . 187
3.23.1 Primary Presentation . . . 187
3.23.2 Element Catalog . . . 190
3.23.3 Architecture Background . . . 190
3.23.4 Usage Example . . . 191
3.23.5 Related View Packets . . . 192
3.24 View Packet 19: Calculator . . . 192
3.24.1 Primary Presentation . . . 192
3.24.2 Element Catalog . . . 194
3.24.3 Architecture Background . . . 195
3.24.4 Usage Example . . . 195
3.24.5 Related View Packets . . . 196
3.25 View Packet 20: Components . . . 196
3.25.1 Primary Presentation . . . 196
3.25.2 Element Catalog . . . 197
3.25.3 Context . . . 200
3.25.4 Architecture Background . . . 200
3.25.5 Usage Example . . . 201
3.25.6 Related View Packets . . . 204
3.26 View Packet 21: Application . . . 204
3.26.1 Primary Presentation . . . 204
3.26.2 Element Catalog . . . 208
3.26.3 Architecture Background . . . 209
3.26.4 Usage Example . . . 213
3.26.5 Related View Packets . . . 215
3.27 View Packet 22: Data Table . . . 215
3.27.1 Primary Presentation . . . 215
3.27.2 Element Catalog . . . 219
3.27.3 Architecture Background . . . 220
3.27.4 Usage Example . . . 221
3.27.5 Related View Packets . . . 223
3.28 View Packet 23: Equation . . . 223
3.28.1 Primary Presentation . . . 223
3.28.2 Element Catalog . . . 225
3.28.3 Architecture Background . . . 226
3.28.4 Usage Example . . . 227
3.28.5 Related View Packets . . . 229
3.29 View Packet 24: Input/Output . . . 230
3.29.1 Primary Presentation . . . 230
3.29.2 Element Catalog . . . 232
3.29.3 Architecture Background . . . 233
3.29.4 Related View Packets . . . 234
3.30 View Packet 25: Data Import System . . . 235
3.30.1 Primary Presentation . . . 235
3.30.2 Element Catalog . . . 238
3.30.3 Architecture Background . . . 239
3.30.4 Usage Example . . . 240
3.30.5 Related View Packets . . . 241
3.31 Concluding Remarks about JStatCom . . . 241
4 JMulTi - A Reference Application of the Framework 245 4.1 Introduction . . . 245
4.2 General Setup . . . 246
4.3 Modules of JMulTi . . . 248
4.4 How to read this Chapter . . . 250
4.5 Initial Analysis . . . 250
4.5.1 Overview . . . 250
4.5.2 Implemented Features . . . 252
4.5.3 Implementation Details . . . 256
4.6 VAR Analysis . . . 261
4.6.1 Overview . . . 261
4.6.2 Implemented Features . . . 265
4.6.3 Implementation Details . . . 272
4.7 VEC Analysis . . . 286
4.7.1 Overview . . . 286
4.7.2 Implemented Features . . . 290
4.7.3 Implementation Details . . . 295
4.8 ARCH Analysis . . . 299
4.8.1 Overview . . . 299
4.8.2 Implemented Features . . . 301
4.8.3 Implementation Details . . . 304
4.9 STR Analysis . . . 305
4.9.1 Overview . . . 305
4.9.2 The Modelling Cycle . . . 306
4.9.3 Implemented Features . . . 307
4.9.4 Implementation Details . . . 315
4.10 Nonparametric Analysis . . . 316
4.10.1 Overview . . . 316
4.10.2 Implemented Features . . . 319
4.10.3 Implementation Details . . . 324
4.11 Outlook . . . 328
4.12 Conclusion . . . 329
A Guide to Notation 331 A.1 Class Diagrams . . . 332
A.1.1 Elements and Inheritance . . . 332
A.1.2 Components . . . 334
A.1.3 Relations between Elements of Class Diagrams . . . 335
A.2 Object Diagrams . . . 337
A.3 Use Case Diagrams . . . 337
B Documenting Modules with JavaHelp and JHelpDev 339 B.1 LaTeX and latex2html . . . 340
B.2 JHelpDev . . . 341
B.3 Integrating Helpsets with an Application . . . 343
Bibliography 353
Selbst¨andigkeitserkl¨arung 354
1.1 A screenshot of a simple example module for Markov-Switching
models . . . 4
1.2 Class diagram for an interactive Ox program . . . 21
2.1 Selecting a new Java project in the Eclipse IDE . . . 30
2.2 Setting project name and directory . . . 31
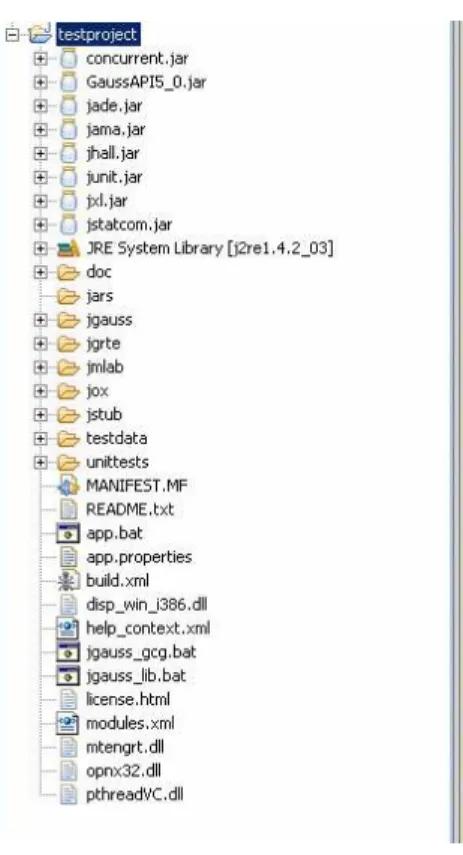
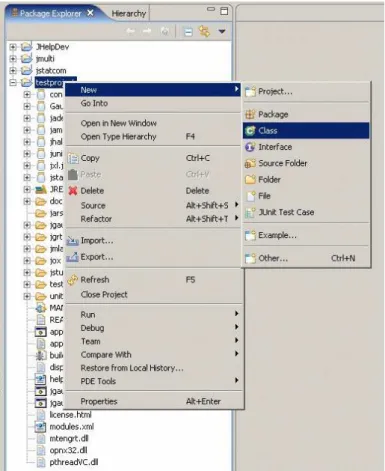
2.3 Display of the new projecttestprojectin the package explorer 32 2.4 Creating a new class . . . 33
2.5 Creating a new package . . . 34
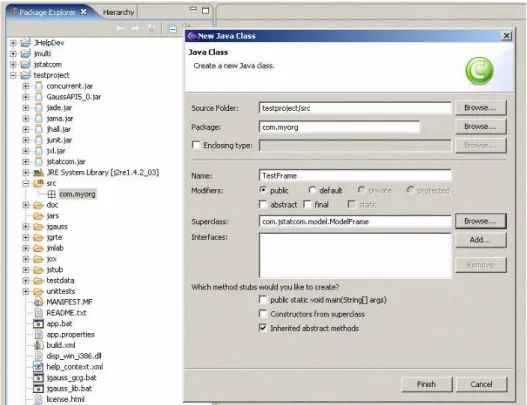
2.6 Specifying the new class . . . 34
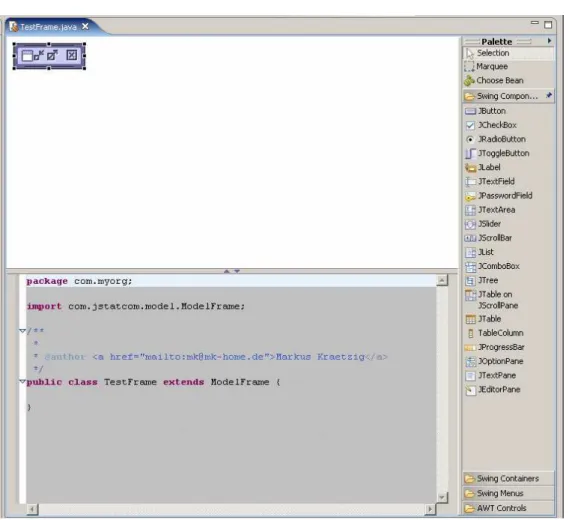
2.7 Generated Java code for a new class . . . 35
2.8 Open class in visual builder tool . . . 36
2.9 Initial display, frame needs to be resized . . . 37
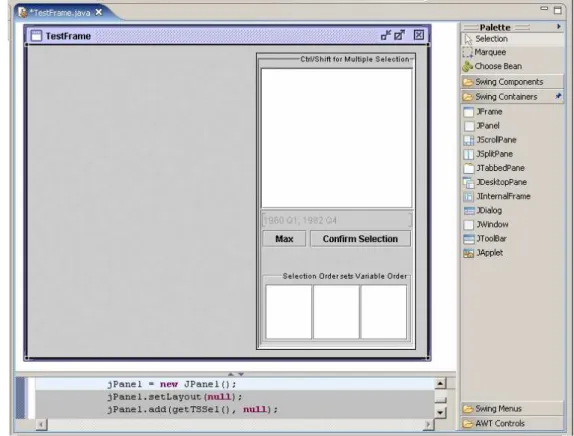
2.10 TestFrameafter resize with title, properties at the bottom . . . . 38
2.11 TestFrameafter aJPanelhas been added . . . 39
2.12 Setting layout manager tonull, easier to handle for initial design 40 2.13 Selecting theTSSelcomponent . . . 41
2.14 TSSelcomponent has been placed on the panel . . . 42
2.15 Editing properties ofTSSelcomponent . . . 43
2.16 Selecting theNumSelectorcomponent for number input . . . 44
2.17 Setting a validating range [1,20] to theNumSelectorcomponent 44 2.18 Placing aJButtonand creating an action . . . 45
2.19 Default action handler for execute button . . . 46
2.20 Editingmodules.xmlto insertTestFrameto list of modules . . . 47
2.21 Adjusting the classpath in theapp.batscript . . . 48 xii
2.22 Running application with newTestFramemodule, execute method
still needs to be coded . . . 49
2.23 OpenTestFramein Java editor, more convenient for manual cod- ing than visual editor . . . 51
2.24 Hidden method body that should be expanded by clicking on ar- row to the left . . . 52
2.25 Red underline and symbol to the left indicating some compilation problem . . . 52
2.26 A left mouse click on the error symbol gives a menu with possible error fixes, the first option should be chosen here . . . 53
2.27 Implementation of the execute call . . . 54
2.28 Running module with output from computation . . . 55
2.29 Symbol Control after the computation has finished . . . 56
3.1 Use cases for JStatCom . . . 75
3.2 Context of the Data Model . . . 78
3.3 Type System . . . 80
3.4 Classes in Data Event System . . . 86
3.5 Symbol Management . . . 92
3.6 SymbolScope inheritance . . . 93
3.7 Class structure of a hypothetical VAR frame . . . 97
3.8 Snapshot of model objects and shared data with different scopes . 98 3.9 Classes in Symbol Event System . . . 101
3.10 Tree related classes in Symbol Control . . . 107
3.11 Snapshot of objects in symbol tree . . . 108
3.12 GUI related classes in Symbol Control . . . 109
3.13 Screenshot of symbol frame with selectedNARRAY . . . 112
3.14 Screenshot of symbol frame with selectedDRANGE . . . 113
3.15 Engine classes . . . 114
3.16 Engine inheritance . . . 115
3.17 ConfigDialogwith aDefaultConfigPanel . . . 116
3.18 Engine client using abstractEngineand EngineTypes, but spe- cificLoadTypes. . . 118
3.19 Context of the Engine system . . . 122
3.20 Classes of the Gauss subsystem . . . 126
3.21 Gauss communication libraries . . . 127
3.22 Classes of the GRTE subsystem . . . 135
3.23 Classes of the Ox subsystem . . . 143
3.24 Classes of the Stub subsystem . . . 151
3.25 Classes of the MatLab subsystem . . . 158
3.26 Classes of the PCall subsystem . . . 163
3.27 Classes of the Time Series subsystem . . . 171
3.28 Context of the Time Series subsystem . . . 174
3.29 Classes of the List subsystem . . . 178
3.30 Screenshot of aTSListcomponent withTSListPopupshowing . 179 3.31 Classes of the Table subsystem . . . 184
3.32 Screenshot of aTSTablecomponent . . . 185
3.33 Screenshot of aTSSelcomponent . . . 187
3.34 Screenshot of Time Series Calculator . . . 192
3.35 Classes for input validating text fields . . . 197
3.36 Screenshot ofNumSelectorwith an error message . . . 201
3.37 Use cases for the Components system . . . 202
3.38 Specification of aNumSelectorin a visual application builder . . 203
3.39 Classes of Application system . . . 205
3.40 Screenshot ofTopFramecustomized for the JMulTi application . 206 3.41 Classes of Data Table system . . . 215
3.42 Screenshot of aNArrayTable . . . 216
3.43 Screenshot of NArrayTable with a special table renderer and mouse click listener . . . 216
3.44 Screenshot of aSArrayTable . . . 217
3.45 Classes of Equation system . . . 223
3.46 Screenshot of VEC model coefficients estimates . . . 224
3.47 Screenshot of VEC model exclusion restrictions on shortrun dy- namics . . . 224
3.48 Classes of Input/Output system . . . 230
3.49 Error message presented to the user . . . 230
3.50 Screenshot ofLogFramewith a detailed error message . . . 231
3.51 Classes of Data Import system . . . 235
3.52 Screenshot of ImportDataFramewith a TSImportPanel . . . 236
3.53 Screenshot of TSASCIIDialog . . . 237
4.1 Screenshot of workbench with autocorrelation panel . . . 251
4.2 Screenshot of ADF unit root test panel . . . 252
4.3 Screenshot of Johansen cointegration test panel . . . 253
4.4 Screenshot of Symbol Control for Initial Analysis . . . 258
4.5 Classes for Initial Analysis . . . 259
4.6 Screenshot of specification panel for the VAR analysis . . . 261
4.7 Screenshot of estimation panel for the VAR analysis . . . 262
4.8 Screenshot of manual/automatic subset specification for the VAR analysis . . . 263
4.9 Screenshot of SVAR model estimation . . . 263
4.10 Screenshot of Symbol Control system for VAR model . . . 264
4.11 Screenshot of panel for plotting recursive coefficients estimates . . 267
4.12 Screenshot of panel for computing bootstrapped Chow tests . . . . 268
4.13 Screenshot of forecast panel for VAR analysis . . . 269
4.14 Screenshot of bootstrap specification panel for VAR Impulse Re- sponse Analysis . . . 270
4.15 Screenshot of VAR Impulse Response Analysis panel . . . 270
4.16 Screenshot of VEC model selection . . . 286
4.17 Screenshot of VEC estimation output in matrix form . . . 287
4.18 Screenshot of specifying restrictions on short-run dynamics for a VEC model . . . 288
4.19 Screenshot of specifying restrictions on the cointegration relation of a VEC model . . . 289
4.20 Screenshot of the dialog for specifying the estimation of the 1st stage of a two stage VEC estimation procedure . . . 290
4.21 Screenshot of panel for plotting recursive coefficients estimates . . 291
4.22 Screenshot of causality tests panel . . . 293
4.23 Screenshot of specification panel for SVEC estimation . . . 294
4.24 Screenshot of a user message about long-run restrictions not being taken into account with the currently selected estimation procedure 296 4.25 Screenshot of ARCH analysis module . . . 300
4.26 Screenshot of output for univariate GARCH(1,1) estimation . . . 301
4.27 Screenshot of residual analysis for ARCH analysis . . . 302
4.28 Screenshot of output for multivariate GARCH(1,1) estimation . . 303
4.29 Screenshot of model selection for STR analysis . . . 305
4.30 Screenshot of selecting subset restrictions for AR parts of STR model . . . 307
4.31 Screenshot of test for nonlinearity . . . 308
4.32 Screenshot of grid search to find starting values . . . 310
4.33 Screenshot of panel for STR estimation . . . 311
4.34 Screenshot of dialog to set restrictions for STR estimation . . . . 312
4.35 Screenshot of graphical analysis panel . . . 312
4.36 Screenshot of residual analysis panel . . . 314
4.37 Screenshot of model selection for the nonparametric analysis . . . 317
4.38 Screenshot of model estimation for the nonparametric analysis . . 319
4.39 Screenshot of forecasts for the nonparametric analysis . . . 320
4.40 Screenshot of surface plot for conditional mean . . . 321
4.41 Screenshot of conditional mean together with Bonferroni CIs . . . 322
4.42 Screenshot of text output after lag selection finished . . . 328
A.1 Classes and inheritance . . . 332
A.2 Components . . . 334
A.3 Relations among classes . . . 335
A.4 Object diagram . . . 337
A.5 Use case diagram . . . 338
B.1 Screenshot of a TOC editor component . . . 342
B.2 Screenshot of a help viewer . . . 343
3.1 Typical development steps . . . 63
3.2 Primary Presentation of JStatCom . . . 71
3.3 Resources for MatLab engine, Windows . . . 72
3.4 Elements of JStatCom . . . 74
3.5 Primary Presentation of Data Model . . . 77
3.6 Elements of the Data Model . . . 78
3.7 Elements of the Type System . . . 83
3.8 Elements of the Data Event System . . . 88
3.9 Elements of the Symbol Management . . . 95
3.10 Elements of the Symbol Event System . . . 102
3.11 Elements of the Symbol Control . . . 110
3.12 Primary Presentation of Engine system . . . 113
3.13 Elements of Engine system . . . 121
3.14 Resources for Gauss engine . . . 130
3.15 Elements of Gauss system . . . 131
3.16 Resources for GRTE engine, Windows . . . 138
3.17 Resources for GRTE engine, Linux/Solaris . . . 140
3.18 Elements of GRTE system . . . 140
3.19 Resources for Ox engine, all operating systems . . . 145
3.20 Elements of Ox system . . . 145
3.21 Type conversion between JStatCom and Ox . . . 148
3.22 Type conversion between C-types and Stub engine, all properties that are not mentioned must not be set or set tofalse . . . 153
3.23 Resources for Stub engine, Windows and Linux/Solaris . . . 154
3.24 Elements of Stub system . . . 155 xvii
3.25 Resources for MatLab engine . . . 159
3.26 Elements of MatLab system . . . 160
3.27 Elements of PCall system . . . 164
3.28 Subsystems of Time Series . . . 170
3.29 Elements of Time Series system . . . 173
3.30 Elements of List system . . . 182
3.31 Elements of Table system . . . 186
3.32 Elements of Selection system . . . 190
3.33 Elements of Calculator system . . . 194
3.34 Primary Presentation of Components . . . 196
3.35 Elements of Components system . . . 200
3.36 Resources for the Application system . . . 207
3.37 Elements of Application system . . . 208
3.38 Elements of Data Table system . . . 220
3.39 Elements of Equation system . . . 226
3.40 Elements of Input/Output system . . . 233
3.41 Elements of Data Import system . . . 239
4.1 Modules of JMulTi . . . 249
4.2 Shared components . . . 299
AC Autocorrelation
ARCH Autoregressive Conditional Heteroskedasticity API Application Programming Interface
CI Confidence Interval DLL Dynamic Link Library EC Error Correction
GLS Generalized Least Squares GUI Graphical User Interface HTML Hypertext Markup Language
IDE Integrated Development Environment JNI Java Native Interface
JRE Java Runtime Environment LGPL Lesser General Public License LM Lagrange Multiplier
ML Maximum Likelihood
OS Operating System
PAC Partial Autocorrelation PDF Portable Document Format STR Smooth Transition Regression SVAR Structural Vector Autoregression UML Unified Modelling Language
UR Unit Root
URL Uniform Resource Locator VAR Vector Autoregression
VE Visual Editor
xix
VEC Vector Error Correction
VB Visual Basic
XML Extendable Markup Language
XP Extreme Programming
The early stages of this work were carried out in the PhD program of “Applied Microeconomics” of the Humboldt-Universit¨at zu Berlin and completed at the the Sonderforschungsbereich 373 (SFB 373) as well as in the Chair of Econometrics.
I am thankful for financial support granted by the German Research Foundation (DFG), as well as for the excellent work conditions provided by the School of Business and Economics of the Humboldt-Universit¨at zu Berlin.
I would like to point out that this work would not have been possible without the continued support of my supervisor, Prof. Dr. Helmut L¨utkepohl, who always provided valuable feedback and comments which contributed greatly to the final outcome. He was the first user of the developed software and thus assisted with its birth and its introduction to a wider audience. In addition, Prof. Bettina Berendt assisted me to improve the thesis by providing the perspectives of a computer scientist, not an econometrician. I thank her for her time and consideration.
Many econometricians have contributed their code to this system and I would like to thank, in random order, Prof. Rolf Tschernig, Dr. Ralf Br¨uggemann, Dr.
Carsten Trenkler, Prof. Helmut Herwartz, Dmitri Boreiko, Christian Kascha, Ste- fan Lundbergh (Ph.D.), and Markku Lanne (Ph.D.) for their support and the fruit- ful collaboration. Among the participants of a particularly instructive workshop held in March 2003 in Florence were Dr. Kirstin Hubrich, Prof. J¨org Breitung, Maria Eleftheriou, Aaron Mehrotra, and Sebastian Watzka. I would also like to thank them for giving a profound feedback to the author.
This thesis is based on previous work by Dr. Alexander Benkwitz, who initi- ated this project and created the first prototypes. I greatly enjoyed working with him and due to the open exchange of results and knowledge I was able to continue the project after his departure from the SFB 373.
xxi
I would also like to thank Prof. Timo Ter¨asvirta for his comments upon the re- search after he kindly invited me for a stay at the Stockholm School of Economics.
Last, but certainly not least, I greatly appreciated the 8-months of hospitality at the European University Institute in Florence where I was able to conduct my work in an inspiring atmosphere surrounded by the beautiful Tuscan hills.
From Algorithms towards an integrated Framework
Let your workings remain a mystery.
Just show people the results.
(Lao-Tse)
1.1 Problem Description
Modern econometrics relies heavily on the use of computer software to analyse empirical data, as well as to run simulations to investigate the properties of tests and estimators. Complex mathematical algorithms need to be applied to data that is either randomly sampled or that has been observed as the realization of some stochastic process and that is stored in a file or in some database. Researchers who want to perform a certain type of analysis with up-to-date methods basically have two options. By employing standard software packages for econometric analysis, like Eviews or Oxmetrics, they could use a wide range of methods very effectively.
The other option would be to take some programming language for statistics, for example Gauss, Ox, Octave, Matlab, or R, and to write or reuse programs that can do the analysis.
The pros and cons of both approaches are quite obvious. If a standard software is used, there is typically well developed graphical user interface (GUI) support,
1
and the implemented methods are ready to use. However, if some method is miss- ing that is not provided by the respective vendor, extra programming is needed.
Although most standard packages also provide a programming interface, it is then usually more effective to apply one of the well established languages for statistics, because often there is already code available which can be reused. Thus standard software lacks flexibility and the possibility to program extensions easily.
By using a programming language for statistics, one has a lot more flexibility to program algorithms. But this approach requires familiarity with the respective language and the resulting programs are usually script-based. This means that it is less convenient and more troublesome to use these algorithms compared to a software with a GUI for interactive modelling. Often even the programmer her- self has problems getting a script running that she has not touched for a while.
Furthermore, model building in econometrics is typically a multi-step procedure with a number of different algorithms involved. With a script-based approach combining these procedures can become quite a complex undertaking. It always requires text editing of sometimes lengthy source code. Furthermore, documenta- tion is often quite sloppy, which requires to investigate the algorithms themselves to know exactly how parameters need to be prepared and what the contents of the results are. Another problem is that the authors of these algorithms usually see themselves rather asScientistsinstead ofProgrammersand they often do not re- flect very much about software engineering techniques. The result is that software reuse is often limited to reusing single procedures written in some script language for statistics. More complex interactions or object-oriented design is only applied by experienced developers and can still not be considered a mainstream technique in that area.
One of the central contributions of the proposed software architecture JStat- Com is that it can be used to increase software reuse, because it provides config- urable standard components for recurring tasks as well as mechanisms to use code that has been written already in special languages for statistics.1 By applying that approach one can develop reliable, feature-rich applications with relatively little effort. More generally, this was one of the major goals of object-oriented pro- gramming, but it needs domain specific application frameworks to bring this idea
1The URL for the framework JStatCom iswww.jstatcom.com.
to live. JStatCom is such a framework for data based analysis, especially time series econometrics.
To summarize, the big disadvantage of using special purpose languages to program algorithms for statistics and econometrics is that it often requires special knowledge to reuse them. It is not a solution that can be applied by empirical researchers easily because it often involves time consuming programming or at least adjustments in the source code. This leads to a situation where methods are not being used because they are not part of a standard software and programming is not an option due to resource or knowledge constraints. However, these methods may have been programmed and might already be part of some software library. It would therefore be good to improve the usability of these algorithms by providing a relatively simple way to create user-friendly interfaces for them.
1.2 JStatCom and JMulTi
The aim of this work is to present an approach to creating software for that purpose which is based on the first version of the application framework JStatCom. This software was developed by the author and is based on previous work by Benkwitz (2002), who implemented an early version of JStatCom which was capable to communicate with the Gauss software only. He set up the concept of having a separate Java interface together with a communications interface to an external execution engine, a term borrowed from the MMM project (G¨unther et al. (1997)).
In its current version the framework has been generalized to provide the ca- pabilities to work with a number of computational engines with very different features. It is argued that by now any relevant engine can be used if a communi- cations interface for external procedure calls is provided by the vendor or by other parties. The system has been further generalized to represent new data types, like dates and sample ranges. Many build-in variation points allow to adjust the frame- work to different modelling situations. For this, a new abstract engine system, as well as a different internal data management had to be implemented for JStatCom, which also affected many components for GUI design. Therefore the whole sys- tem was rewritten to cope with the more general requirements. Furthermore, all classes and methods have been thoroughly documented and a complete API spec-
Figure 1.1: A screenshot of a simple example module for Markov-Switching mod- els
ification has been generated which can be used by developers. It should also be mentioned that regression testing has been applied for all features of JStatCom that can automatically be checked via assertions.
On top of it the software JMulTi was developed which is an application that is based on JStatCom.2 It is also described already in Benkwitz (2002), but since then many new features have been added. Of course it had to be adjusted in many ways because the underlying framework has been changed. Chapter 4 describes the current state of JMulTi. The author has developed the modulesInitial Analysis, STR,ARCH, andNonparametric Analysis. But due to the change in the underlying
2The URL for the application JMulTi iswww.jmulti.de.
structure, also theVARandVECmodules have been almost completely rewritten.
Furthermore, various new features have been added to these modules compared to the version in 2002. A help system was also integrated which is based on the JavaHelp system. It has been generated with the tool JHelpDev which has been developed by the author, see Appendix B. In general the software JMulTi is now much more user-friendly, has many more econometric features, and is more reliable. It is slowly getting accepted by the econometric community. The web- statistics for the release 3.11 08/24/04 state that the software has been downloaded about 1800 times in less than 4 months. On average the homepage of JMulTi is visited by about 40 different users every day. It is reportedly being used for teaching as well as for empirical research.
Because major parts of this thesis present the software framework JStatCom, it mainly addresses developers who intend to program graphical user interfaces for mathematical algorithms. The work investigates the requirements for such a soft- ware and describes solutions to the typical problems that appear in that context. It tries to adopt to the situation where Scientistsdevelop algorithms from their do- main specific knowledge and work closely together withProgrammerswho apply the framework to program GUIs for those procedures. Both roles can also be filled by a single person. The latter scenario is not uncommon, examples are Harald Uh- lig’sToolkit(Uhlig (1999)) or James Davidson’sTime Series Modellingsoftware.3 However, JStatCom makes it possible that scientists develop their algorithms in a way they are familiar with, and a Java programmer can focus on designing a GUI for them. This way the development process can become more efficient because all participants may use their specific expertise. It is not required that a scientist needs to program in Java and learn about application development. On the other hand the programmer does not need to have a deep domain specific knowledge to implement the GUI with JStatCom.
Figure 1.1 shows a screenshot of a relatively simple module that has been programmed with this software.4 Without describing any details in this place,
3The URL of the software ishttp://www.timeseriesmodelling.com.
4The module estimates a Markov-Switching AR model with a variable mean and two regimes.
The transition probabilities are assumed to be constant, as well as the variances and the autore- gressive parameters. It is possible to reproduce the results presented in Hamilton (1989) with this code. The GUI for this provides an interface to load the data, set the sample, specify the number
one can see that there are GUI components for specifying the input for some algorithm. The output of the underlying computation is presented in a text area.
It will be shown how modules of similar type can be created in a straightforward way in Java with the help of JStatCom. Domain specific algorithms might be reused even if they are written in another language. The language that has been used in the example for the screenshot was Ox.
Although there already exist a number of solutions to this task, the strength of the presented approach lies in its flexibility and the high level of code reuse that can be achieved. It also promotes an object-oriented design that allows to cre- ate scalable applications that do not tend to become much more complicated and error-prone as more features are added, and thus reducing the entropy problems (Bianchi et al. (2001)).
A very general description of the problems that occur when developing soft- ware for scientific computing is given by Morven Gentleman in Boisvert and Tang (2001, preface). The author mentions that often complex software systems are created by scientists rather than software engineers. This can lead to the common situation that best practices in software engineering are ignored or not recognized, and that projects can suffer from this deficiency. The lifetime of scientific appli- cations is often measured in decades, although the code is under constant change.
Therefore it might well pay offto introduce some modern programming concepts, like for example unit and regression testing, into scientific software development.
An observation that can be made in areas that heavily depend on the use of complex mathematical algorithms is that large and powerful libraries for math, statistics and graphics are created in different programming languages, but that there is a lack of an integrating framework that seeks to make those procedures accessible in a user-friendly way. So far there are only isolated solutions for cer- tain problems, as for example described in Ashworth et al. (2003), but no attempt has been made to standardize the creation of GUI’s for mathematical applications in a more general context. One exception is the web based approach MMM which was developed as an architecture to share algorithms and computing resources via the internet. User interaction was done via a browser interface.
of AR lags and estimate the model.
However, this solution was still not convenient enough for users and was there- fore not widely used for empirical analysis. The presented software framework JS- tatCom tries to fill this gap by defining classes that are especially designed to link between existing math libraries and a graphical user interface. It is not focussed on new algorithms for math and statistics, but concentrates on convenient user in- terface components, an efficient variable bookkeeping system and on a powerful and extendable data model. The main target of the software is the desktop com- puter, instead of a distributed computing environment, although it is conceptually not limited to a local environment. A special feature of JStatCom is that existing code from popular matrix oriented languages can easily be reused without even changing it. The software makes every attempt to be both, developer- and user- friendly. This is mainly achieved by providing standardized ways to develop and test applications based on it. JStatCom suggests a certain class design that can be applied to many different modelling situations. This way the developer can always apply a very similar class structure, although the underlying models might be quite different. How this can work in practise is described in Chapter 4.
It has to be mentioned that a framework can never be developed successfully without using it in a real world application, see for example Venners (2002).
Hence, JStatCom contains all general solutions that have been found when de- veloping JMulTi, the first application that is based on it.
1.3 Access to Algorithms
This section describes which options exist to use JStatCom together with an ex- ternal execution engine, a Java library, or anativelibrary to get access to already implemented algorithms for a given problem.5
1.3.1 Using an Execution Engine
The framework in its current state does not depend on a special engine anymore, like for example GAUSS, but can communicate with a number of different pro- grams. In principle it is now possible to integrate any kind of execution engine
5The termnativeis used to describe operating system dependent binary resources.
that has a programming interface for calling procedures provided by that engine.
Such interfaces exist for many packages used for scientific and engineering pro- gramming, such as
• GAUSS (Vinod (2000))
• MatLab (Cribari-Neto and Jensen (1997))
• Ox (Cribari-Neto and Zarkos (2003)), free for academic use
• Mathematica (Rose and Smith (2002))
• R (Cribari-Neto and Zarkos (1999)), GNU open-source project
• Maple (Hutton (1995))
• Xplore (H¨ardle et al. (1995))
• Octave (Eddelbuettel (2000)), GNU open-source project
The references link to articles describing how the respective product is used for statistics and econometrics. Most packages are published under a commercial license, but there is also a number of high quality open-source tools available, of which especially the R project is becoming increasingly popular.6
The use of an external engine has the advantage that most problems related to numerical accuracy, performance and the availability of efficient algorithms and libraries of high level functions can be delegated to an already existing and well established package. In addition to that, users of that package are already familiar with the respective scripting language and can use it efficiently to implement their algorithms. JStatCom does not make the attempt to compete with any of those products, but aims at enhancing their value by providing support for the creation of very flexible GUI’s. This way it can be used to create stand-alone applications that could even incorporate code from different packages, say, GAUSS, MatLab, and Ox, just to name some of the most popular software tools used in econometrics.
The disadvantage of using a separate program for the numerical computations is that the portability of the resulting application is reduced, compared to that of a
6The URL of the R project iswww.r-project.org.
100% pure Java program. This is because the communication between the Java side and the external engine can only be done efficiently by using operating system specific functions, also called native methods, thus limiting one of the greatest advantages of the Java language. However, this limitation can in principle be overcome by providing communications schemes for different operating systems, if the respective engine allows this.
1.3.2 Using Libraries and Toolkits
Apart from an external execution engine, there is also an increasing amount of programming libraries and tool sets that can be used for various numerical calcu- lations. As the Java programming language is gradually gaining acceptance also for high performance numerical computing, see for example Boisvert et al. (2001) for a discussion and Bull et al. (2001) for benchmark comparisons, there are by now various Java packages available that can be used for statistics and economet- rics. Problems that still remain when developing numerical libraries for Java are summarized and evaluated in Boisvert et al. (1998), most of them are still valid today. Nevertheless, the authors give an optimistic outlook that a combination of new language features and optimized compiler performance will provide fur- ther improvements. Among the needed enhancements are support for complex numbers with the same performance as for primitive types (Wu et al. (1999)) and a multidimensional array package (Moreira et al. (2001)). These issues are addressed by the Java Grande forum and have led to a number of proposals for changes in the language specification as well as new extensions for numeric li- braries.7 By now there already exist a number of libraries relevant for statistical computing that can readily be used.
Among the most comprehensive linear algebra packages for Java are:8
• COLT, a toolkit for high performance computing
7The URL of the Java Grande forum iswww.javagrande.org.
8The links to the homepages of the mentioned projects can be found at math.nist.gov/javanumerics.
• JAMA, a Java matrix toolkit that was proposed as a standard implementa- tion for a matrix package by NIST9and MathWorks10
• JLAPACK, translates LAPACK Fortran routines to Java (Anderson et al.
(1999), Doolin and Dongarra (1997))
• JADE, various additions to the default Java environment, including linear algebra classes
• Java Numerical Toolkit, preliminary proposal for a numerical library by the Java Numerics Working Group
• JMSL - numerical library for Java, a suite with a large collection of math and statistics functions under a commercial license.
For JStatCom these developments have been encouraging, because using calls to a Java numerical library would be the most natural way to incorporate complex math algorithms to a Java application. As opposed to using a native execution engine, this does not affect portability, meaning that applications could be run on all platforms for which a JRE exists. In addition, deployment would be much easier, because no extra resources from other languages must be shipped, like for example Ox compiled classes or GAUSSgcgfiles.
Apart from employing an external execution engine or a Java numerical li- brary, JStatCom also provides support for calling native libraries directly without the need to write a dedicated Java wrapper for each function via the JNI interface (Liang (1999)), see Section 3.17. This opens the door to use existing and well es- tablished libraries for numerical computing, originally written in C or FORTRAN for high performance calculations, like for example the numerical recipes toolkit (Press et al. (2002)). However, using this scheme again leads to the portability problem mentioned earlier, because of the necessary native calls. Apart from that, it introduces pointer manipulations to the Java implementation. Pointers are direct references to memory locations through which the contents of the virtual mem- ory of a running application can be accessed and modified without further checks.
9The National Institute of Standards and Technology,www.nist.gov.
10The URL is www.mathworks.com.
Pointer manipulations and pointer arithmetic (Deitel and Deitel (2002, chap. 5)) can offer great performance gains, but are often the cause of subtle programming errors. Although in JStatCom the mentioned pointer operations are almost com- pletely hidden behind a standard interface, it can make applications less stable and exposes them to the possibility of sudden crashes, if an error in one of the native calls happens. Therefore another advantage of the Java language, automatic array bounds checking and the absence of memory protection errors, is given up for the sake of greater flexibility if this type of method call is used.
How the algorithms for the actual computations are implemented is left to the developer. The decision will mostly be based on what resources are available to solve a concrete problem. In the case of JMulTi, there existed a large code base of GAUSS libraries for various econometric methods, which was the reason to develop the respective interface first. In the meantime, there where requests to implement methods written in other languages as well. This has led to the described generalizations in the communications scheme as well as in the data structure.
1.3.3 Including Graphics
So far the possibilities of implementing numerical calculations have been consid- ered. One very important aspect of data based analysis is the graphical representa- tion of data and results in a quality that allows it to be used for publications. There are again several options that are available for JStatCom which focus on reusing existing solutions. The creation of a new graphics engine would be beyond the scope of this project and is not considered as an option.
First, if an execution engine is used, then the respective language usually sup- ports the creation of graphics of various types. In general this functionality can be used in the same way as the numerical functions. However, as graphics calls often require extra packages, create temporary files, and can be configured in various ways, there are sometimes small deviations from the calling procedure without graphics. These differences depend on the respective engine and will be explained in the next chapter for each case. In JMulTi the graphics features of the GAUSS execution engine have been used.
A second option to create graphics from within JStatCom is to use a special graphics engine for that purpose. One possibility would be the program Gnu- plot.11 It can create various kinds of 2D and even 3D plots and is currently used by the Octave statistical program for displaying graphics. It is also mentioned in Cribari-Neto and Zarkos (2003) as a possible alternative to the Ox graphics engine. Gnuplot is open-source and runs on all major operating systems. There exist several programming interfaces to enable calls from other applications to Gnuplot. These features make it a reasonable candidate for a statistical graphics engine. Currently Gnuplot is not used directly by JStatCom, because it would require a specific communications interface that works with temporary files. But it can be employed by the Ox program to display graphics with the Ox package gnudraw.12 In this case the Ox communications interface as described in Section 3.16 could be used.
Like for numerical libraries, the best solution would be to have a 100% pure Java implementation of a graphics engine. This would keep portability intact and it would simplify deployment. One of the most promising solutions is jfreechart.13 It is again an open-source project that aims at the development of a feature-rich graphics engine for Java programs. Except 3D surface plots, it can create most kinds of graphs that are relevant for statistical analysis, also with the possibility to configure the display interactively. Out of these reasons, jfreechart would be another good option for displaying graphics from within JStatCom. This library is not integrated in the framework yet, but can of course be used in the Java code without special support by JStatCom. However, it would be helpful to provide adapter classes that simplify the creation of standard plots and that work well with the internal data management system of the framework. These possibilities will be further investigated in the future.
11The URL of the gnuplot project is www.gnuplot.info.
12Charles Bos has developed this package which is available from his homepage www.tinbergen.nl/˜cbos.
13The URL of the jfreechart project iswww.jfree.org.
1.3.4 Integrating available Tools
It was shown that for all special tasks related to data based analysis there already exist tools that can be reused. What is missing is a framework that can be used to combine the libraries and toolkits of choice efficiently. JStatCom tries to do just this. By having the possibility to use many different computational engines and/or numerical libraries, the framework is usable for a wide range of applications.
Another feature that is provided by JStatCom, is support for creating helpsets for user interface components. As a help system should give users an idea of how the underlying procedures operate, a high degree of formalization is often neces- sary for the help text, for example to describe the theory of estimating a Smooth Transition Regression Model (Ter¨asvirta (2004)). Current help authoring systems lack explicit support for math typing. It seemed logical to rely on the well estab- lished standard solution LaTeX that many researchers are already familiar with.
Together with latex2HTML, a software to convert TeX documents to the HTML format, and the developed tool JHelpDev it is now possible to reuse LaTeX doc- uments to create a state-of-the-art JavaHelp system (Sun Microsystems (2003)) efficiently, see Appendix B.14
As JStatCom and JMulTi have been developed to be used for econometric analysis, especially multiple time series analysis, JStatCom contains data types and user interface components that are useful in that context. However, the frame- work is not restricted to be used for time series analysis exclusively, but can be augmented and customized for various environments. A strong emphasis of this thesis is to show all directions in which JStatCom can be extended without chang- ing the current class structure and without breaking binary compatibility with pre- vious editions.
It was an important goal to make the framework accessible to users who do have some knowledge in programming, but little or no background in software engineering. This means that it should be easy to create simple applications. On the other hand, JStatCom should also support the creation of larger, more complex programs. It is hoped that the proposed set of solutions is simple yet flexible enough to meet these competing requirements.
14The URL for the help authoring tool JHelpDev isjhelpdev.sourceforge.net.
1.4 JStatCom in comparison to other Approaches
As empirical research in econometrics can only be done with specialized software packages, this project is not the first attempt to provide methods with an intuitive GUI. Other approaches to create applications for statistics and econometrics ex- ist. The following section describes some of these solutions and relates them to JStatCom.
1.4.1 MulTi
One of the earliest projects that adopted this approach was MulTi 1.0 (Haase et al.
(1992)). It already employed GAUSS as a computing engine but used special lan- guage features to implement a graphical user interface on top of it. The program had a rich set of features and even implemented VARMA modelling capabilities (L¨utkepohl (1991, chap. 6)) that are still unique among econometric packages.
With the introduction of GAUSS for Windows, the support for GUI commands ceased, and thus rendering further development of MulTi 1.0 impossible. How- ever, there were also limitations in the design of the software, letting the cost curve of additional changes and maintenance become very steep. Therefore the project, although very successful at that time, was cancelled.
1.4.2 Observations on Entropy and Software Reuse
An observation from the experiences with MulTi 1.0 and similar projects is that entropy limits the lifetime of such software by making it literally impossible to maintain and extend an existing system with a reasonable effort after it has grown beyond a certain size. If important project members leave the development process, this often means the end of lifetime. Benkwitz (2002) identified the rea- sons for this phenomenon in the context of econometric software by the lack of object-oriented engineering principles, and, in case of GUI based applications, the mangling of GUI and algorithm code. The latter is often the simplest and fastest way to create working prototypes, but it is only suitable for small projects with a limited number of features. He promotes a clear separation between the GUI and math code, as already argued in Liu et al. (1995). This is in line with well
established software engineering standards. An abstract model for that program- ming paradigm is the Model-View-Controller architectural pattern that promotes the separation of data, rendering of data and the translation of user interactions into model changes (Eckstein et al. (1998), Sun Microsystems (2002)).
There are a number of other problems that increase entropy of software pro- jects. One is the lack of documentation which makes it often hard for new project members to understand an existing system. Maybe even more severe is accumu- lated complexity and cross-references between various components of the system that are difficult to trace back. In a procedural programming context this means that there are large monolithic procedures, as well as many global variables that might be modified in different parts of the program. Making the step towards object-oriented programming does not necessarily mean that those problems will be eliminated. In fact, they may become even worse, because class structures can become extremely hard to understand. This may happen due to bad initial design and due to a lack of refactoring during the development process (Fowler (1999)).
Although an object-oriented approach is often conceptually better than using pro- cedural programming techniques, it usually requires a deeper understanding of how to design, implement and extend such a system properly. It uses a number of abstract concepts that many researchers are not familiar with. This leads to a com- mon dilemma with code written for scientific applications: there exist many good algorithm implementations, but there is a lack of structure and therefore limited reuse. One of the promises made by the object-oriented programming paradigm was that there would be an increase of software reuse. However, reusability of object-oriented systems is often limited, see for example Pree (1997). It is not a natural property of such a system, to quote Gamma et al. (1995):
Designing object-oriented software is hard, and designing reusable object-oriented software is even harder.
It takes a lot of experience to design a reusable object-oriented system. A reusable class can almost never be designed from scratch, but is the result of a stepwise refinement process. In that respect, a simple procedural programming approach often gives better results in terms of reusability, if only more or less isolated algorithms are considered. This is, how reuse works best in scientific
computing, because the conceptional overhead of understanding the relationships between many classes is usually greater, than just calling a procedure of a library that takes a number of parameters and returns a specified result. To summarize, designing reusable object-oriented systems is hard and too time consuming for many researchers. Designing reusable algorithms is much easier, because they are often closer to the real problem and do not require many software specific abstractions. But especially for creating applications with GUI components, a procedural approach leads to the mentioned entropy problems. However, GUI components can increase the usability of many procedures and are sometimes even necessary, because of the complexity of the underlying procedures.
The proposed solution is to split the development of algorithms and GUI code and to keep the two strictly separated. This way, algorithms do not necessarily have to be object-oriented, but the GUI system would be, thus being extendable and maintainable also for larger projects. The software providing the GUI would preferably be a framework which is defined as a set of reusable classes that make up a reusable design for a class of software (Johnson and Foote (1988), Deutsch (1989)). That means that it already provides a structure as well as key functionality for applications in a certain problem domain. The designer of an application can reuse not only classes, but the whole design of the framework and concentrate on specific aspects of his implementation.
In the following, other, more recent approaches than MulTi 1.0 will be de- scribed, focussing on how the different solutions achieve the goal of creating an extendable software system.
1.4.3 The MMM Project
Although the already mentioned MMM project has meanwhile been cancelled, it bore some similarities to JStatCom and is interesting to look at. It was intended as a general interface to various different execution engines that can run methods for statistical computations. These methods could be provided by statisticians, who use their favourite programming environment to create them, thus adopting to the habits of algorithm reuse. The goal was to provide a general interface that allows to combine a growing number of statistical procedures easily. All services
were provided via the World Wide Web in a distributed environment. The user could access these services via a browser interface. The use of Java to create more sophisticated user interfaces was considered as well. Therefore the goals of MMM were comparable to those of JStatCom, although a great focus was on platform independence and the availability of the service via the Internet. The reason was that MMM should eventually be used as a platform for component leasing on the Web (Riessen et al. (2000)). As compared to JStatCom, similar problems had to be solved:
• communication to different engines via a unique interface
• providing each engine with the necessary libraries and configuration infor- mation needed to run properly
• transforming data to a format understandable by the respective execution engine
• providing the capability to combine arbitrary methods
• saving intermediate results, maintaining the state of the analysis
• making it easy to check in new methods
The solution to all these problems is not trivial in a local environment, but is truly complex in a distributed environment where potentially many requests have to be dealt with at the same time. Security issues are a severe problem, because users can basically control the execution of methods on a server which is a potential danger, if security holes in an engine implementation can be exploited. Apart from the purely technical challenges, it seems at least questionable whether it is possible to achieve a satisfactory standard of the user interface. The reason was that the MMM approach introduced a great deal of flexibility, but at the same time it put the burden of how to combine different methods in a meaningful way on the user. Just providing a way to call different algorithms is certainly not enough, because there is a lack of methodology. Furthermore, it imposes restrictions on the interfaces of the statistical procedures that have to be combined. For exam- ple, some statistical test routine might take residuals as a matrix with dimensions
T × K, but the output from the estimation routine might be K ×T, whereT de- notes the number of observations in a sample and K the number of variables in a regression. Sometimes lag truncated series are assumed for an estimation rou- tine, otherwise the raw data. These small differences can cause a major headache and can significantly decrease the acceptance of such a system. Taking the ex- periences with MMM into account, JStatCom makes fewer promises, but tries to adopt to the requests of potential users who need a user-friendly software for ap- plying advanced numerical methods. Like with the MMM approach, it is possible to combine different engines and arbitrary algorithms. However, the difference is that the set of available methods and the order, in which these methods can be executed, must be defined by the programmer. The user should only be given the choice between procedures that are meaningful in a certain context. Given that the approach taken with JStatCom works well in a non-distributed environment, one could think about ways to combine it with network services, if there is any need for such a feature.
1.4.4 The OmegaHat Project
An interesting open-source project to develop statistical software is OmegaHat.15 It was started in 1998. The project provides a language that is very similar to the Java programming language, but that can be used interactively. This means that expressions can be evaluated and executed directly on a command prompt.
Most statistical programming environments are interactive. The special feature of OmegaHat is that the language can serve as an integrating framework, or an umbrella system that uses various different tools via a single language interface.
It provides interfaces to the statistical programming languages R, S and S-plus.
OmegaHat is therefore not just another statistical language, but a programming environment with similar goals as JStatCom. However, the latter has a clear fo- cus on GUI interface components and provides a reusable design for statistical applications. The OmegaHat language could be used by JStatCom to access an execution engine, thus serving as a layer between the GUI interface and the ex- ecution engine. Therefore it might be a great resource for various tools that can
15The URL of the OmegaHat project is www.omegahat.org.
be used with JStatCom, because one of the goals of the OmegaHat project is to develop Java packages for statistical computing.
1.4.5 Creating GUI’s with Matlab
Matlab is one of the leading commercial solutions for numerical calculations in statistics and engineering. The language can be used not only for programming algorithms and calling graphics, but also to create graphical user interface com- ponents. Together with the Matlab Compiler, it is possible to create stand-alone applications with a graphical user interface. In fact, this approach is used for many useful tools used in statistics and economics, for example Uhlig (1999). Although the solution is often very convenient and serves the needs of many researchers, its capabilities to create and maintain more complex GUIs are restricted. Matlab pro- vides the development tool GUIDE for the purpose of designing user interfaces.
It is comparable to visual builder tools for Java or other languages. However, the system provides far less components and is less flexible as compared to Java Swing, for example. Although simple applications can be created quickly, in- creasingly complex projects tend to be hard to extend and maintain because the GUI components are not defined as objects or components. Therefore it is not eas- ily possible to split a complex GUI into several smaller components that can then be plugged together. Instead, the approach tends to create large monolithic files where various callback methods are defined, which are invoked from the GUI controls. There is no straightforward way to disentangle a complex application into smaller components that are relatively independent of each other. As a conse- quence, this can lead to the cancellation of otherwise successful projects or it can limit the potential to extend an already existing modelling toolkit. Another result of using this scheme is that Matlab applications tend to be dialog driven, because this is a way to combine several simpler GUIs in a single program to achieve the desired functionality. The reason is that there are no containers available that can hold many panels simultaneously which can be accessed via menu items, for ex- ample. Instead, new dialogs appear which hold the GUIs for different parts of a program. This may result in an unsatisfactory user experience as it clearly limits the possibilities for designing a GUI according to current standards.
JStatCom could be an alternative solution to create stand-alone programs, us- ing procedures originally coded in Matlab and compiled with the Matlab Com- piler. In this case, no GUI programming with Matlab would be necessary. Projects using this approach can expect to be extendable and maintainable, even if many features are implemented, given that some general design rules are followed.
There are no limitations in the programming of the user interface other than those that the Java language imposes. Matlab routines could even be combined with code from other languages. The drawback is that some Java programming would be necessary, instead of using only Matlab functions. For very simple applica- tions, this effort would not pay off, but for simple GUI’s there are no problems with Matlab either.
There are also other statistical packages that provide language features to cre- ate graphical user interfaces, for example Xplore with so called Quantlets. The main critics of these systems is always the same, they are great to create simple dialogs or wizards, but they are not optimal for the creation of more complex in- terfaces, or even applications with lots of features. JMulTi is an example for a software that could not have been created with only the help of the available tools.
1.4.6 Creating interactive Programs with Ox
Ox is a matrix oriented programming languages that introduces object-orientation to algorithm coding (Doornik (2002a)). In that respect it differs from other solu- tions and provides the potential to create even reusable object-oriented systems.
The software provides an API that makes it possible for external applications to call predefined procedures and to create objects. This feature is exploited by JS- tatCom, and it is therefore possible to use Ox code together with the GUI building capacities of the framework.
An extension of Ox is OxPack (Doornik and Ooms (2001)). Together with GiveWin, a graphical front-end that provides general functionality for all GUI modules, it can be used to create graphical interfaces to a model. The difference to the previously described approaches is that here an object-oriented approach was taken to provide GUI functionality. It is necessary to subclass theModelBase class which is then used byOxPack to set up the display of the user interface for