Research Collection
Working Paper
How many people come to our door?
Author(s):
Mesaric, Raphael; Meister, Adrian; Winkler, Caroline; Schatzmann, Thomas; Axhausen, Kay W.
Publication Date:
2020-08
Permanent Link:
https://doi.org/10.3929/ethz-b-000429814
Rights / License:
In Copyright - Non-Commercial Use Permitted
This page was generated automatically upon download from the ETH Zurich Research Collection. For more information please consult the Terms of use.
ETH Library
2
Raphael Mesaric 3
Institute for Transport Planning and Systems IVT 4
ETH Zürich, 8093 Zurich, Switzerland 5
Email: mesaricr@student.ethz.ch 6
ORCID: 0000-0001-8662-8680 7
8
Adrian Meister 9
Institute for Transport Planning and Systems IVT 10
ETH Zürich, 8093 Zurich, Switzerland 11
Email: adrian.meister@ivt.baug.ethz.ch 12
ORCID: 0000-0002-3350-9044 13
14
Caroline Winkler 15
Institute for Transport Planning and Systems IVT 16
ETH Zürich, 8093 Zurich, Switzerland 17
Email: caroline.winkler@ivt.baug.ethz.ch 18
ORCID: 0000-0002-0733-8990 19
20
Thomas Schatzmann 21
Institute for Transport Planning and Systems IVT 22
ETH Zürich, 8093 Zurich, Switzerland 23
Email: thomas.schatzmann@ivt.baug.ethz.ch 24
ORCID: 0000-0003-1889-5159 25
26
Kay W. Axhausen 27
Institute for Transport Planning and Systems IVT 28
ETH Zürich, 8093 Zurich, Switzerland 29
Email: axhausen@ivt.baug.ethz.ch 30
ORCID: 0000-0003-3331-1318 31
32 33
Word Count: 6231 words+5 table(s)×250=7481 words 34
35
Submission Date: August 3, 2020 36
ABSTRACT 1
This paper analyzes the traffic generated by delivery services and the drivers of demand behind 2
it. The evaluation is based on a regression analysis of four surveys conducted in Switzerland and 3
Singapore during the COVID-19 pandemic. The demand for delivery services has strongly in- 4
creased in recent years. Despite the fact that a lot of research is addressing the question of more 5
efficient business models to mitigate the negative implications of delivery services on traffic and 6
environment, little is known about the actual traffic volume generated by delivery services and the 7
drivers of demand. This paper analyzes these topics based on a regression analysis of survey data 8
from four survey conducted in Switzerland and Singapore during the COVID-19 pandemic. The 9
applied regression models confirm the results of the descriptive analysis and show the impact of 10
age, gender, income, education and family situation as well as the general shopping behavior on 11
the demand for deliveries. Food orders are often made by younger people without children and 12
lower education levels, while parcels are more often received by younger people with children, 13
higher income and higher education levels. For both food and parcel deliveries, complementary 14
effects between consumer behavior, online and in-store shopping can be observed.
15 16
Keywords: delivery services, demand analysis, survey data, zero-inflated regression analysis 17
INTRODUCTION 1
Online delivery services have experienced rapid growth in recent years, due to an ongoing glob- 2
alization and digitalization of commerce and supply chains (1). In the early stages of the delivery 3
industry, the focus was placed on parcel deliveries, i.e. the delivery of goods such as books, clothes 4
and shoes. Due to the continuous rise in demand, delivery services were able to expand over the 5
last years and now cover almost all product areas, including food (2). Many cities note an increase 6
in traffic volume, resulting in congestion and the blocking of streets by delivery vehicles (3). There 7
is a wide range of ongoing research trying to find potential solutions for these issues with the aid 8
of more efficient last-mile deliveries, i.e. from the sellers point of view. In addition, there is vast 9
knowledge about the total turnover and the turnover growth of the supply chain operators. How- 10
ever, little is known about the daily number of delivery vehicles, the consequential traffic volume 11
and the drivers for customers to use different delivery services.
12
This paper uses survey data from four surveys conducted in Switzerland and Singapore 13
to gain an insight into the use of food and parcel delivery services. The acquired survey data is 14
analyzed with zero-inflated regression models to find the relevant explanatory variables for the 15
number of deliveries. The survey periods coincided with the outbreak of the COVID-19 pandemic.
16
This pandemic, particularly the economic and social measures which arose from the pandemic, 17
had a serious impact on the results of the analysis. The governments in Switzerland as well as 18
in Singapore were forced to initiate a lockdown and a circuit breaker, respectively, which had 19
essentially the same consequences. People were advised to stay at home, shops, restaurants and 20
entire companies were closed (or limited to takeaway) and the social and professional interactions 21
were reduced to a minimum. The pandemic represents an extraordinary situation that has never 22
occurred in the past. This situation - despite or precisely because of its extraordinary characteristic - 23
is very interesting with regards to delivery services. The pandemic and the concomitant measures 24
have led to a rise in online orders, which makes it even more interesting to analyze the impacts on 25
the demand and compare the effects in the two countries. As the number of deliveries is expected 26
to be higher than in normal times, the results should be viewed as upper limit values. The question 27
remains whether this increase in demand is sustainable in the long term or will decrease again after 28
a certain time.
29
The rest of this paper is structured as follows: After the introduction, background infor- 30
mation related to the current state of research in the field of delivery services is provided. This is 31
followed by an explanation of the methodology and modelling framework before discussing the 32
survey design and sample characteristics for the presented case studies. The paper closes with the 33
results section and concluding remarks.
34
RELATED WORK 35
The following chapter gives an overview about the current state of research related to the delivery 36
industry. This includes research about the drivers of demand for online shopping and delivery 37
services, potential solutions for delivery related problems and recent case studies with regards to 38
online purchasing behaviour and parcel deliveries.
39
Drivers of demand for on-demand and delivery services 40
Considerable research effort has been devoted in recent years to find the drivers of online shopping.
41
Lee et al. (4) unveiled that age, income and perception of technology have major effects on the 42
likelihood to shop online. These findings are further underlined by another study of the same 43
authors (2) and research work from (5), (6) and (7) who stated that younger, better educated people 1
with higher incomes are more inclined to shop online. The effect of gender is more controversially 2
discussed as some studies do show that gender matters (8), while others did not detect a significant 3
relationship (4). Lee et al. (2) found a positive correlation between the use of e-commerce services 4
and the frequency of in-store shopping. These insights are in line with the findings from other 5
studies which revealed that there are complementary effects between online and in-store shopping 6
(7, 9). However, there is no general consensus regarding the direction and/or causality of this 7
interaction (2).
8
The type of the product does also affect whether an item is purchased online or in-store.
9
Kacen et al. (10) and Levin et al. (11) state that individuals are more inclined towards online 10
shopping when it comes to non-physical items and products such as books, while for other product 11
categories a more complex trade-off between advantages and disadvantages is carried out during 12
the decision process. In this respect, Ferrell (12) found that people with less time on hand have 13
a higher probability of favouring the merits of online shopping versus traditional shopping as the 14
former is in this case considered as a substitute for more time-consuming shopping trips. In spite 15
of the fact that e-commerce is often viewed as a substitute for regular shopping trips not only for 16
individuals who are short of time but in a broader sense, research shows that quite the contrary 17
is the case. Srinivasan and Athuru (13) and Mokhtarian (14) unveiled that the use of information 18
and communication technology (ICT) in general is positively correlated with the number of trips 19
and urban congestion, i.e. urban congestion became worse over the course of the continuous 20
development and spread of ICT. This indicates that the complementary effects mentioned above 21
are more dominant than substitution effects.
22
Delivery related problems and solutions 23
This subsection discusses the issues of current delivery models and potential solutions. One of the 24
most prominent challenge of logistics is the last-mile delivery service. According to (15) and (16), 25
the last-mile delivery (LMD) corresponds to “the whole set of activities performed for delivering 26
goods in urban areas” and is the most time-consuming and cost-intensive part of the logistics chain.
27
An efficient LMD is further impeded by traffic congestion which heavily affects the cost of urban 28
delivery systems. Sankaran et al. (17) states that traffic congestion can amount to as much as 40%
29
of the total costs attributed to the supply chain.
30
These conditions ask for the development of new and innovative LMD services in combina- 31
tion with a tailored matching and pricing strategy to reduce travel distance and cost, as proposed by 32
(18). Besides the traditional home deliveries, self-service delivery models are the most widespread 33
solution for the last-mile delivery. They allow customers to “send out or pick up packages by 34
automated parcel cabinets” (16). The same authors found that - while these models are often prac- 35
tised by e-commerce businesses - the acceptance of this technology amongst customers remains 36
relatively low. This reluctance of the customers to use new services prolongs the time required 37
to implement new solutions. As a consequence, it can be seen that - while the need for innova- 38
tive LMD services is undoubted - one of the key questions remains how the business clients (e.g.
39
retailers) and customers can be attracted to use these new services.
40
Another approach to tackle the issues of traffic congestion and environmental pollution are 41
the studies from (19) and (20), respectively. Both are assessing the effect of traffic policies on 42
the general traffic situation. Köster et al. (20) found that the integration of information of traffic 43
management systems in the routing algorithms of delivery companies can substantially reduce the 44
length of their trips and subsequently also reduce traffic and emissions, especially in polluted areas.
1
Simoni and Claudel (19), on the other hand, highlight the importance of efficient and accurate 2
simulation models for the assessment of the implications of last-mile delivery movements and 3
related traffic policies.
4
A popular solution approach for the delivery of parcels and meals is the delivery with 5
drones. Many researchers share the opinion that drones will be widely used as a vehicular platform 6
for deliveries already in the near future (21, 22, 23). Kim (21) analysed the consumer preference 7
between drone and traditional delivery services. Based on the results of a stated preference sur- 8
vey, the author was able to show that not only price and product type do have an impact on the 9
consumer preference, but also sociodemographic characteristics. The most significant observation 10
was that the preference for drone delivery services increased with decreasing age, with gender and 11
household income also contributing. An entirely different aspect of drone deliveries is studied in 12
(23). The author investigates the energy demand of drone deliveries compared to ground-based 13
deliveries with Diesel trucks and electric trucks. He finds that drone deliveries are energy efficient 14
in rural settings with long distances, but not in urban areas with high customer density.
15
Apart from drone deliveries, there is less research exclusively about the courier, express, 16
parcel and food delivery industry. Correa et al. (24) investigated the collaborative consumption 17
of food delivery services through web mining techniques and stated that traffic conditions are not 18
significantly related to the number of orders and delivery time fulfilment. Steever et al. (25), on 19
the other hand, presented a new business model which allows customers to order food from more 20
than one restaurant at a time. The authors use a mixed integer programming (MIP) approach and 21
show that their proposed business model does not lead to longer delivery times for the customer 22
but reduces the distance travelled by a courier fleet throughout a day.
23
Case studies about online purchasing behaviour and parcel deliveries 24
Due to the rare occurrence of pandemics in recent years - the Centers of Disease Control and 25
Prevention (CDC) cite only one pandemic between 1969-2018 (26) - there are almost no case 26
studies about pandemic-related shopping behaviour. However, there is also only a limited number 27
of case studies that provide data related to the extent of online shopping and the subsequent number 28
of deliveries in normal times. The city of Zurich has conducted a population survey in 2019 with 29
a focus on shopping and postal service, but without going into more detail regarding the number 30
of parcels received in a specific time period, e.g. during a week or month (27). The study showed 31
that people are shopping more regularly online, but whether or not something is purchased online 32
depends strongly on the type of the product. While groceries are still bought offline to a large 33
extent, other product categories such as books and clothes are already bought online frequently.
34
The second finding of the study is that there are two major hot spots for the reception and return of 35
items purchased online. 72% of the purchases are received at home, another 22% at the post office.
36
For the return of products, the post office is the preferred location with 65%. In other words, 94%
37
of the receptions and 70% of the returns are concentrated in post offices and the customer’s homes.
38
Taking into account the increasing demand for online deliveries, this implies that delivery services 39
represent a considerable share of the traffic on the streets in Zurich.
40
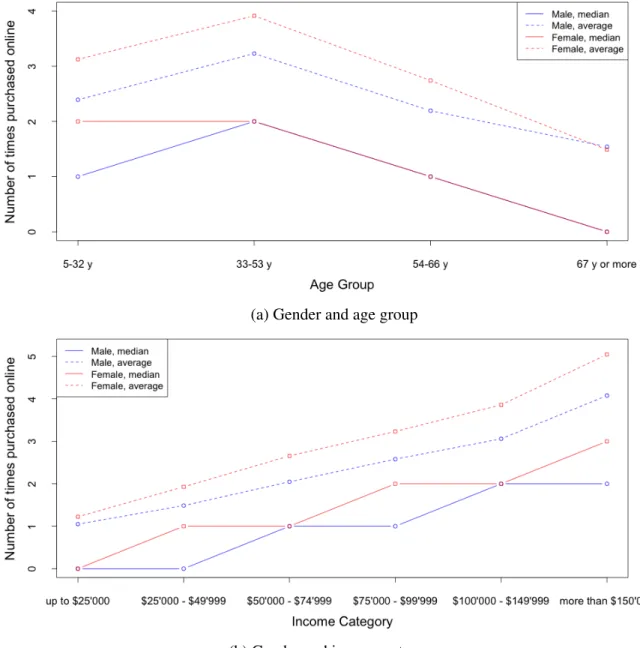
A second case study is the National Household Travel Survey (NHTS) which is conducted 41
by the Federal Highway Administration (FHWA) and provides information about the travel be- 42
haviour of the American public (28). Figures 1a and 1b show the relationship between the number 43
of items purchased online, the gender and age and income, respectively. It is evident that older 44
people order less items online than younger people, while with increasing income people tend 1
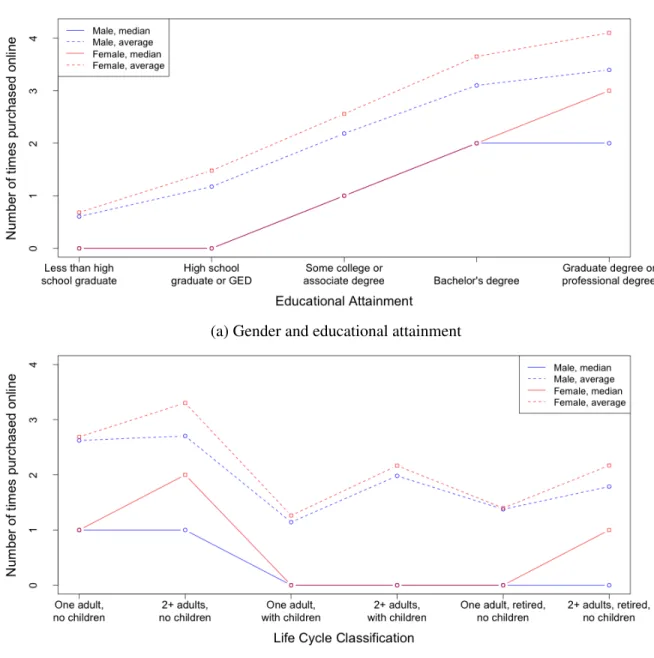
to purchase more via online distribution channels. Figure 2a indicates that a higher educational 2
degree is linked to a higher number of products ordered online. Figure 2b, on the other hand, 3
illustrates two things. First, multi-person households are ordering more items than single-person 4
households of the same category and second, families with children and retired people order less 5
than working people without children. All figures have in common that females tend to purchase 6
more online than their male counterparts.
7
METHOD 8
This section describes the methodology, including the different data sources as well as the mod- 9
elling frameworks. After the descriptive analysis of the survey data, zero-inflated Poisson re- 10
gression is applied to account for the special characteristics of count data and find the relevant 11
explanatory variables for the number of parcel and food deliveries. The regression models take 12
into account the sociodemographic variables age, gender, income and education level.
13
Data 14
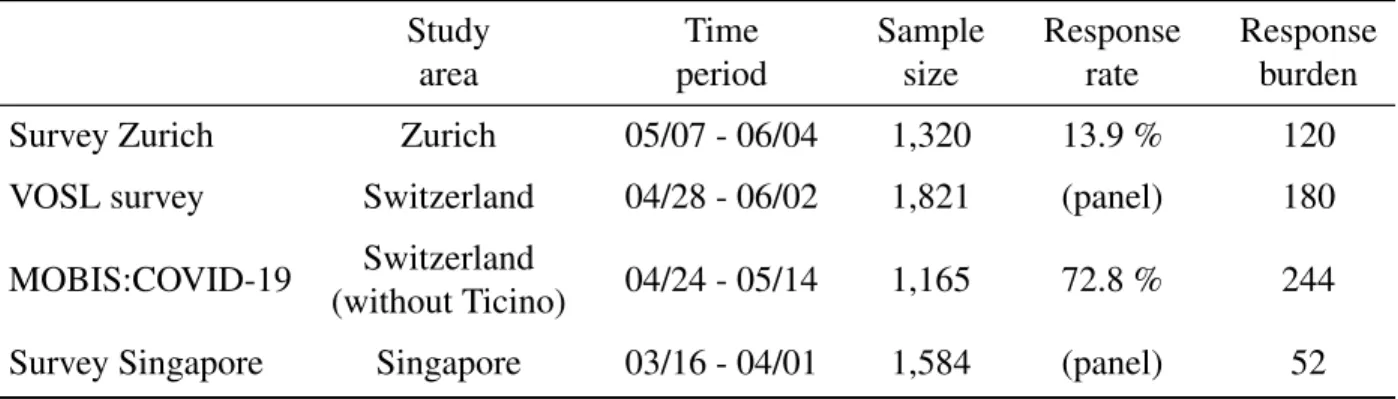
In total, four surveys have been conducted in Switzerland and Singapore during the COVID-19 15
pandemic in spring 2020 to collect socioeconomic data and information about the online purchas- 16
ing behavior (see Table 1). The four surveys were conducted in different contexts. The survey in 17
Singapore focused mainly on the collection of socioeconomic data of the participants and infor- 18
mation about the number of external visits at their door, i.e. parcel deliveries, food deliveries and 19
visits from other suppliers. The surveys in Switzerland focused additionally on the implications of 20
the COVID-19 pandemic on the everyday life of the participants. As a consequence, these surveys 21
were significantly longer, as can be seen in the response burden in Table 1. The response burden 22
has been calculated according to the method described in (29).
23
TABLE 1: Overview about the four surveys.
Study Time Sample Response Response
area period size rate burden
Survey Zurich Zurich 05/07 - 06/04 1,320 13.9 % 120
VOSL survey Switzerland 04/28 - 06/02 1,821 (panel) 180
MOBIS:COVID-19 Switzerland
04/24 - 05/14 1,165 72.8 % 244
(without Ticino)
Survey Singapore Singapore 03/16 - 04/01 1,584 (panel) 52
Survey Zurich 24
The survey in Zurich has been conducted in May 2020, after the outbreak of the COVID-19 pan- 25
demic, the lockdown and the subsequent closure of businesses. The survey has been distributed 26
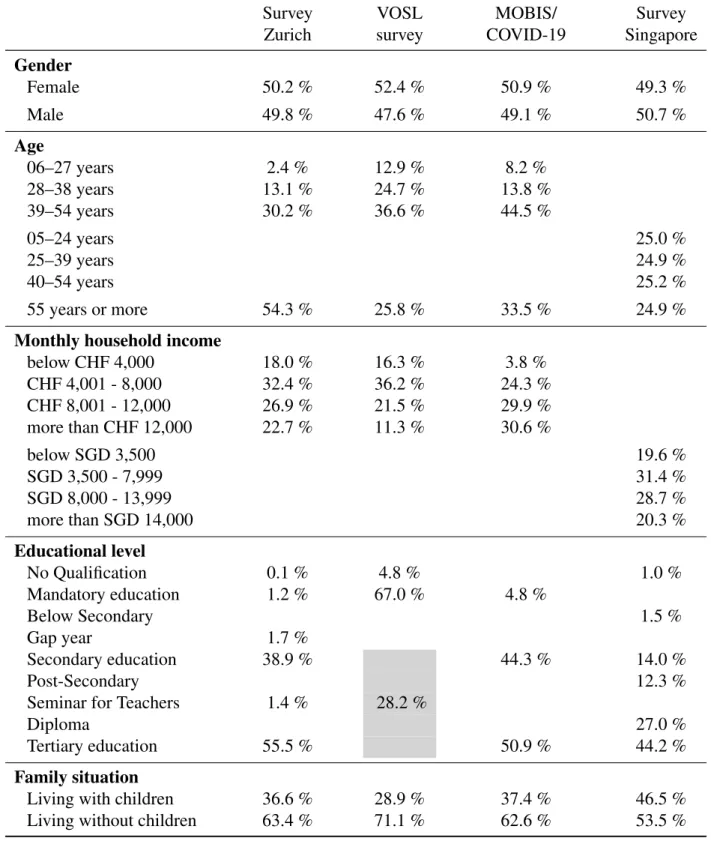
by email. The impact of this distribution method can be clearly seen in the descriptive analysis in 27
Table 2 as the shares of the single age categories vary greatly. Younger people up to 38 years are 28
significantly underrepresented. Regarding the income, the differences are more moderate. There 29
(a) Gender and age group
(b) Gender and income category
FIGURE 1: Number of times purchased online in the last 30 days by gender, age group and income category.
(a) Gender and educational attainment
(b) Gender and life cycle classification
FIGURE 2: Number of times purchased online in the last 30 days by gender, educational attainment and life cycle classification.
are more participants with medium income level and a lower share of respondents with very low 1
or high income levels. The analysis of the educational attainments reveals that more than 94 % of 2
the people have a secondary education or higher and considerable 55 % have a university degree.
3
The variables in Table 3 describe the shopping behaviour. It can be stated that most of the 4
numbers coincide with the ones of the other surveys in Switzerland and Singapore. The number 5
of received parcels in the last seven days before the completion of the survey is slightly higher 6
than in the other surveys, while the number of received mail besides parcels amounts to 4.1 and 7
is significantly higher than in the VOSL and the MOBIS:COVID-19 survey. Furthermore, the 8
analysis shows that people in Zurich appear to place fewer food orders and are visited by other 9
suppliers less often than Singapore residents.
10
VOSL survey 11
The VOSL survey has been conducted in Switzerland in April and May 2020, after the outbreak 12
of the COVID-19 pandemic, the lockdown and the subsequent closure of businesses. The survey 13
was designed to measure the risk perception and behavioral response during the pandemic and 14
additionally captured online shopping activities. The survey has been distributed with a panel 15
provider. Similar to the survey in Zurich, younger people are underrepresented, but on a smaller 16
scale and only affecting the youngest age category (Table 2). The lower response rate among 17
people up to 27 years is compensated with a higher participation rate of the age group 39-54 18
years. Regarding the income, the distribution is almost identical to the survey in Zurich. There 19
are more participants with medium income level and a lower share of respondents with very low 20
or high income levels. The analysis of the educational attainments reveals that only 28% of the 21
people have a secondary education or higher. For 67% of the participants, the completion of the 22
mandatory education is the highest educational attainment.
23
In Table 3, it can be seen that the distribution of most of the consumer and shopping vari- 24
ables is consistent with the other surveys. The VOSL survey generally exhibits the highest mean 25
of the surveys in Switzerland, with three exceptions. The number of received parcels in the last 26
seven days before the completion of the survey as well as the average number of grocery shopping 27
trips by other people are slightly lower than in the other surveys, while the number of received mail 28
besides parcels amounts to 2.4 and is significantly lower than in the Zurich or the MOBIS:COVID- 29
19 survey. Furthermore, the analysis shows that people in Switzerland appear to place fewer food 30
orders than Singapore residents.
31
MOBIS:COVID-19 32
MOBIS:COVID-19 is part of the MOBIS study (Mobility Behaviour in Switzerland), a large- 33
scale mobility pricing field experiment that was carried out from the beginning of September 2019 34
until mid-January 2020 in the German- and French-speaking parts of Switzerland, using a GPS 35
tracking app to record the travel activity of participants. 3,523 persons completed the final survey 36
after a tracking period of eight weeks. Despite the end of the study, some participants continued 37
using the tracking app, with roughly 400 participants still using it by mid-March 2020. After the 38
outbreak of the COVID-19 pandemic in Switzerland, the remaining participants were re-invited 39
to reactivate the tracking app. 1,600 particpants re-installed it and most resumed tracking. These 40
participants make up the MOBIS:COVID-19 panel and were invited to an online survey in order to 41
understand how they have changed their everyday life due to the pandemic and how they generally 42
assess the risk of getting infected or infecting someone else. Even though the centerpiece is a 43
TABLE 2: Descriptive analysis of categorical variables.
Survey VOSL MOBIS/ Survey
Zurich survey COVID-19 Singapore
Gender
Female 50.2 % 52.4 % 50.9 % 49.3 %
Male 49.8 % 47.6 % 49.1 % 50.7 %
Age
06–27 years 2.4 % 12.9 % 8.2 %
28–38 years 13.1 % 24.7 % 13.8 %
39–54 years 30.2 % 36.6 % 44.5 %
05–24 years 25.0 %
25–39 years 24.9 %
40–54 years 25.2 %
55 years or more 54.3 % 25.8 % 33.5 % 24.9 %
Monthly household income
below CHF 4,000 18.0 % 16.3 % 3.8 %
CHF 4,001 - 8,000 32.4 % 36.2 % 24.3 %
CHF 8,001 - 12,000 26.9 % 21.5 % 29.9 %
more than CHF 12,000 22.7 % 11.3 % 30.6 %
below SGD 3,500 19.6 %
SGD 3,500 - 7,999 31.4 %
SGD 8,000 - 13,999 28.7 %
more than SGD 14,000 20.3 %
Educational level
No Qualification 0.1 % 4.8 % 1.0 %
Mandatory education 1.2 % 67.0 % 4.8 %
Below Secondary 1.5 %
Gap year 1.7 %
Secondary education 38.9 %
28.2 %
44.3 % 14.0 %
Post-Secondary 12.3 %
Seminar for Teachers 1.4 % 28.2 %
Diploma 27.0 %
Tertiary education 55.5 % 50.9 % 44.2 %
Family situation
Living with children 36.6 % 28.9 % 37.4 % 46.5 %
Living without children 63.4 % 71.1 % 62.6 % 53.5 %
TABLE 3: Descriptive analysis of numeric variables (over time period of last week).
sum median mean sd min max
Received parcels
Survey Zurich 2,105 1 1.59 1.61 0 10
VOSL survey 2,257 1 1.24 1.32 0 5+
MOBIS:COVID-19 1,735 1 1.49 1.77 0 11+
Survey Singapore 2,175 1 1.53 1.70 0 10
Other mail besides parcels
Survey Zurich 5,398 4 4.09 1.70 0 7
VOSL survey 4,311 2 2.37 2.01 0 7
MOBIS:COVID-19 3,822 3 3.28 1.73 0 7
Mail pickup
Survey Zurich 550 0 0.42 0.87 0 6
VOSL survey 1,006 0 0.55 1.06 0 7
MOBIS:COVID-19 442 0 0.38 0.80 0 7
Food deliveries
Survey Zurich 315 0 0.24 0.65 0 7
VOSL survey 670 0 0.37 0.93 0 7
MOBIS:COVID-19 223 0 0.19 0.50 0 5
Survey Singapore 2,270 1 1.60 1.82 0 13
Food pickup
Survey Zurich 296 0 0.22 0.63 0 7
VOSL survey - - - -
MOBIS:COVID-19 260 0 0.22 0.58 0 7
Grocery shopping - Personal
Survey Zurich 2,818 2 2.13 1.42 0 7
VOSL survey 4,212 2 2.31 1.44 0 7
MOBIS:COVID-19 2,021 2 1.73 1.27 0 7
Grocery shopping - by others
Survey Zurich 945 0 0.72 1.09 0 7
VOSL survey 904 0 0.50 1.64 0 14
MOBIS:COVID-19 833 0 0.72 1.09 0 7
Grocery delivery
Survey Zurich 277 0 0.21 0.61 0 6
VOSL survey 493 0 0.27 0.88 0 7
MOBIS:COVID-19 152 0 0.13 0.46 0 6
Shopping trips
Survey Zurich 2,950 2 2.23 1.57 0 12
Survey Singapore 3,312 2 2.32 1.65 0 7
Visits from other suppliers
Survey Zurich 379 0 0.29 0.71 0 7
Survey Singapore 1,220 0 0.86 1.49 0 7
mode choice experiment, the survey deliberately includes the same batch of questions on online 1
shopping services like those used in the other three surveys.
2
The survey has been conducted from end of April until mid-May 2020 and was distributed 3
by email. In Table 2, it can be seen that the shares of the single age categories vary greatly. Younger 4
people up to 38 years are significantly underrepresented, similar to the survey in Zurich. In contrast 5
to the other surveys, this differences are also reflected in the income distribution. Only 4% of the 6
respondents are in the lowest income category. The analysis of the educational attainments reveals 7
that more than 95% of the people have a secondary education or higher and considerable 51% have 8
a university degree. This distribution strongly resembles the one of the survey in Zurich.
9
The values of the consumer and shopping variables in Table 3 are to a large part in a 10
similar range as for the other surveys. Contrary to the VOSL survey, the MOBIS:COVID-19 survey 11
generally exhibits the lowest mean of the surveys in Switzerland, with the same three exceptions.
12
The number of received parcels as well as the number of received mail besides parcels in the 13
last seven days before the completion of the survey lie in between the other surveys, while the 14
average number of grocery shopping trips is the highest one, together with the survey in Zurich.
15
Furthermore, the analysis shows again that people in Switzerland appear to place fewer food orders 16
than Singapore residents, hence confirming the observation made in the VOSL survey.
17
Survey Singapore 18
The survey in Singapore has been conducted in March 2020, after the outbreak of the COVID-19 19
pandemic but before the initiation of the circuit breaker and the subsequent closure of businesses.
20
The survey has been distributed with a panel provider to ensure a balanced distribution of respon- 21
dents. The impact of the panel provider can be seen in the descriptive analysis in Table 2 as the 22
share of the single gender and age categories is almost identical. Regarding the income, there are 23
more participants with medium income level and a lower share of respondents with very low or 24
high income levels. The analysis of the educational attainments reveals that more than 80% of the 25
people have a post-secondary education or higher.
26
The variables describing the shopping behaviour indicate that - while the number of parcels 27
received and the number of shopping trips (each in the last seven days before the completion of the 28
survey) are similar to the other surveys - people in Singapore tend to place significantly more food 29
orders and are visited by other suppliers more often (Table 3). On average, Singapore residents 30
receive 1.6 food deliveries per week and are visited almost once a week by another supplier.
31
Zero-inflated Poisson regression 32
The dependent variables in our models are the number of parcels and food deliveries, respectively, 33
over the course of the last week before the completion of the survey. The answers are given 34
in absolute values and can therefore be characterized as count data. Relevant covariates include 35
gender, age, highest educational attainment and household income. These variables are measured 36
with dummy variables. For the gender, there are two answer possibilities (female and male), while 37
there are four options each for the household income and the age. The possible answers for the 38
education level range from mandatory education to tertiary education in varying levels of detail.
39
In addition to these sociodemographic and -economic variables, the individual covariates in the 40
models also include variables describing the general shopping behaviour. These include among 41
others the number of newspapers received on different days of the week as well as the number of 42
shopping trips made over the course of the last week.
1
In order to obtain accurate regression results, it is crucial to apply a regression method 2
which accounts for the special characteristics of count data. Count data consists of non-negative in- 3
tegers and can be classified into two categories, data with large means and data with low means((30, 4
31). In the surveys presented in this paper, the latter case exists, i.e. the data exhibits low means 5
and has a right-skewed distribution due to the truncation of the values at zero. According to (32), 6
the Poisson distribution is the standard distribution for count data. This regression model assumes 7
that the dependent variable approximates a Poisson distribution and is defined in its entirety by the 8
mean (see Equation 1).
9
p(Y =y|λ) =e−λ∗λy
y! (1)
10
whereλ is the mean respectively the expected value of the Poisson distribution and at the 11
same time its variance (33). Equation 2 defines the likelihood function for the Poisson model.
12
L(β|y,X) =
N
∏
i=1
p(yi|λi) =
N
∏
i=1
e−λi∗λiyi
y! (2)
13
While the Poisson regression is a good first choice for the analysis of count data, it does not 14
take into account excess zeros. This aspect is covered by the zero-inflated Poisson regression which 15
estimates two models simultaneously, one for the count data (representing the “true” zeros) and one 16
for the excess zeros (33). Previous studies in other research areas have shown that zero-inflated 17
models yield better results for data with excess zeros than, for example, the ordinary Poisson 18
regression (34, 35).
19
In the present case of online deliveries as the independent variable, the true zeros in the 20
survey responses come from people who generally order online, but have not done so in the inves- 21
tigated time period. In contrast, excess zeros are obtained from respondents who do never order 22
online. In other words, the model for the excess zeros in zero-inflated models does assess the vari- 23
ables of relevance for the question if a person or a specific sociodemographic group is ordering 24
online while the model for the count data (which includes the true zeros) does estimate the coeffi- 25
cients to predicthow muchsomebody is ordering online. The variables in a zero-inflated Poisson 26
regression model appear in exponential form, for the model for the excess zeros as well as for 27
the count model. To assess the real impact on the dependent variable, the coefficients have to be 28
inserted as exponents into the exponential function (see Equation 3).
29
probability increase=ecoe f f icient−1 (3)
30
However, there is a significant difference between the two models regarding the interpreta- 31
tion of the coefficients. In the model for the excess zeros (in the present case of online deliveries), 32
the coefficients indicate an increase in the probability of not ordering online at all while the co- 33
efficients in the count model increase the likelihood of purchasing more items online among the 34
people who are generally ordering online (36).
35
RESULTS 1
First, the zero-inflated Poisson regression is applied to the number of parcels received over the 2
course of the last week. The results are presented in Table 4. It can be seen that a lower household 3
income level has two implications. In the zero model, it leads to a higher probability of people not 4
receiving parcels at all (compared to people in the highest income category). In the count model, 5
on the other hand, it does also generate a lower number of received parcels among the people who 6
generally do order parcels. A second major finding is that variables describing the general shopping 7
behaviour do have a significant impact on the number of parcels received. A higher frequency of 8
grocery shopping - regardless if personally or by friends/volunteers - as well as a higher amount 9
of mail received besides parcels exhibit a positive correlation with the number of received parcels.
10
In a similar way, the dependent variable is positively influenced by a more frequent use of other 11
delivery services, e.g. food deliveries and grocery deliveries, and the general consumer behaviour 12
(e.g. number of visits from other suppliers and number of shopping trips). These observations are 13
consistent with findings from previous studies (7, 9).
14
The results further show that families living with children tend to receive more parcels.
15
Younger people up to 40 years appear to order more compared to older people. This is in line 16
with the findings of (2), (5), (6) and (7), as is the indication that higher-educated people are re- 17
ceiving significantly more parcels than people with lower education. The effect of the reception of 18
newspapers on different days of the week varies and barely exhibits any statistical significance.
19
Table 5 presents the results of the zero-inflated Poisson regression with respect to the num- 20
ber of food orders made in the last seven days before the survey. It can be stated that the deductions 21
from the previous model do also apply in this case to a large part. The variables describing the 22
shopping and the consumer behaviour are positively correlated with the number of food orders.
23
Higher frequencies of grocery shopping, visits from other suppliers and shopping trips as well as 24
a larger amount of mail received besides parcels come along with more food deliveries. Younger 25
people up to 40 years appear to not only receive more parcels, but also place more food orders 26
compared to people older than 40 years. Just as in the first model, the effect of the reception of 27
newspapers varies and does barely exhibit any statistical significance.
28
However, there are also noticeable differences between the two models. First, the impact 29
of the household income is not as clear for the food orders as for the received parcels. While a 30
lower income level still leads to a significantly higher probability of people not ordering at all - 31
especially for the lowest income category - in the zero model, the implications are less distinct 32
in the count model. In the VOSL survey and in Singapore, lower income even tends to generate 33
more food orders compared to the highest income category. The results further show that families 34
with children generally order less food than families with children. While being in contrast with 35
the results for the parcels, it is reasonable, as a food order for an entire family is rather expensive.
36
Another difference to the first model is the indication that lower-educated people are ordering 37
significantly more food than people with higher education.
38
These results provide important information about the consumer behaviour in different 39
countries and the type of households which are most likely to make use of delivery services. The 40
model parameters allow to calculate the traffic generated by delivery services in specific parts of 41
different cities based on their respective characteristics (e.g. age and income distribution). The 42
findings can then be incorporated into the development of efficient LMD business models and 43
localized traffic policies as mentioned in the literature review.
44
CONCLUSION 1
Many studies have investigated how many times people are leaving their houses or apartments 2
for specific purposes. However, little is known about the number of people that are coming to our 3
houses, how often they do so, and for which purpose. Based on four surveys in two countries during 4
the COVID-19 pandemic, this paper provides a first insight into the demand for delivery services 5
and the drivers behind it. The presentation of the methodology and the contextual description of 6
the surveys is followed by a brief statistical analysis of the most important variables.
7
The results of the zero-inflated Poisson regression reveal that online deliveries are more 8
prevalent among younger people up to 40 years. Furthermore, there are complementary effects 9
between general consumer behaviour, online and in-store shopping. Lower income levels do lead 10
to a lower probability of ordering online at all for both parcels and food, but have varying effects 11
for the two product types on the actual number of orders among the people who do order online.
12
Family situation and education level have opposing implications on parcel and food deliveries.
13
While children and higher education levels come along with more parcel deliveries, they lead to a 14
lower number of food orders.
15
Our results provide first insights into the drivers of demand specifically for parcel and food 16
deliveries. The simultaneous occurrence of the COVID-19 pandemic and the concomitant increase 17
in the demand for deliveries underlines the relevance of the analysis. In a further step, it is possible 18
to use the gathered survey data and the regression results for extrapolation purposes and predict 19
the number of deliveries and hence the traffic generated in specific parts of different cities based 20
on their respective characteristics such as age and income distribution.
21
TABLE4:Regressionresultsofzero-inflatedPoissonregressionwithallvariablesforthenumberofparcelsreceived. SurveyZurichVOSLsurveyMOBIS/COVID-19SurveySingapore CountmodelZeromodelCountmodelZeromodelCountmodelZeromodelCountmodelZeromodel (Intercept)−0.01(0.18)−3.50(0.77)∗∗∗−0.30(0.17)−3.01(0.94)∗∗0.01(0.16)−1.67(0.37)∗∗∗−0.12(0.12)−6.08(1.16)∗∗∗ Gender-Female0.11(0.09)0.35(0.93)0.07(0.05)1.25(0.72)0.06(0.06)0.77(0.35)∗0.06(0.05)0.42(0.38) Gender-Male Agegroup-06-27years−0.46(0.34)−15.28(NA)0.10(0.09)0.42(0.61)0.14(0.13)0.39(0.51) Agegroup-28-38years0.16(0.13)−0.62(1.59)0.05(0.08)−0.38(0.67)−0.00(0.09)−16.80(NA) Agegroup-39-54years0.10(0.10)0.37(0.67)−0.11(0.07)−0.17(0.56)−0.01(0.08)−0.20(0.38) Agegroup-05-24years0.31(0.08)∗∗∗0.51(0.54) Agegroup-25-39years0.25(0.07)∗∗∗−0.13(0.58) Agegroup-40-54years0.17(0.07)∗ 0.17(0.57) Agegroup-55yearsormore Family-Livingwithchildren−0.02(0.07)0.61(0.55)0.18(0.06)∗∗ −1.56(0.99)0.14(0.06)∗ −0.47(0.36)0.21(0.06)∗∗∗ 1.59(0.67)∗ Family-Livingwithoutchildren Householdincome-Level01−0.18(0.12)2.00(0.90)∗−0.12(0.09)0.32(0.60)−0.19(0.17)0.99(0.65)0.01(0.10)3.30(0.85)∗∗∗ Householdincome-Level02−0.16(0.10)0.78(1.13)−0.07(0.06)−0.10(0.48)−0.23(0.08)∗∗ 0.50(0.41)−0.23(0.07)∗∗ 2.01(0.76)∗∗ Householdincome-Level03−0.09(0.10)0.64(1.09)−0.09(0.07)−14.08(NA)−0.15(0.07)∗ −0.05(0.40)−0.14(0.06)∗ −22.41(NA) Householdincome-Level04 Education-Noqualification−0.03(0.14)1.40(0.71)∗0.11(0.23)−15.53(NA) Education-Mandatoryeducation−0.26(0.30)−17.15(NA)−0.03(0.06)0.25(0.56)−0.47(0.13)∗∗∗−18.20(NA) Education-Belowsecondary−0.23(0.23)1.34(1.12) Education-Secondaryeducation−0.17(0.08)∗ −0.51(0.82)−0.18(0.06)∗∗ −0.86(0.39)∗ −0.16(0.09)0.44(0.86) Education-Post-secondary0.27(0.08)∗∗ 2.57(0.79)∗∗ Education-Diploma0.02(0.06)0.91(0.75) Education-Tertiaryeducation Food-Orderslastweek0.08(0.04)∗ 0.04(0.03)0.05(0.05)0.11(0.01)∗∗∗ Food-Externalpickup−0.00(0.04)0.01(0.04) Othersupplierslastweek0.05(0.03)0.13(0.02)∗∗∗ Shoppingtripslastweek0.03(0.02)0.06(0.01)∗∗∗ Newspapers-Onweekdays−0.09(0.13)0.15(0.14)−0.03(0.11)−0.05(0.07) Newspapers-OnSaturdays−0.12(0.08)0.06(0.07)−0.24(0.08)∗∗ −0.01(0.07) Newspapers-OnSundays0.24(0.09)∗∗ −0.04(0.08)0.15(0.09)0.01(0.07) Newspapers-Never0.08(0.14)0.06(0.15)0.06(0.12)−0.20(0.09)∗ Groceries-Personal0.01(0.03)0.04(0.02)∗∗−0.01(0.02) Groceries-Delivery0.17(0.05)∗∗∗−0.02(0.04)0.14(0.05)∗∗ Groceries-ByOthers−0.02(0.03)0.00(0.02)0.02(0.02) Mail-Otherthanparcels0.09(0.02)∗∗∗ 0.11(0.01)∗∗∗ 0.14(0.02)∗∗∗ Mail-Externalpickup0.11(0.03)∗∗∗ 0.12(0.02)∗∗∗ 0.23(0.02)∗∗∗ AIC2964.682964.685200.805200.803819.643819.644284.254284.25 LogLikelihood−1447.34−1447.34−2568.40−2568.40−1876.82−1876.82−2107.13−2107.13 Num.obs.908908181518151165116514181418 ∗∗∗p<0.001;∗∗p<0.01;∗p<0.05