Policy Research Working Paper 7020
Comparable Estimates of Returns to Schooling Around the World
Claudio E. Montenegro Harry Anthony Patrinos
Education Global Practice Group
WPS7020
Public Disclosure AuthorizedPublic Disclosure AuthorizedPublic Disclosure AuthorizedPublic Disclosure AuthorizedPublic Disclosure AuthorizedPublic Disclosure AuthorizedPublic Disclosure AuthorizedPublic Disclosure Authorized
Abstract
The Policy Research Working Paper Series disseminates the findings of work in progress to encourage the exchange of ideas about development issues. An objective of the series is to get the findings out quickly, even if the presentations are less than fully polished. The papers carry the names of the authors and should be cited accordingly. The findings, interpretations, and conclusions expressed in this paper are entirely those of the authors. They do not necessarily represent the views of the International Bank for Reconstruction and Development/World Bank and
Policy Research Working Paper 7020
This paper is a product of the Education Global Practice Group. It is part of a larger effort by the World Bank to provide open access to its research and make a contribution to development policy discussions around the world. Policy Research Working Papers are also posted on the Web at http://econ.worldbank.org. The authors may be contacted at hpatrinos@
worldbank.org
Rates of return to investments in schooling have been esti- mated since the late 1950s. In the 60-plus year history of such estimates, there have been several attempts to synthe- size the empirical results to ascertain patterns. This paper presents comparable estimates, as well as a database, that use the same specification, estimation procedure, and similar data for 139 economies and 819 harmonized household surveys. This effort to compile comparable estimates holds constant the definition of the dependent variable, the set of control variables, the sample definition, and the estimation
method for all surveys in the sample. The results of this study show that (1) the returns to schooling are more con- centrated around their respective means than previously thought; (2) the basic Mincerian model used is more stable than may have been expected; (3) the returns to school- ing are higher for women than for men; (4) returns to schooling and labor market experience are strongly and positively associated; (5) there is a decreasing pattern over time; and (6) the returns to tertiary education are highest.
Comparable Estimates of Returns to Schooling Around the World
Claudio E. Montenegro
World Bank and Department of Economics, University of Chile
Harry Anthony Patrinos
World Bank
JEL codes: C13, J31
Keywords: Returns to schooling; Returns to experience; Investments in education
I. INTRODUCTION
Education is critical for economic growth and poverty reduction. Quality education systems produce the global economy’s workers and expand knowledge. Schooling enables students to learn the skills that propel individual labor productivity. A host of social and non-market benefits are also produced by schooling, including but not limited to increased child well-being, health status, efficiency of consumer choices, and social capital. The individual contribution of schooling has often been measured by labor market earnings. Similarly, potential experience is a proxy for skills learned in the workplace. In many poor economies, education and labor market experience are the only human assets for a vast part of the labor force.
The study of the relationship between schooling and earnings has led to a number of empirical studies on a variety of social issues. These include, for example, racial and ethnic discrimination (McNaab and Psacharopoulos (1981); Chiswick (1988)); gender discrimination (Goldin and Polacheck (1987); income distribution (Mincer (1958); the determinants of the demand for education (Freeman (1976)); the impact of technology on wage differentials (Krueger (1993)); the impact of unexpected price, productivity and technology shocks (King, Montenegro, and Orazem (2012)); the impact of information on demand for schooling (Jensen (2010)); and the returns to schooling in the context of job creation (World Bank (2012). Under certain assumptions, earnings differentials by level of education have been used to identify the sources of economic growth (see, for example, Denison (1967). But perhaps the quintessential application has been the estimation of the rate of return to investment in schooling. Earnings of workers classified by some dimension have been at the core of empirical economics and other social sciences for many decades, starting with human capital theory (Schultz (1961); Becker (1964); Mincer (1974).
For 40 years, researchers (Banerjee and Duflo (2005); Colclough, Gandhi Kingdon, and Patrinos (2010); Harmon, Oosterbeek, and Walker (2003); Psacharopoulos (1972), Psacharopoulos (1973), Psacharopoulos (1985), Psacharopoulos (1989), Psacharopoulos (1994); Psacharopoulos and Patrinos (2004), Psacharopoulos and Layard (2012)) have reported on the patterns of estimated returns to schooling across developing economies.
The returns are typically in the form of the estimated proportional increase in an individual’s labor market earnings from each additional year of schooling completed.
Among the consistent findings across the various surveys are:
1. Private returns to schooling are generally positive and the cross-economy average rate of return to schooling is 10 percent a year.
2. Returns to schooling seem to be higher in low or middle income economies than in high income economies.
3. Returns to schooling are highest at the primary level and become smaller
(although still large) at the secondary and tertiary levels of schooling.
4. Estimated returns to schooling are higher for women than for men.
5. Returns to schooling have declined very modestly over time despite rising average levels of schooling attainment, suggesting that the world demand for skills has been increasing as the world skill supply has also increased.
All but one of these findings survive our analysis and that is point 3; in fact, tertiary education now displays the highest average private rates of return.
As discussed by Psacharopoulos and Patrinos (2004), the stylized facts presented above are based on compilations of studies that may not be strictly comparable. There are two main sources of non-comparability: data sample coverage and methodology. First, survey samples may not accurately reflect population means. For cost or convenience, surveys may concentrate on subpopulations that are easier or less expensive to reach, focusing on firms rather than households, or concentrating on urban populations while excluding rural residents. Second, studies rarely use the same model to estimate returns.
Variation in control variables used can affect estimated returns, as can variation in the estimation strategy used. Both of these problems make it possible for observed variation in estimated returns to be due to these differences in sample design or estimation method and not to the true variation in returns.
Another methodological limitation is that researchers often include in the regression model many independent variables (Becker (1964). This procedure leads to a lower estimated effect of education on earnings. While researchers who include other variables in earnings functions do so because they are interested in modeling earnings, not necessarily in estimating the rate of return to schooling, this nevertheless leads to biased estimates when the schooling coefficient is interpreted as a rate of return.
This paper presents new and comparable estimates of the private returns to schooling (and to potential experience) using data from 139 economies with a total of 819 harmonized household surveys. The sample includes several economies for which there is more than one survey available. Private rates of return are used to explain the behavior of individuals in seeking different education levels. Estimates of the returns to schooling and to potential experience are a useful indicator of an individual’s productivity. This evidence can be used to guide public policy in the design of programs and crafting of incentives that both promote investment in education and ensure that low-income families make those investments.
The paper sets out to describe the patterns and trends using the same specification and estimation procedure by making use of harmonized country surveys and by using comparable methods. This effort to compile comparable estimates addresses the issues in the literature such as by holding constant (i) the definition of the dependent variable; (ii) the variables used as controls; (iii) sample definitions; and (iv) estimation method for all the surveys in the sample. The results show (i) that the returns to schooling and potential experience are more concentrated around their respective means than previously thought;
(ii) the basic Mincerian model used is more stable that one may have expected; (iii) the
returns to schooling are higher for women than for men; (iv) returns to education and to potential experience are strongly and positively associated; (v) returns demonstrate a decreasing pattern over time; and (iv) returns to tertiary education are the highest and to secondary education the lowest.
II. METHODS
The private rate of return compares the costs and benefits of schooling as incurred and realized by the individual student who undertakes the investment. Mincer (1974) has provided a great service and convenience in estimating returns to schooling by means of the semi-log earnings function (see also Becker and Chiswick (1966). The now standard method to estimate private returns per year of schooling is to estimate log earnings equations of the form:
(1)
Ln(wi)=a+β1Si+β2Xi +β3Xi2 +µiwhere Ln(w
i) is the natural log (of hourly or annual, depending on data) earnings for the i
thindividual; S
iis years of schooling (as a continuous variable); X
iis labor market potential experience (estimated as age
i- S
i- 6); X
i2is potential experience-squared; and µ
iis a random disturbance term reflecting unobserved abilities. Therefore, β
1can be viewed as the average rate of return to years of schooling to wage employment. The list of control variables is kept deliberately small to avoid overcorrecting for factors that are correlated with years of schooling. This is also known as the “Mincerian” method (Mincer (1974)).
The earnings function method can be used to estimate returns at different schooling levels by converting the continuous years of schooling variable (S) into a series of dummy variables, say Dp, Ds and Dt (where p is primary schooling, s is secondary schooling and t is tertiary) to denote the fact that a person has achieved that level of schooling. The omitted level is people with no schooling and that dummy is not in the equation to avoid matrix singularity. The estimation equation in this case is of the form:
(2)
Ln(wi) = α + βpDp
i + βsDs
i+ β
tDt
i+ β
1X
i+ β
2X
2i+ μ
iAfter fitting this “extended earnings function” (using the above dummies instead of years of schooling in the earnings function), the private rate of return to different levels of schooling can be derived from the following formulas:
(3) r
p= (β
p)/(S
p) (4) r
s= (β
s- β
p)/(S
s- S
p)
(5) r
t= (β
t- β
s)/(S
t- S
s)
where S
p, S
sand S
tstand for the total number of years of schooling for each successive level. Care has to be taken regarding the foregone earnings of primary school-aged children. In the empirical analysis that follows we have assigned only three years of foregone earnings to this group, following tradition (see, for example, Psacharopoulos (1995)).
The costs incurred by the individual are her foregone earnings while studying, plus any tuition fees or incidental expenses incurred during schooling. Since schooling is mostly provided free by the state, at least at the basic education level, then in practice the only cost in a private rate of return calculation is the foregone earnings. The private benefits amount to what a more educated individual earns (after taxes), above a comparable group of individuals with less schooling. This more or less refers to adjacent levels of schooling; for example, tertiary versus secondary school graduates. Although convenient because it requires less data, this method is slightly inferior to the full discount method (Psacharopoulos (1995)); in fact, it assumes flat age-earnings profiles for different levels of schooling (Psacharopoulos and Layard (1979)).
From equation (1) the return to potential experience is given by:
(6)
β2 +2β3Xiwhich needs to be evaluated at a given value of X
i. For each sample we use the average years of potential experience as the evaluation point. It is important to stress that in the empirical part when we refer to potential experience we are referring to the estimates based on equation (1).
III. DATA
Our findings are the result of studying a large database constructed from existing national
household surveys through the use of the International Income Distribution Database
(I2D2) World Bank (2014), initially compiled by the World Bank’s World Development
Report unit over the period 2005-2011, and now under the World Bank’s Poverty and
Inequality Unit (since 2012). These data have been used in recent World Development
Reports and also in several Human Development Reports (see, for example, United
Nations Development Program (UNDP) (2011). For a detailed description of the sample,
see Montenegro and Hirn (2009). The database covers economies from developed and
developing regions, with no censoring of any kind in the sample selection. For most of
the economies it covers at least one point in time, and in many cases several points in
time. An enormous effort was undertaken in standardizing the variable definitions across
economies and time periods. The original data set includes 1,018 economies-years that
represent 160 economies. Not all of the economy-year data points are included in our
analysis because some surveys lack key variables. The basic specification (the one that
requires the minimum set of variables, and hence the one that has the most estimates) was
calculated for 819 economy-year points, and covers 139 economies.
The period of time under study is 1970 to 2013. However, less than 5 percent of observations are from before 1990, and only 25 percent before 2000; 75 percent of our estimates come from the period 2000-2013. Figure 1 presents the distribution of the sample by year. The most represented economies include Brazil (with 27 years of survey data), Costa Rica (21 years) and Argentina and Honduras (20 years each). On the other extreme, there are several economies with only one point in time, most of which are in Africa and Eastern Europe, or are small economies.
Looking at the distribution of the sample by region, from Figure 1 it is immediately obvious that the Latin America and Caribbean region has the largest representation in the sample, at 36 percent, or 291 data points, of all estimates. This is exclusively a result of data availability. High Income Economies follow at 28 percent, then Sub-Saharan Africa at 11 percent, with East Asia and the Pacific at 8 percent, Europe and Central Asia at 10 percent, South Asia at 5 percent, and finally the Middle East and North Africa at 2 percent.
Figure 1: Distribution of the sample
The sample definition used in this study includes only waged employees. Self-employed workers were eliminated because the database did not allow the separation of income into returns to labor and returns to capital. Family aid workers, apprentices and similar workers were also eliminated because their wages do not reflect market productivity.
East Asia &
Pacific Europe & 8%
Central Asia 10%
High Income Latin 28%
America &
Caribbean 36%
Middle East
& North Africa
2%
South Asia 5%
Saharan Sub- Africa
11%
By regions
The unemployed and people who work in voluntary services were also excluded. The same variables and sample definitions are used for all surveys, which gives us comparable economy-year results. For every survey, the top 0.5 percent of the sample was eliminated to avoid possible biases due to wage outliers. Like many other studies, school attainment is defined by the highest grade attended and completed; experience is defined as potential years of experience, where this is defined as age minus years of schooling minus six (as the typical school starting age). Both variables are measured in years. Annex Table 1 presents the list of economies and years used in this study, along with the returns to schooling (both as an aggregate variable and by levels).
IV. RESULTS
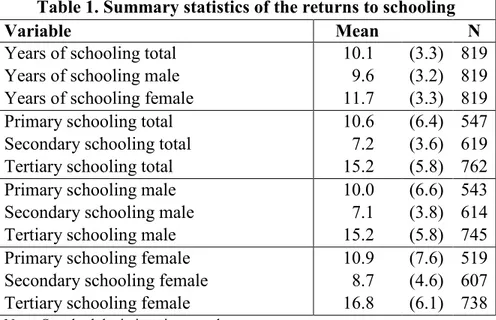
The basic earnings functions, equations (1) and (2), were applied to three different groups: (i) total sample, (ii) males and (iii) females (given the well-known differences in behavior for males and females in the labor market). As shown in the first three data rows of Table 1, the average rate of return to another year of schooling is 10 percent for the total sample. When considering only males, the rate of return to another year of schooling is 9.6 percent, and for females the rate of returns is much higher, at 11.7 percent. All of these estimates are based on 819 observations from 139 economies between 1970 and 2013. These results are similar to many other reviews of the literature.
Table 1. Summary statistics of the returns to schooling
Variable Mean N
Years of schooling total 10.1 (3.3) 819
Years of schooling male 9.6 (3.2) 819
Years of schooling female 11.7 (3.3) 819
Primary schooling total 10.6 (6.4) 547
Secondary schooling total 7.2 (3.6) 619 Tertiary schooling total 15.2 (5.8) 762
Primary schooling male 10.0 (6.6) 543
Secondary schooling male 7.1 (3.8) 614
Tertiary schooling male 15.2 (5.8) 745
Primary schooling female 10.9 (7.6) 519 Secondary schooling female 8.7 (4.6) 607 Tertiary schooling female 16.8 (6.1) 738
Note: Standard deviations in parentheses
The returns are also estimated for levels of schooling, shown in the second, third and fourth block of rows in Table 1. In particular, the second block presents the returns for the total sample, the third for males, and the fourth for females.
Table 1 clearly corroborates a fact already known in the literature: the returns to
education for females are higher than for males. This is true not only when considering
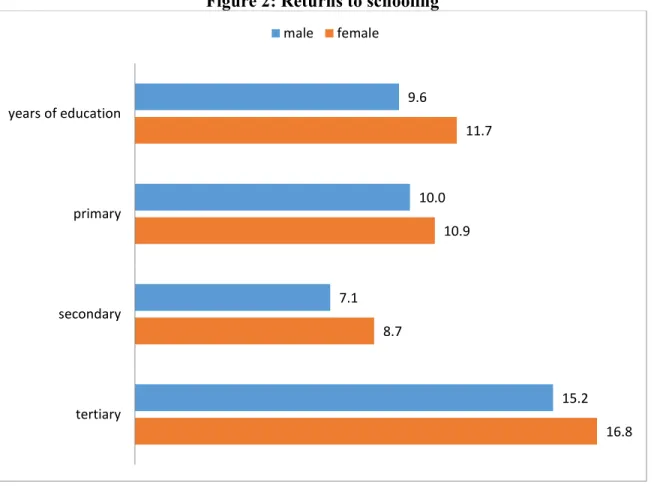
the returns to another year of schooling, but also for each one of the three levels of education examined here. To stress the results presented in Table 1, Figure 2 presents the averages returns to schooling (as a whole and by level). Figure 2 clearly shows the higher returns for women than for men. T-tests (not included here but available upon request) confirm that, in each and every case, the average returns are higher for females than for males (see Dougherty (2005) for an explanation as to why returns are higher for women). In all cases the results are statistically significant.
Figure 2: Returns to schooling
One important thing to stress is that the estimates presented in this paper were obtained after estimating the returns in a comparable fashion (that is, the definition of the dependent variable, the control variables, the sample definition, and the estimation method were the same and applied to all the surveys in our sample). The similarity of our results to the ones presented by Psacharopoulos and Patrinos (2004) shows just how stable these estimates really are. The rate of return to another year of schooling is also well-behaved and has a normal distribution (for the three samples considered here), as shown in Figure 3. The same well-behaved normal distribution also applies when considering the breakdown by gender.
When analyzing the returns to schooling by level, the returns are normally distributed for each level, but their distributions are different. As shown in Figure 3, the returns to
9.6
10.0
7.1
15.2 11.7
10.9
8.7
16.8 years of education
primary
secondary
tertiary
male female
primary and tertiary are less concentrated around the mean, while the returns to secondary are much more concentrated around the mean.
Figure 3: Returns to Schooling
0.05.1.15Density
0 10 20 30
Returns to schooling
Total sample
0.05.1.15.2Density
0 10 20 30
Returns to schooling
Male sample
0.05.1.15Density
0 10 20 30
Returns to schooling
Female sample
Figure 3 (cont’d): Returns to Schooling by Level
Considering only the latest available estimate for each economy and the returns to schooling when using the total sample, the five economies with the lowest rate of return are: Afghanistan, Armenia, Russian Federation, Guyana and Iraq. The five economies with the highest returns are: Rwanda, South Africa, Ethiopia, Namibia, and Burundi. It is interesting to note that among the five highest returns, all are from Africa. This is shown in Table 2, which also presents the economies with the lowest and highest returns by gender.
0.05.1.15Density
0 10 20 30 40 50
Returns to schooling level: Primary
Primary
0.05.1.15Density
0 10 20 30 40 50
Returns to schooling level: Secondary
Secondary
0.05.1.15Density
0 10 20 30 40 50
Returns to schooling level: Tertiary
Tertiary
Table 2: Highest and Lowest Returns to Schooling by Economy
Overall Male Female
Economy Return Economy Return Economy Return
Lowest
Afghanistan 1.6 Armenia 0.8 Afghanistan 3.0
Armenia 2.2 Afghanistan 1.3 Papua New Guinea 3.7 Russian Federation 2.6 Burkina Faso 2.8 Armenia 4.2
Guyana 3.3 Sierra Leone 3.1 Belarus 4.3
Iraq 3.4 Iraq 3.1 Cambodia 4.7
Highest
Rwanda 22.4 Rwanda 20.8 Rwanda 24.4
South Africa 21.1 South Africa 20.3 South Africa 23.3
Ethiopia 18.5 Namibia 19.3 Ethiopia 19.3
Namibia 18.3 China 17.7 Kenya 19.3
Burundi 17.3 Burundi 17.2 Tanzania 19.2
The returns to another year of schooling by world region are highest in Sub-Saharan Africa (12.4 percent), significantly above the global average (9.7 percent; see Table 3).
Returns are lowest in the Middle East/North Africa region (7.3 percent). Healthy returns are experienced in East Asia (9.4 percent) and Latin America (9.2 percent). There are below average returns in the Eastern European economies (7.4 percent) and in South Asia (7.7 percent).
Regarding the returns by level (see Table 3), the returns are, in general, higher in Sub- Saharan Africa with only one exception: when considering the primary school level for females, but it is still higher than the global average. There are low returns to primary schooling in high income economies, as would be expected. There are high returns to primary schooling in the Middle East and North Africa, especially for females; by contrast, the returns to tertiary are low in the Middle East and North Africa. Returns to primary schooling are surprisingly low in South Asia.
Table 3a. Average Returns to Schooling (latest period for each country) Average returns to
schooling Average years of schooling
Region total male female total male female N
High Income economies 10.0 9.5 11.1 12.9 12.7 13.1 33 East Asia & Pacific 9.4 9.2 10.1 10.4 10.2 10.7 13 Europe & Central Asia 7.4 6.9 9.4 12.4 12.2 12.7 20 Latin America &
Caribbean 9.2 8.8 10.7 10.1 9.5 10.9 23
Middle East & North
Africa 7.3 6.5 11.1 9.4 9.2 11.0 10
South Asia 7.7 6.9 10.2 6.5 6.5 6.4 7
Sub-Saharan Africa 12.4 11.3 14.5 8.0 8.1 8.1 33
All economies 9.7 9.1 11.4 10.4 10.2 10.8 139
Table 3b. Average returns to schooling by levels
Total Male Female
Region Primary Secondary Tertiary Primary Secondary Tertiary Primary Secondary Tertiary
High Income 4.9 6.6 11.1 3.3 7.5 10.7 7.2 5.2 12.3
East Asia 13.6 5.3 14.8 12.6 5.8 15.0 9.5 6.4 15.8
Europe/Central Asia 13.9 4.7 10.3 12.1 4.2 9.8 11.9 6.4 12.2
Latin America 7.8 5.4 15.9 7.9 5.3 15.7 8.7 6.5 17.4
Middle East/N.
Africa 16.0 4.5 10.5 12.7 4.3 10.2 21.4 7.4 13.5
South Asia 6.0 5.0 17.3 4.7 3.9 16.6 4.8 6.2 23.3
Sub-Saharan Africa 14.4 10.6 21.0 12.5 10.1 21.0 17.5 12.7 21.3
All economies 11.5 6.8 14.6 10.1 6.7 14.4 13.2 8.2 16.1
Figure 4. Average returns to schooling by region and gender (ordered from lowest total to highest total)
The returns to another year of schooling tend to decline as the average level of schooling rises in an economy. This demonstrates that schooling increases respond to price signals.
Therefore, as demand for education increases and the supply follows, the price tends to fall (see Figure 5).
Figure 5: Returns to Schooling and Average Years of Schooling
There is a positive correlation between the returns to schooling and the returns to experience. That is, the coefficients on schooling and experience are positively related (see Figure 6).
0510152025Returns to schooling
0 5 10 15 20
Average schooling
Total sample
0510152025Returns to schooling
0 5 10 15 20
Average schooling
Male
0102030Returns to schooling
0 5 10 15 20
Average schooling
Female
Figure 6: Correlation returns to schooling and returns to potential experience
There has been a tremendous increase in schooling attainment in recent decades. In 2010, the world population aged 15 and above was estimated to have an average of 8 years of schooling, having increased steadily from just over 5 years in 1980 (Barro and Wha Lee (2013)). As schooling in an economy increases, the returns to schooling tend to decrease, as show in Figure 7. Our new estimates show a sharp decline in returns during the past few decades, reflecting the sharp increase in schooling levels worldwide.
-20246Returns to experience
0 5 10 15 20 25
Return to schooling
Total sample
-20246Returns to experience
0 5 10 15 20 25
Return to schooling
Male sample
-202468Returns to experience
0 10 20 30
Return to schooling
Female sample
Figure 7: Returns Patterns over Time
The returns to schooling have declined significantly since the 1980s, when they were above 13 percent, to just over 9 percent in recent years (Table 4). This is due, at least partly, to the unprecedented expansion in schooling since the 1980s and, especially, since the late 1990s. Schooling has expanded by almost 50 percent since 1980. Over a 30 year period the returns to schooling have declined by 3.5 percentage points, or 0.1 percent a year. At the same time, schooling increased by more than 3 years, or 2 percent a year.
On average, another year of schooling leads to a reduction of the returns to schooling by one percentage point.
Table 4. Returns to Schooling and Average Years of Schooling by Period Returns to
Schooling
Average years of schooling
Number of surveys
1980-1985 13.3 6.6 12
1986-1990 12.7 8.1 23
1991-1995 11.0 8.0 58
1996-2000 10.1 8.8 109
2001-2005 9.9 10.1 228
2006-2010 9.6 10.9 238
2011-2013 10.0 11.6 149
0510152025Returns to schooling
1970 1980 1990 2000 2010
Year
Returns to schooling
Figure 8: Average returns to schooling and average mean of education over time
V. COMPARISON WITH ALTERNATIVE ESTIMATES
Other studies find the average rate of return to another year of schooling is 10 percent (see, for example, Psacharopoulos and Patrinos (2004)). Returns to schooling by level of national income show that the highest returns are recorded for low-income and middle- income economies. Average returns to schooling are found to be highest in the Latin America and Caribbean region and for the Sub-Saharan Africa region. Returns to schooling for Asia are at about the world average. The returns are lower in the high- income OECD economies. Average returns to schooling are lowest for the non-OECD European, Middle East/North Africa group of economies.
The only differences that we find are the relatively low returns to schooling for South
Asia and the relatively high returns in high-income economies, though these differences
may be due to economy coverage. Our data set and the compilation of studies by
Psacharopoulos and Patrinos (2004) and Psacharopoulos and Patrinos (2014) show a
decline in the rates of return over time. Overall, the average returns estimated by
Psacharopoulos and Patrinos (2004) and Psacharopoulos and Patrinos (2014) are slightly
lower. This is most likely due to additional control variables that are being used in the
studies that Psacharopoulos and Patrinos (2004) and Psacharopoulos and Patrinos (2014) review. Also, Psacharopoulos and Patrinos (2004) and Psacharopoulos and Patrinos (2014) cover, in general, a period prior to the estimates derived here.
Figure 9: Returns to Schooling Estimates, all data points
Source: Our estimates and the reviews of Psacharopoulos and Patrinos (2004).
Comparing these new, consistent estimates with Psacharopoulos and Patrinos (2004) and Psacharopoulos and Patrinos (2014), we estimate, in terms of latest year available, for 139 economies, an average rate of return of 10.0 percent (with a standard deviation of 3.4). Psacharopoulos and Patrinos (2004) and Psacharopoulos and Patrinos (2014), for 91 economies, estimate a rate of return of 9.4 percent (with a standard deviation of 3.9).
Our new estimates contain 43 more economies. Together, the two compilations cover 149 economies (76 percent of the 193 economies recognized by the United Nations). In terms of world population in 2010, the estimates reviewed in Psacharopoulos and Patrinos (2004) and Psacharopoulos and Patrinos (2014) cover 84 percent of the globe.
This new study covers 92 percent of the world’s population. Combined, the two studies cover more than 95 percent of the global population. In Figure 9 we plot all estimates, demonstrating the consistency and stability of the estimates.
0102030Returns to schooling
1950 1960 1970 1980 1990 2000 2010
Year
This paper Fitted values
Psararopoulos and Patrinos Fitted values
Returns to schooling
VI. LIMITATIONS
This study focuses on the returns to schooling as measured by labor market earnings.
While a useful measure, it does mean that we do not include self-employed or informal sector workers because of methodological difficulties. This is not a problem in more advanced and growing economies, but it is a limitation in countries where a substantial proportion of the population is in the informal sector. Individual country work is needed to fill that gap (see, for example, Garcia-Mainar and Montuenga-Gomez (2005).
Another potential limitation is endogeneity. The results reported here are correlations from earnings functions estimated using Ordinary Least Squares. To the extent that there are other factors that affect the schooling decision then there could be bias. To address the potential bias researchers have instrumented schooling or tried other techniques. The results reported confirm the estimates obtained here; in many cases the returns estimated using an instrumental variables (IV), which correspond to sub-populations and are therefore Local Average Treatment Effects (LATE), are typically higher than the average OLS estimate in the same country (Ichino and Winter-Ebmer (1999); Card (1995); Duflo (2001); Patrinos and Sakellariou (2006)). Therefore, we do not believe that the correlations reported here are biased, and are certainly not biased upward.
The results reported here are private returns. They are based on what the individual will earn and the only costs considered are those incurred for attending school – fees, tuition and so on, as well as the indirect or opportunity cost of schooling in the form of foregone earnings. These estimates can help explain individual behavior about schooling decisions and can be used by policy makers to design school finance policies, especially for tertiary education. But for most policy decisions, policy makers would need to know the social returns to schooling. First, this would require full social returns estimates of social benefits (externalities and non-market effects), a difficult task for a single country (but see Acemoglu and Angrist (2001); Wolfe and Haveman (2002)), almost impossible for the global estimates we provide here. Second, one would need full social costs, in the form of what the government provides in terms of the supply of schooling. For narrow returns, one can use the private benefits and the social costs. This is something our future research will address.
VII. CONCLUSION
Our new data set of comparable estimates of the returns to schooling and to potential experience covers 139 economies. We use 819 harmonized household surveys to provide the estimates that cover the period from 1980 to 2013. This compilation of comparable estimates addresses several issues in the literature, such as: (i) the definition of the dependent variable—which we keep consistent throughout; (ii) the variables used as controls – we use the basic Mincerian specification; (iii) sample definitions – we limit the analysis to the same samples throughout in terms of age, employment status and earnings;
and (iv) estimation method – which we apply consistently to every survey.
The results show: (i) that the returns to schooling are more concentrated around their respective means than previously thought; (ii) the basic Mincerian model used is more stable than one may have expected; (iii) the returns to schooling are higher for women than for men; (iv) returns to schooling and to experience are strongly and positively associated; (v) both returns show a decreasing pattern over time; and (vi) the returns to tertiary education are the highest and to secondary education the lowest.
When we combine our new estimates with the Psacharopoulos and Patrinos (2004) review, we mostly confirm previous findings and stylized facts. The combination also allows us to create a time-trend dating back to the 1960s, confirming that returns to schooling decline over time.
This comparable data set on returns to schooling and to potential experience should be helpful empirical work in a variety of fields. Our comparable estimates provide a reasonable proxy for the value of human capital for a broad group of economies. This new data set is useful for studying the links across economies between schooling attainment and the returns to schooling. Moreover, it can be used to examine economic growth, competitiveness, inequality, democracy, institutions and political freedom.
Given the high returns to tertiary education, an immediate concern for policy makers is to consider the large implications. While our estimates are for private returns to schooling, the high returns to tertiary education will fuel demand for post-secondary education.
Governments will need to consider the appropriate policy for financing tertiary education.
Annex Table 1: Returns to Schooling by Economy and Period
Economy Year A B C D E F G H I J K
Afghanistan 2007 1.6 2.9 4.1 3.5 3.6
Albania 2005 4.5 3.2 14.1 1.2 7.4 17.4 1.3 7.2 3.5 11.2 Argentina 1992 7.8 3.8 4.3 12.7 1.2 5 14.4 2.4 10.5 Argentina 1993 8.3 3.8 2.6 4.6 11.9 1.3 4.8 12.6 7.4 4.3 10.3 Argentina 1994 8.6 3.7 5.1 10 9.2 5.2 10.1 5.2 9.8 Argentina 1995 9 3.8 8.6 5.1 14.6 10.8 5.2 16.4 3.6 5.3 12.3 Argentina 1996 7.7 4.2 3.9 5.8 12.4 4.5 5.9 15.3 2.3 5.7 9.4
Argentina 1997 8.4 3.8 2.9 13.2 3.3 14.8 1.9 11.6
Argentina 1998 10.4 3.8 7.4 5.7 15.5 12.8 5.6 16.9 0.5 6.1 14.7 Argentina 1999 9.7 3.8 5.3 4.8 15.1 14.2 5 15.7 4.7 15 Argentina 2000 10.5 3.9 5.3 5.4 15.9 9.6 5.6 16.9 1.9 5.3 15.4 Argentina 2001 10.8 3.9 4.4 5.7 15.6 1.9 5.7 16 8.4 5.7 15.6 Argentina 2002 10.8 3.9 3.4 5.1 17.2 7 5.5 18.6 4.6 16.4 Argentina 2003 9.9 4 10.5 5.1 15.8 8.1 5.4 15.8 12.5 4.7 16.2 Argentina 2004 9.9 3.8 0.8 4.9 14.6 4.9 14.6 2.6 4.9 15.2 Argentina 2005 10.2 3.8 6.1 5 15.1 9.7 5.7 14.6 4.2 16.3 Argentina 2006 10.1 3.8 7.2 5.4 14.7 3.7 5.6 13.6 10.7 5.5 16.9 Argentina 2007 10 3.8 3.8 5.6 14.8 5.2 5.8 14.7 3.1 5.6 15.8 Argentina 2008 9.8 3.8 8.1 5.4 13.5 10 5 12.9 5.3 6.5 15.2 Argentina 2009 9.6 3.7 3.7 5.3 13.4 6.7 5.2 12.8 5.7 15 Argentina 2010 9.4 3.7 6 4.3 14 13.5 4.4 13.3 4.4 15.8 Argentina 2012 8.8 3.6 3.7 4.7 12 0 4.7 11.5 14.7 4.8 13.4
Armenia 1999 2.2 3.3 4.6 2.9 6.8
Australia 2001 9.8 2.1 12.2 11.3 10.2 12.9
Australia 2002 10.2 2 0.6 12.2 14.7 9.6 8.3
Australia 2003 11.1 2 1.2 13.5 7.9 11.3 2.6
Australia 2004 12.7 1.9 14.9 4.6 14.1 14.8
Australia 2005 11.8 1.8 4.9 13.7 3.5 11.3
Australia 2006 11.6 1.8 13.4 7 13.1 8.4
Australia 2007 11.3 1.7 13.3 11.9 12.6 12.6
Australia 2008 12.6 1.7 10 14.5 36.4 12.6 12.1 Australia 2009 12.7 1.7 5.9 15.1 24.2 14.7 18.5
Australia 2010 14.1 1.6 30.8 14.6 35.1 14.1 16.3
Austria 2004 9.4 2.3 8.4 8.1 10.3
Austria 2005 10.8 2.1 8.5 8 10.2
Austria 2006 11.6 2.1 9.4 8.8 10.7
Austria 2007 11.1 2.1 9.6 9.2 11.3
Austria 2008 10.7 2.1 8.6 8 10.5
Austria 2009 11.1 2.1 9.3 8.4 10.8
Austria 2010 9.1 2.3 8.7 8.4 9.8
Austria 2011 10.2 2.2 9 8.2 10.3
Austria 2012 9.9 2.2 8.8 9.1 9.2
Azerbaijan 1995 7.2 2.9 19.8 2.2 8.1 28.2 7.8 11 4.2 7.5 Bangladesh 2000 5.9 4.4 8.6 2.6 13.2 6.4 2.1 12.5 9 1.7 29.1 Bangladesh 2005 7.1 5.4 8.1 5 16 5.8 4.2 14.4 8.8 8.1 23
Belarus 1998 3.7 1
Belgium 2004 5.3 3.5 1.7 3.4 7.5 3.7 6.8 6.4 3.4 10.4
Economy Year A B C D E F G H I J K
Belgium 2006 5.6 3 2.7 7.2 1.3 3.8 6.2 3.2 9.4
Belgium 2007 6.3 2.8 7.8 7 10.6
Belgium 2008 6.2 3 7.5 4.1 7.9 0.6 3.6 7.1 11.6 5 10.5 Belgium 2009 5.8 3.2 11.2 2.2 7.8 13.9 2.5 6.9 8.7 1.3 10.5 Belgium 2010 6.3 3.2 5.8 3.8 8.3 14 3.8 7.3 3.4 10.8 Belgium 2011 6.4 3 7.1 3.4 8.1 2.2 3.1 7.6 17.1 4 10.2 Belize 1993 9.4 3.4 1.6 7.7 13.2 0.4 7.6 12.6 5.4 8.7 13.9 Belize 1994 10.5 3.4 13.2 6.7 13.1 11 5.4 13.5 21.3 10.4 12.3 Belize 1996 9.1 3.4 7.2 6.1 12.1 7.8 5.3 10.1 5.5 8.6 13.6 Belize 1997 10.8 3.4 12 6.6 15.4 9.7 6.2 15 29.5 7.6 15.7 Belize 1998 10.6 3.4 5.5 7.9 14.5 6 7.2 14.1 5.1 10 15 Belize 1999 10.4 3.3 9.5 6.5 16 10.8 6 14.6 4.3 8.1 17.1 Bolivia 1992 11.7 4.2 14.7 7.2 17 9.5 4.3 16.7 10 10.5 20.3 Bolivia 1993 12.4 4.7 16.3 7.9 20.1 5.9 4.6 20.2 12.7 11.2 22.9 Bolivia 1997 11.4 4.8 13 7.2 20.2 8 4.6 19.9 7.7 12.9 21.7 Bolivia 1999 10.9 4.7 20.8 5.5 18.2 8.4 2.7 19.1 11 12.1 18.4 Bolivia 2000 11.5 4.8 11.9 5.6 22.5 10.8 3.1 23.4 7.2 9.6 22.2 Bolivia 2001 10.4 4.8 6.8 5 19.8 6.2 4.3 19.6 2.6 6.1 21.3 Bolivia 2002 10.3 4.8 4.7 4.8 21.9 8.1 3.8 20.8 6.7 24.5 Bolivia 2003 10.5 4.7 9.6 4.2 22.4 7 3.9 21.7 6.9 4.6 25 Bolivia 2005 11.6 4.8 8.9 6.3 21.3 4.2 5 21.8 7.8 8.8 21.7 Bolivia 2007 10.5 4.7 17.1 5.1 18.8 6.3 4.8 17.8 21 4.5 22.2 Bolivia 2008 8.5 4.6 13.7 2.7 16.9 9.1 1.8 16.4 11.1 4.6 19 Bolivia 2009 7 4.7 8.2 1.8 14.6 0.6 13.3 6.9 3.7 18 Bolivia 2011 6.8 4.8 7.9 2.4 13.3 1.9 1.3 12.2 8.7 4.8 17 Bolivia 2012 7.3 4.7 8.6 3.1 13.6 3.2 1.9 11.2 4.9 5.5 19 Bosnia and Herzegovina 2001 7.9 2.7 7.3 3.1 11.4 2.5 9.4 6.3 4.9 15.4 Brazil 1981 15.3 4.5 21 15 16.8 22 15.3 16.1 19.9 17.1 17.5 Brazil 1982 17.3 4.3 22.4 15.6 20.4 23.4 15.9 21.4 21.9 17.4 19.9 Brazil 1983 16.8 4.4 19.8 15.6 21 20.6 15.9 21.4 19.4 17.5 20.9 Brazil 1984 17.3 4.4 20.9 15.9 21.5 21.3 15.9 21.8 21.2 18.6 21.7 Brazil 1985 17.2 4.3 21.7 15.7 20.7 22.4 15.6 20.6 21.5 18.6 21.6 Brazil 1986 15.6 4.4 18.8 13.3 21.7 19.8 13.9 21.5 18.1 14.8 22.5 Brazil 1987 16.7 4.4 21.6 14.5 21.9 22.6 14.8 22.7 20.9 16.3 21.9 Brazil 1988 17.5 4.5 24.1 14.9 22.5 26 15.4 23.2 21.4 16.7 22.6 Brazil 1989 16.8 4.4 23.1 14 22.5 24.7 14.7 23.3 20.9 15.6 22.6 Brazil 1990 16.9 4.5 23.2 14.4 22.6 25.3 15.1 22.1 20.5 15.5 23.9 Brazil 1993 15.9 4.4 19.9 13.8 20.1 21.7 14.3 21.4 17.8 14.9 20.3 Brazil 1995 15.1 4.4 18.5 12.4 21.4 21 13.4 22.9 14.6 12.7 21.5 Brazil 1996 14.5 4.4 18 11.7 20.9 20.8 12.9 21.5 13.8 11.7 21.8 Brazil 1997 14.8 4.4 17.3 12 21 19.8 13 21.5 13.7 12.2 21.7 Brazil 1998 14.9 4.4 16.7 11.9 22 19.4 12.8 23.3 12.8 12.2 22.3 Brazil 1999 14.7 4.4 15.8 11.5 21.8 18.5 12.3 22.5 12.5 12.1 22.4 Brazil 2001 14.3 4.4 15.9 10.8 21.8 17.9 11.9 22.9 13.5 10.6 22.3 Brazil 2002 14.5 4.4 14.8 10.7 22.3 17.1 11.8 23.3 12 10.5 23 Brazil 2003 13.9 4.4 14.1 10 21.8 16.1 11.1 22.7 12.3 9.8 22.5 Brazil 2004 13.5 4.3 13.1 9.6 21.4 15 10.6 22.2 11.5 9.6 22.1
Economy Year A B C D E F G H I J K Brazil 2007 11.5 4.4 11.1 8.7 18.4 12.8 9.6 18.8 9.8 8.4 19.4 Brazil 2008 11.4 4.3 10.2 7.9 18.3 12.8 8.8 18.4 7.2 7.8 19.6 Brazil 2009 11.3 4.3 9.8 7.8 18 11.9 8.7 18.3 7.6 7.5 19.2 Brazil 2011 10.1 4.3 8.1 6.6 17.7 10.9 7.6 18.3 3.9 6.2 18.7 Brazil 2012 10.5 4.2 7.9 6.3 17.3 10.3 7.2 18 4.9 6.1 18 Bulgaria 2001 3.9 4.4 13.6 3.2 5 5.1 3.5 4.6 57.2 4.1 5.1 Bulgaria 2003 7.8 2.9 0.7 5 7.7 5.2 8.5 3.1 5.3 8.3 Bulgaria 2007 6.5 2.5 5.9 4.3 7.9 6.8 4.2 8.2 13.9 4.3 9.5 Bulgaria 2008 8 2.6 2.1 8.3 9.2 0.3 8.2 9.1 2.5 8.3 11.3
Bulgaria 2009 7.8 2.4 9 8.6 8.9 9.4 9.7 11.2
Bulgaria 2010 8.6 2.5 10.3 9.5 10.5 10 10.7 11.9
Bulgaria 2011 9.7 2.5 9.1 7.2 11.5 9.6 12.1 30.3 4.6 13.9 Bulgaria 2012 7.8 2.5 12 5.8 9.1 0.3 7.3 9.9 28.2 3.9 11.5 Burkina Faso 1994 15.7 5.2 39.1 10.4 13.9 36.5 10.5 13.8 60.1 8.2 15.8 Burkina Faso 1998 13.3 5.3 15.6 13.2 21.3 16.5 11.9 21.3 16.5 19.2 20.9 Burkina Faso 2003 12.2 5.7 12 12.2 19.6 12.2 10.9 27.6 12.8 17.6 12.5
Burkina Faso 2009 7.4 5.3 17.8 19.6 20.2 12.9
Burundi 1998 17.3 5.2 12.9 21.3 21.8 9.7 21.5 23.4 23.7 19.8 19.2 Cambodia 1997 6.4 3.7 15.8 3.6 12.1 3.8 25.1 2.8 Cambodia 2004 5.3 4.3 9.6 3.5 14.1 5 3.1 14 11.8 4 16.6 Cambodia 2007 5.6 4.3 0.9 3.5 15 2.5 15.7 3.4 4.7 14.2
Cambodia 2008 4.3 4.4 2.5 20.7 1 20.8 4 20.5
Cameroon 2001 14.1 4.3 16.9 12.1 23.2 15.5 12.5 21.2 22.4 12.8 28.2 Cameroon 2007 11.6 4.3 11.1 8.9 21.7 9.9 9.3 21 24.1 10.1 23.4
Canada 1981 9.2 2.7 8.6 6.8 10
Canada 1991 11.2 2.5 9.8 8.1 11.2
Canada 2001 12.1 2.4 10.1 8.2 12.4
Chad 2003 7.2 5.7 1.1 7.4 22.7 1.4 5.6 24.6 4.7 16.9 8.4 Chile 1987 12.7 4.3 7.6 8.8 22.6 8.6 8.9 25.5 7 8.9 20.8 Chile 1990 11 4.2 7.3 7.8 17.1 8.6 8 19.7 7 8.1 16.2 Chile 1992 8 4 6.2 7.2 10.5 7.2 7.4 12 2.7 6.8 10.2 Chile 1994 11.7 4.1 8.1 7.9 17.9 9.3 8.4 20.5 5.2 7.5 16.5 Chile 1996 12.8 4 6.5 8.7 18.7 8 9.1 20.5 1.3 8.8 18 Chile 1998 13 4 6.3 8.5 18.9 6.4 8.7 20.3 5.5 8.5 18.9 Chile 2000 13.2 3.9 4.7 7.5 19.8 4.7 8.2 20.7 4 6.9 19.9 Chile 2003 13.2 3.8 6.8 7.2 19.3 7.9 7.5 19.8 3.7 7.4 19.9 Chile 2006 12.4 3.7 4.2 6.2 17.5 4.6 6.8 17.5 3.3 6.1 18.9
Chile 2009 11.9 3.7 5.9 17.6 1.5 6.3 18.1 6 18.6
Chile 2011 12.3 3.6 3 5.6 17.6 2.6 5.7 17.8 4.1 6 18.8 China 2002 16.6 3.2 9.3 20.9 0.1 8.9 23.3 10.3 16.8 Colombia 2001 11.5 4.5 5.2 6.3 24.2 4.1 6.1 24.3 10.3 7 24.1 Colombia 2002 12 4.6 6.4 6.6 25.5 5.2 6.4 25.3 9.7 7.2 25.7 Colombia 2003 11.4 4.6 4.4 6.3 23.8 4.2 5.7 23.8 7.1 7.7 24 Colombia 2004 11.3 4.6 4 6.2 22.8 3 6.1 22.7 8.1 6.9 23.2 Colombia 2005 11.3 4.6 4.5 6 23 3.7 5.9 22.7 7.7 6.6 23.6 Colombia 2006 11.4 4.7 7 6.2 22.5 7.2 5.9 22.6 8.9 7.4 23.1 Colombia 2007 11.7 4.7 6.1 6.7 21.9 5.9 6.7 21.7 10.2 7.7 22.9
Economy Year A B C D E F G H I J K Colombia 2010 11 4.6 4.5 5.3 20.3 4.4 5.3 20.1 7.6 6.1 21.6 Colombia 2011 11 4.6 6.3 5.3 19.7 6.7 5.4 18.9 7.9 6.1 21.5 Colombia 2012 11 4.6 6 5.3 19.6 5.3 5.7 19.3 12.5 5.3 21.4 Comoros 2004 6.5 5.9 2.2 5.4 17.2 5.8 15.4 9.9 7 20.3 Congo, Dem. Rep. 2005 6.3 4.1 9 1.7 21.5 2.5 1.9 20.1 24.7 0.9 32.8 Costa Rica 1989 10.6 4 7.9 7.3 16 8.6 6.7 16.5 10.9 9.6 16.2 Costa Rica 1990 10.4 4 8.7 6.8 17 9.6 6.5 16.7 5.8 8.5 18.4 Costa Rica 1991 10.4 3.9 7 6.1 18.5 5.7 5.6 17 14.6 7.8 21.1 Costa Rica 1992 10 4 5 5.8 17.8 4.7 5.8 16.5 6.7 6.4 20.2 Costa Rica 1993 10.1 4.1 10.7 5.4 18 10.1 4.9 17.3 12.5 6.8 19.5 Costa Rica 1994 10.1 4 5.9 6.1 17.4 7.2 6.2 16.6 4.1 6.7 19.2 Costa Rica 1995 10.2 4 7.8 5.4 18 8.1 5.5 17.8 9.3 6 19.2 Costa Rica 1996 10.3 4 9.3 6.1 17.7 8.4 6 18 16.2 6.9 18.2 Costa Rica 1997 10.6 4 7.6 5.5 19.2 8.2 5.4 18.4 7.8 6.6 20.6 Costa Rica 1998 10 4.1 4.6 5.5 17.9 5 5.3 17.5 6.2 6.5 19.1 Costa Rica 1999 9.6 4.1 5.8 4.9 17.8 4.6 5 17.7 8.2 5.4 19.1 Costa Rica 2000 9.3 4.2 5.2 4.8 17.4 6.3 4.8 18.1 2.8 5.5 17.5 Costa Rica 2001 10.5 4.3 5.6 6 18.2 6.9 6 17.7 3.5 6.8 19.5 Costa Rica 2002 10.7 4.2 8.2 4.9 20 8.8 5.1 20.2 8.8 5.3 20.6 Costa Rica 2003 10.6 4.2 6.6 5.1 19.5 6.6 5.1 19.1 10.1 6.1 20.8 Costa Rica 2004 10.5 4.2 8.9 5 19.3 10.2 5 19.6 5.9 6 19.7 Costa Rica 2005 10.3 4.2 4 4.3 19.8 4.7 4.7 19 3.6 4.3 21.6 Costa Rica 2006 10.3 4.3 4.3 4.9 18.6 5.3 5 18.4 3.2 5.8 20 Costa Rica 2007 10.1 4.2 5.2 4.3 19.3 6.8 4.5 19.1 2.5 4.7 20.4 Costa Rica 2008 10.1 4.2 4.4 4.2 19.2 6.9 4.3 18.9 5.1 20.4 Costa Rica 2009 10.7 4.3 4.3 4.8 19.5 5.8 4.9 18.5 2 5.7 21.7
Croatia 2004 9.4 2.5 10.1 9.8 5.5
Croatia 2011 10.8 2 11.9 9.2 15.2
Croatia 2012 11.6 2 13.1 11.7 15.3
Czech Republic 2005 11.3 1.7 10.7 11.1
Czech Republic 2006 11.7 1.7 11.4 11.4
Czech Republic 2007 11.6 1.7 Czech Republic 2008 9.8 1.7
Czech Republic 2009 9.4 1.7 9 8.9 10
Czech Republic 2010 9.6 1.7 9.7 10.1
Czech Republic 2011 10.7 1.7
Czech Republic 2012 10.5 1.8 10.2 10.7
Côte d'Ivoire 2002 13.2 5.7 12.1 12.9 28.7 13.3 10.9 27.1 8.6 16.4 32.4 Côte d'Ivoire 2008 11.3 6.5 12.6 12.1 24.9 7.7 10.9 21.9 19.4 14.1 31
Denmark 2004 7.3 2.6 8.4 9.3 8.6
Denmark 2005 7.6 2.6 8.5 8.9 9.4
Denmark 2006 6.6 2.6 7.1 8.3 7.6
Denmark 2007 7.1 2.6 8.2 8.5 9.5
Denmark 2008 6.2 2.6 6.8 7.3 7.7
Denmark 2009 6.4 2.6 7.1 8.2
Denmark 2010 7.1 2.6 7.7 7.7
Denmark 2011 7.9 2.6 9.8 12.7 8.4
Economy Year A B C D E F G H I J K Dominican Republic 1996 8.5 4.8 12 4.7 16 12.6 3.7 17.1 12.6 7.5 15.1 Dominican Republic 1997 7.3 5 6.7 5.5 13 7.4 5.1 13.3 4.9 6.7 13.6 Dominican Republic 2000 9.8 4.8 8 5.4 18.6 10.8 5.1 18.8 3.6 6.1 19.5 Dominican Republic 2001 9.5 4.8 9.5 5.6 18.1 10.5 5.2 19 7.7 7.2 18.6 Dominican Republic 2002 9.7 4.8 11.2 6.2 16.4 12.6 5.3 16.8 10.4 8.4 16.7 Dominican Republic 2003 10.1 4.8 12.9 5.3 18.1 13.8 5.2 18.7 10.7 6 18.8 Dominican Republic 2004 9.5 4.7 10.6 5.2 16.3 12.3 5.7 15.5 7.4 4.9 19.2 Dominican Republic 2005 9.5 4.7 8.7 5.2 17.3 7.1 4.9 15.8 10.3 6 20.3 Dominican Republic 2006 9.6 4.8 8.4 5.3 16.7 7.2 5.1 16.7 11.1 6 18.3 Dominican Republic 2007 9.5 4.6 8.9 5.8 15.8 10.7 5.5 15.7 5.4 6.3 17.6 Dominican Republic 2008 9.7 4.7 8.3 4.5 17.8 9 4.4 18.3 7 4.9 18.5 Dominican Republic 2009 9.8 4.6 10.1 5.4 16.9 10.9 5.6 16 9.9 5.4 19.2 Dominican Republic 2010 9.5 4.6 7.1 5 17.5 7.9 5.5 15.8 7.4 4.2 21.1 Dominican Republic 2011 9.4 4.5 8.3 4.9 15.8 10.9 4.6 15.2 6.2 5.8 18.1 Ecuador 1994 7.8 4.7 6.4 4.3 16.7 7.1 4.7 16.8 3.5 4.9 18.5 Ecuador 1995 9.3 4.5 10.6 2.8 6.7 10 2.3 6.1 8.4 2.5 7.3 Ecuador 1995 9.4 4.8 14.7 6.7 15.3 13.1 6 16.2 13.6 8.9 15.4 Ecuador 1998 9.6 4.6 7.9 5.1 19 6 4.7 18.2 8 7.2 21.5 Ecuador 1998 10.9 4.6 7.3 4.4 7.1 8.7 3.1 6.1 3.9 5.8 8.3 Ecuador 1999 9.7 4.7 7.7 4.5 19.2 5.7 4.2 21.6 10.5 5.5 16.4 Ecuador 2000 10.1 4.9 8.6 7.3 18.2 7.1 6.3 18.8 8.5 11 18.1 Ecuador 2003 8.4 4.8 4.7 5 16.5 4.3 4.4 17.9 3.2 7.3 15.9 Ecuador 2004 8.3 4.9 7.5 4.8 15.7 7 4.7 16.8 8.1 5.8 15.3 Ecuador 2005 8.7 4.8 8.6 5.1 16.8 7.4 5 17.6 11.8 5.7 17.1 Ecuador 2006 8.5 4.7 8.2 4.9 16 6.6 4.8 16.6 12 5.7 16.8 Ecuador 2006 13.4 4.7 16.3 10 21 16.5 10.7 21.4 16.5 8.3 21.6 Ecuador 2007 8.4 4.8 7.7 5 15.7 5.5 4.9 16.1 13.2 6 16.5 Ecuador 2008 7.9 4.8 5.4 4.4 15.4 4.9 4.5 15.3 6 4.9 17.2 Ecuador 2009 8.1 4.7 3.5 4.6 15.1 2.6 4.3 15.8 5.3 6.3 15.5 Ecuador 2010 7.8 4.8 7 4.2 14.4 5.6 4 15 10.2 5.2 14.6 Ecuador 2011 7.4 4.7 7.5 5 12.3 7.1 5 12.3 8 5.2 13.3 Ecuador 2012 7.2 4.7 4.6 4.5 12.3 2.2 4.9 11.9 12.3 4 14.3 El Salvador 1991 9.6 5.2 10.7 10.1 14.9 9 8.1 14.9 11.6 15.7 15.1 El Salvador 1995 9.9 5.3 12.6 10.1 14.8 12.6 8.3 14.4 13 15 15.7 El Salvador 1996 10.2 5.4 13.4 10 16.4 11.7 8.3 16.6 16.9 14.7 16.8 El Salvador 1998 10.1 4.9 13.6 9.3 15 13 9 14.2 13.5 10.7 16.1 El Salvador 1999 10.2 5 13.1 8.6 16.6 13.2 7.6 16.8 12.2 10.9 16.6 El Salvador 2000 10.4 5 13.2 8.5 16.7 12.9 8.2 16 14.5 9.6 17.8 El Salvador 2001 9.7 5 11 7.3 18.9 12.2 6.7 18.6 7.9 8.6 19.4 El Salvador 2002 9.8 4.9 11.8 7.8 16.7 12.2 7.2 16.3 10.9 9.4 17.4 El Salvador 2003 9 4.9 8.4 6.9 17.6 8.4 6.3 17.3 8.8 8.3 18.1 El Salvador 2004 8.7 4.9 8.6 6.2 17.7 8.2 6.1 16.2 9.4 6.9 19.7 El Salvador 2005 9.1 5.1 9.9 7.4 15.2 9.9 7.4 14.8 9.5 8 16.1 El Salvador 2006 7.6 5 7 5.6 15.5 5.9 6.1 13.6 8.9 5.4 17.8 El Salvador 2007 8.4 4.9 7.7 6 16.6 8.4 6 15.7 6.1 6.8 18 El Salvador 2008 8.6 4.7 4.4 10.2 4.6 9.4 3.7 11.8 El Salvador 2009 9.3 4.9 8 6.4 18.8 7.1 6.4 17.1 9.5 7 21
Economy Year A B C D E F G H I J K Estonia 2006 6.8 2.3 4.5 5.6 6.4 7.1 14.2 2.3 8.6 Estonia 2007 5.9 2.3 7.1 3.6 4.7 10.6 5.5 6.4 7.3
Estonia 2008 5.7 2.3 1.5 6.1 4.2 7 10
Estonia 2009 5.7 2.3 0.8 5.8 1.2 7 9.1
Estonia 2010 6.9 2.3 3.7 7.3 6.5 8.4 10.4
Estonia 2011 7.6 2.3 7.2 7.9 8.7 10.2
Estonia 2012 6.5 2.3 6.4 7.3 10.7
Ethiopia 2005 18.5 5.4 32.7 16.2 17 31.7 13.6 16.9 25.9 20.7 16.8
Finland 2004 7.6 2.5
Finland 2005 8.6 2.5
Finland 2006 8.1 2.5
Finland 2007 7.4 2.9 10.8 11.6 12.1
Finland 2008 9.3 2.5
Finland 2009 8.3 2.5
Finland 2010 7.7 2.4
Finland 2011 7.8 2.4
Finland 2012 7.9 2.4
France 2004 8.5 3.2 10.9 3.9 12.9 5.5 3.4 12.4 24.4 4.4 15.1 France 2005 8.4 3.2 5.2 4 12.6 7.1 3.4 12.2 8.5 4.9 14.7 France 2006 8 3.2 2.7 4 11.8 7.4 1.9 11.6 4.3 6 13.7 France 2007 8.3 3.1 4.7 4.7 11.5 7.1 3.7 11 5.7 5.9 13.9 France 2008 8.7 3.1 4.1 5 12 8.5 3.4 11.2 3.9 6 14.5 France 2009 9.2 3.1 3 5.1 12.7 3.2 3.9 12.3 6.7 5.7 15 France 2010 9.1 3.1 4.5 4.5 12.5 10.2 2.7 11.3 4.5 6.5 15.2 France 2011 9.1 2.9 2.2 5.3 12 0.2 3.7 11.9 12.7 7.1 13.6
France 2012 9 2.9 3.8 12.2 2.5 11.8 1.3 5.8 14.5
Gabon 2005 13.5 4.3 5.7 10.6 25.5 5 8.6 23.5 9.4 14.5 29.3 Gambia, The 1998 9.1 5.3 9.4 8.6 18.1 9.6 5.3 22.7 1.5 19.4 4.5
Georgia 2010 7.7 2.8 11.5 13.1 8.1
Germany 2005 11 2.3 10 9.7 10.3
Germany 2006 13.2 2.3 12.1 10.8 13.6
Germany 2007 14 2.3 13.3 11.7 14
Germany 2008 14.2 2.4 13.7 12.1 14.7
Germany 2009 15 2.3 14.5 11.9 15.3
Germany 2010 15.2 2.4 14.8 13 15.4
Germany 2011 14.3 2.3 14.3 12.2 15.3
Germany 2012 14.5 2.3 14.3 12.8 14.8
Ghana 1991 5.3 4.8 1.4 7.9 12.2 6.7 12.3 6.3 11.4 12.8 Ghana 2005 10.3 4.6 4.7 7.8 23.2 6.8 22 11.6 8.4 27.8 Ghana 2012 12.5 4.6 2.7 8.8 28.7 6.5 26.6 2.3 11 34.8
Greece 2004 7 3.4 7.8 7 10.2
Greece 2005 7.5 3.4 9.4 8.5 12.3
Greece 2006 7.3 3.4 8.8 9.1 10.7
Greece 2007 7.5 3.4 8.9 8.5 11.4
Greece 2008 7.6 3.4 5.2 9.2 5.5 8.7 4.6 11.8
Greece 2009 7.4 3.3 5.9 8.1 5.4 6.9 5.8 11.6
Greece 2010 7 3.2 5.4 5.2 8.3 0.4 4.1 7.5 12.7 6.1 11.3
Economy Year A B C D E F G H I J K Guatemala 2000 10.5 4.8 12.6 8.4 19.2 9.9 8.1 19.7 13.2 11.1 18.1 Guatemala 2002 10.1 4.9 11.6 9.4 18.2 10 8.5 18.5 13.2 12.9 17.9 Guatemala 2003 11.1 4.7 14.3 9.9 17.4 16.8 10.2 16.8 6.4 10.8 18.6 Guatemala 2004 10 4.7 14.6 8.9 15.1 12.3 8.8 16.7 18.7 11.2 14.1 Guatemala 2006 9.6 4.8 13.9 7.8 14.7 13.5 7.6 16.4 11.4 10 12.9 Guatemala 2011 10 4.8 3.4 4.1 19.5 2.9 2.8 18.9 7.1 4 24.5 Guinea 1994 6.3 7.2 19.5 8.8 19.4 10.4 24.4 0.5 4.4
Guyana 1992 3.3 2.9 0.6 2.6 1.4 3.6 1.8 6.4
Haiti 2001 8.3 8 23.8 14 18.4 20.8 12.3 21.9 23.9 18.3 11.5 Honduras 1991 12.9 4.5 13.8 13.1 20.9 12.5 11 20.8 26 18.9 21.1 Honduras 1992 12.6 4.6 12.8 13.3 19.6 12 11.2 20.4 22.4 18.2 18.2 Honduras 1993 12.8 4.5 13.3 13.2 19.1 13.6 10.5 20.5 15.6 18.8 17.2 Honduras 1994 13.5 4.4 19.2 12.8 19.7 20.7 11.5 21.1 15.5 15.8 17.7 Honduras 1995 11.7 4.4 11.4 11.8 17.8 12 10.2 19.8 13.7 15.7 15 Honduras 1996 12.3 4.6 15.4 11.4 18.8 14.1 10.3 18.9 26.4 14.9 18.5 Honduras 1997 11.4 4.4 12.3 10.4 20.2 12.5 8.5 20.7 18.7 14.4 19.4 Honduras 1998 11.1 4.6 12 10 20.8 12 7.8 22.1 15.6 14.7 19.5 Honduras 1999 11.8 4.5 12.4 11 19 10.5 9.4 18.8 22.9 14.8 19.5 Honduras 2001 12.7 4.5 13.7 11.7 19 14.1 10.3 19.9 14.2 14.7 18.3 Honduras 2002 11.4 5 12.9 11.5 20.8 12.6 10.9 20.7 17.5 13.3 21.2 Honduras 2003 12.7 4.5 13.2 10.9 23.1 12.9 10.8 23.6 14.9 11.2 22.8 Honduras 2004 12.9 4.6 14.1 11.7 19.2 15 11.1 20.5 10.5 13 17.9 Honduras 2005 13 4.5 9.7 11.7 21.1 10.1 11.8 21.5 6.5 11.7 21.1 Honduras 2006 12.9 4.6 15.1 11.3 19.9 14.5 11.1 20.3 18.6 11.5 19.6 Honduras 2007 13 4.5 14 10.6 21.9 14.3 10.5 21.8 13.2 11.1 22.1 Honduras 2008 12.2 4.6 13.3 10.1 20.7 13 9.7 21.2 15.6 11.2 20.4 Honduras 2009 12.2 4.5 11.9 11 19.2 11.5 10.1 19.7 15.3 12.7 18.5 Honduras 2010 12.3 4.6 11.8 10.6 20 11 9.9 20.9 17.7 12.2 19.3 Honduras 2011 12.4 4.6 12.1 10.7 19.8 12.4 10.1 20.4 10.8 11.7 19.3
Hungary 2004 11.9 2.7 13 13.3 13.3
Hungary 2005 13.3 2.2 9.4 16 11.1 17 16.5 4.4 16.1 Hungary 2006 14.7 2.2 21.1 8.4 16.5 7.7 9.3 18.2 8.4
Hungary 2007 14.1 2.2 15.4 16.1 16
Hungary 2008 13.9 2.2 15.1 16.5 15.4
Hungary 2009 14.1 2.2 14.7 16.9 14.3
Hungary 2010 13.7 2.2 14.6 16 15
Hungary 2011 12.6 2.1 13 14.3 13.4
Hungary 2012 13.2 2.1 13 14 14
Iceland 2004 9.5 2.7 11.2 10.7 13.5
Iceland 2005 8.7 2.7 10.6 10.3 12.8
Iceland 2006 8.1 2.7 9.5 9.8 11.7
Iceland 2007 6.5 2.7 7.8 6.9 11.4
Iceland 2008 7.2 2.8 8.8 9.3 11.1
Iceland 2009 8.2 2.7 10.2 10.1 12.1
Iceland 2010 7.2 2.8 8.9 8.6 12.4
Iceland 2011 7.4 2.8 9.4 8.1 13.2
Iceland 2012 7.2 2.8 9.4 9.3 12.2
Economy Year A B C D E F G H I J K India 1999 7 3.7 11.4 4.3 20.2 7.7 3.9 17.4 6.6 2.3 36.5 India 2004 8.7 5.9 11.7 5.4 18.7 7.9 4.8 17.9 4.7 6 28.4 India 2007 12.4 5.3 11.5 9.6 27.7 8.4 9.1 26.5 5 8.5 37.4 India 2009 8.3 5.5 5.8 6 20.8 2.8 5.3 19.7 1.8 5.2 31 Indonesia 1998 12.1 4.3 18.4 11.1 13.4 12.7 8.8 13.9 8.1 13.5 15 Indonesia 1999 10.6 4.3 12.8 10.4 12.1 8 8.7 12.7 6.3 13.2 12.2 Indonesia 2000 10.1 4.9 17.5 9.5 11.1 11.3 8.2 11.5 16.6 12.8 11.3 Indonesia 2002 10 4.9 14.6 10.3 12.7 10.8 8.6 13.5 13.4 13.2 12.3 Indonesia 2003 10.2 4.3 14.9 9.5 10.6 10.2 8.2 11.3 14.4 11.9 11.2 Indonesia 2004 10.2 4.2 13.7 9.4 10.5 10 8 11.2 12.5 12.1 10.9 Indonesia 2006 10.1 4.3 10.6 9.7 10.9 8 8.5 11.9 10.7 11.7 11 Indonesia 2008 10.1 4.7 13.1 10.3 10.2 10.2 8.9 11.5 12.5 12.1 11.5 Indonesia 2009 10.7 4.7 14.6 10.6 10.6 10.8 9.3 12.1 15.4 12.4 11.5 Indonesia 2010 10.4 4.7 12.7 10 11.5 9.6 8.7 12.6 12.7 12 12.9 Iraq 2006 3.4 4.8 7.7 1.2 3.2 6.3 1 3.9 40.4 5.7 4
Ireland 2004 8.3 3.3 11.3 9.6 13.6
Ireland 2005 7.8 3.3 10.9 8.6 14
Ireland 2006 9.1 3.2 11.6 11 13.4
Ireland 2007 8.9 3.2 11.9 10.6 15
Ireland 2008 8.8 3.2 10.9 9.6 13.7
Ireland 2009 8.1 3.2 10.8 10.7 11.7
Italy 2004 6.7 2.9 7.5 5.2 6.9 8.5 4.9 7.5 6.9 6.7 8 Italy 2005 6.6 2.9 10.4 4.5 7.2 13.5 4.1 7.9 6.2 5.7 7.9 Italy 2006 6.8 2.8 4.9 5.1 7.3 6 5.2 8.4 11 5.5 8.1 Italy 2007 7 2.9 7 4.4 7.6 5.6 4.2 8.6 13.2 6 8.6
Italy 2008 6.4 2.8 0 5.2 7.2 3.5 3.8 7.6 7.4 9
Italy 2009 7.1 2.8 3.5 4.9 8.3 9.2 4.4 8.7 6.6 9.8 Italy 2010 6.7 2.8 1.5 4.9 7.7 4.8 4.6 8.3 6.5 9.2
Italy 2011 7 2.7 1.3 6.2 7.4 5.9 5.1 8 9.5 9
Italy 2012 6.6 2.6 5.7 7.3 4.7 8.2 7.9 8.7
Jamaica 1990 7.4 2.8 3.2 14 4 16.5 2.6 15.3
Jamaica 1996 15.2 2.6 4 2.6 26.9 3.5 1.9 26.4 7.6 2.7 30.9 Jamaica 1999 6.3 3.1 1.5 1.9 12.7 2.3 13 15.6 1.8 14.8
Jamaica 2001 11.1 3.3 22.2 4 3.6
Jamaica 2002 10.3 2.8 9.3 1.2 22 16.9 2.8 23.9 22.3
Japan 2004 9.9 2.2 8.6 5 6.7
Japan 2007 14 2.1 9 7.4 3.1
Jordan 2002 8.9 3.8 10.3 4.2 8.4 8.4 4.5 10.1 16.7 6 11.2 Kenya 2005 16.9 3.8 17.6 15.9 22.4 19.1 14.5 21.2 9.6 19.6 24.9
Korea, Rep. 2010 13.2 2.2 12.7 12.7 10
Kosovo 2003 4.2 2.7 2.1 7.4 2.6 7 9.3 0.4 9.2
Kyrgyz Republic 1997 8.7 3 5.6 7 6.7 6.8 5.7 5.7
Lao PDR 1997 3.3 4.2 13.2 2.5 5.3 13.6 2.3 5.6 16.9 3.3 5.4 Lao PDR 2002 10.3 3.9 18.4 9.1 10.5 24.7 8.1 11 12.7 11.5 11.5 Lao PDR 2008 5.1 4 10.7 4.8 5.6 13.9 3.5 5.6 7.6 7.7 5.4
Latvia 2004 6.5 2.3 9.9 11.6 10.3
Latvia 2005 7.4 2.9 23.2 4.3 7.6 15.2 6.2 7.4 47.8 3.6 10.7
Economy Year A B C D E F G H I J K Latvia 2008 10 2.3 3.5 11.3 2.5 6.5 12.3 2.3 14.8 Latvia 2009 10.9 2.3 12.2 11.5 11.9 12 9.8 13.7 14.1
Latvia 2010 11.9 2.3 51.8 12.6 48.8 14.6 13.5
Latvia 2011 11.6 2.3 3.9 11.6 2.9 2.8 12.5
Latvia 2012 11.4 2.3 7.6 11.6 4.7 12.8 12.8 13.9
Lebanon 2011 5.5 4.2 9.8 7.6 16.6
Lithuania 2005 12.2 2.1 9.8 10.5 11.9
Lithuania 2006 12.9 2.1 10.2 11.5 12
Lithuania 2007 10.9 2 8 8.5 11.9
Lithuania 2008 9.9 2 7.2 7.6 11.2
Lithuania 2009 10.4 2.1 2 8.1 1.1 12.6
Lithuania 2010 12.4 2.1 1 10.7 13
Lithuania 2011 14.2 2.1 3.3 14
Lithuania 2012 12.9 2.1 10.9 4.2 14.4
Luxembourg 2004 10.7 3.6 12.9 11.8 13.6
Luxembourg 2005 10.9 3.6 13 10.9 15
Luxembourg 2006 11.2 3.6 13 10.8 15.5
Luxembourg 2007 11.3 3.6 14.1 11.3 16.3
Luxembourg 2008 10.7 3.6 11.8 9.7 13.7
Luxembourg 2009 11.3 3.6 13.3 12.2 14.5
Luxembourg 2010 10.6 3.6 12.9 11.4 14.9
Luxembourg 2011 10.6 3.6 13.1 11.4 15.1
Luxembourg 2012 10.6 3.6 13.6 11.7 15.5
Macedonia, FYR 2003 5.7 3.1 2.5 2.1 8.5 4.5 1.1 7.9 3.7 4.2 9.9 Macedonia, FYR 2004 6.7 3 3.1 9.5 2.7 8.9 4.3 4.6 11.2 Macedonia, FYR 2005 5.7 3.4 4.4 1.7 7.2 5 2.4 6.1 2.8 0.7 10 Madagascar 1993 12.4 4.5 13.9 9.8 20.2 11.2 8.8 16 11.5 13.8 27.5 Madagascar 1997 9.3 4.3 11.2 8.6 8.8 12.8 6.9 8.1 5.5 10.5 9.7 Madagascar 2001 10.5 4.6 6.7 11 13.3 7.8 10.4 13.7 5.2 11 12.1 Madagascar 2010 11.1 4.5 2.8 10.3 23.1 0.9 9.7 25.1 1.4 11.7 19.7 Malawi 2004 5.2 3.7 6.3 5 23.7 5.6 4.1 22.9 2.7 4.4
Malawi 2010 9.8 4.5 24.2 23.9 26
Malaysia 2007 11.7 4.1 8.4 9.7 21.4 7.2 8.9 22.4 7.4 12.6 20.9 Malaysia 2008 11.5 4.2 11.3 9.6 21.2 10.8 8.7 20.8 9.3 12.9 22.5 Malaysia 2009 12.7 4.3 9.8 10.6 23.4 8.6 9.9 23.4 9.5 13.7 24.3 Malaysia 2010 12 4.2 8.8 9.7 22 7.6 9.3 21.8 6.8 12.3 23.1
Maldives 1998 3.5 4.2 7.7 13 0.8 6.6
Maldives 2004 7.2 4.1 2.8 3.5 12.8 4.4 1.3 14.1 9.1 13.7 Mali 1994 13 5.8 21.2 12.4 19.3 14.3 11.1 18.8 39.5 16.1 17.9
Malta 2009 9.8 2.9 12.8 11.6 15.1
Malta 2010 9.7 3 1.7 13.3 2.1 12.5 2.4 0.9 14.4
Malta 2011 9.6 3.1 2.3 13.4 1.9 11.5 4.7 16.3
Malta 2012 9.8 3 0.7 12 1.8 0.4 11.5 2.7 13.4
Mauritania 2000 7.4 5.4 11.7 5.8 13.5 8 5 13.1 21.3 9.2 13.5 Mauritius 1999 12.7 3.5 9.4 10.8 23.2 3.8 8.6 22.4 13.9 23.8 Mauritius 2001 13.5 3.1 11.5 11.1 17.3 6.8 9.1 9.9 3 13.7 25.3 Mauritius 2002 12.4 3.6 11.7 8 16.7 5.9 6.5 17.4 9.7 17.1