Returns to ICT Skills
Oliver Falcka, Alexandra Heimisch-Roeckerb, Simon Wiederholdc
Abstract
How important is mastering information and communication technology (ICT) on modern labor markets? We answer this question with unique data on ICT skills tested in 19 countries. Our two instrumental-variable models exploit technologically induced variation in broadband Internet availability that gives rise to variation in ICT skills across countries and German municipalities. We find statistically and economically significant returns to ICT skills. For instance, an increase in ICT skills similar to the gap between an average-performing and a top-performing country raises earnings by about 8 percent.
One mechanism driving positive returns is selection into occupations with high abstract task content.
Keywords: ICT skills; broadband; earnings; international comparisons JEL classification: J31; L96; K23
August 2, 2020
a LMU Munich, ifo Institute Munich, and CESifo Munich; postal address: Poschingerstraße 5, 81679 Munich, Germany; email: falck@ifo.de
b ifo Institute Munich; postal address: Poschingerstraße 5, 81679 Munich, Germany
c Corresponding author. KU Eichstaett-Ingolstadt, KU Research Institute BESH, ifo Institute Munich, CESifo Munich, and ROA Maastricht; postal address: Auf der Schanz 49, 85049 Ingolstadt, Germany; email:
simon.wiederhold@ku.de
1. Introduction
“The new literacy” is the term Neelie Kroes, former Vice President of the European Commission, uses to describe an individual’s skill in mastering information and communication technologies (ICT).
She justifies this terminology by arguing that “the online world is becoming a bigger part of everything we do. No wonder these [ICT] skills are becoming central in the job market.”1 Neelie Kroes argues from an individual perspective: the increasing use of ICT alters skill requirements by being complementary to some skills and substitutable to others, and consequently changes the labor-market prospects of individuals depending on their skill portfolio. From a macro-perspective, the increasing use of ICT is transforming innovation activities and production. Thus, there is reason to suspect that a country’s growth prospects are becoming increasingly dependent on its population’s skills to master new technologies.2 While earlier work has shown that ICT adoption has a positive effect on economic growth in a cross-country setting (most notably, Czernich et al., 2011 for broadband Internet), there is no convincing empirical evidence on the labor-market effects of ICT skills at the individual level. Using novel, internationally comparable skill data from the Programme for the International Assessment of Adult Competencies (PIAAC) across 19 countries, this paper provides the first systematic assessment of the wage returns to ICT skills.
To obtain the wage effect of ICT skills, we estimate a Mincer earnings function (Mincer, 1970, 1974; for an application with PIAAC data, see Hanushek et al., 2015) that relates a person’s wages to that’s person’s education (proxied by the level of skills) and experience (proxied by a quadratic polynomial in age to capture non-linearities in the tenure-earnings relationship). However, estimating the wage effect of a specific skill domain, such as ICT skills, in the Mincerian framework is rendered difficult by the fact that it is unknown whether a person’s level of ICT skills is simply a reflection of general ability. Notably, the seminal work by DiNardo and Pischke (1997) demonstrates that positive wage effects can also be found for pencil use at work, which are similar in magnitude to those of
1 http://www.getonlineweek.eu/vice-president-neelie-kroes-says-digital-literacy-and-e-skills-are-the-new-literacy/;
accessed June 23, 2020.
2 For instance, in endogenous growth models (e.g., Aghion and Howitt, 1992, 1998; Romer, 1990) innovation arises from intentional investments in research and development. This process is fundamentally guided by the underlying invention of people, which flows from the knowledge and skills of the population. Relatedly, in technological diffusion models, the rate at which economies can absorb the technological developments that happen outside depends again on the knowledge and skills of its population (e.g., Benhabib and Spiegel, 2005; Nelson and Phelps, 1966; Welch, 1970). As technological change is becoming more digital in nature (e.g., see recent developments such as the Internet of Things, Big Data, and Artificial Intelligence), individual’s ICT skills are likely to assume a more prominent role for the generation and diffusion of new (digital) technologies in the future.
computer use. Based on this finding, they conclude that returns to computer use at work must be biased by unobserved skills of the users. Thus, drawing credible inferences on the wage effect of ICT skills requires exogenous variation in this specific skill domain.
Our identification strategy is based on the idea that ICT skills are developed by performing ICT- related tasks, which is facilitated by Internet access.3 We implement two instrumental-variable (IV) strategies that exploit technologically induced variation in Internet availability across countries and across small geographical areas within a single country. In the cross-country strategy, this variation stems from international differences in the rollout of preexisting fixed-line voice-telephony networks that determine the timing of introduction and diffusion of high-speed Internet via broadband. These networks affect only the supply side of broadband diffusion in a country and therefore rule out demand- side effects based on differences in wealth and broadband-deployment policies (Czernich et al., 2011).
To address the concern that richer and more productive countries have more extensive fixed-line networks as well as higher wages and more skilled workers, we exploit the pronounced age pattern in the impact of exogenous broadband availability on ICT skills. The youngest cohorts in PIAAC were toddlers when broadband emerged; the oldest cohorts were already reluctant to use the new technology.
This allows us to identify returns to ICT skills based on differences in ICT skills and wages between age cohorts within countries.
In the second IV strategy, we exploit technological peculiarities that led to variation in broadband availability at a very fine regional level within Germany.Specifically, in the western part of Germany, the voice-telephony network was designed in the 1960s with the goal of providing universal telephone service to German households. In traditional telephone networks, the distance between a household and the main network node (“last mile”) was irrelevant for the quality of voice-telephony services;
however, about 40 years later, the last-mile distance restricted the availability of broadband Internet.
Beyond a certain distance threshold, high-speed Internet access was not feasible without major infrastructure investment, a situation that excluded a considerable share of West German municipalities from early broadband Internet access (Falck et al., 2014).4 We also control for the economic situation
3 Recently, a stream of literature has emerged on the effects of Internet use on various (social) outcomes (see, e.g., Bauernschuster et al., 2014, for social interactions; Falck et al., 2014, for voting behavior; and Bhuller et al., 2013, for sex crimes). Moreover, Bulman and Fairlie (2016) provide an excellent overview of the impact of computer and Internet use on student achievement.
4 Other studies have used variation in technological broadband availability across locations as a source of exogenous variation in actual use (e.g., Bertschek et al., 2013). However, this instrument is valid only conditional on structural location
in a municipality before the emergence of broadband, which may be correlated with both baseline fixed- line networks and today’s wages.
We find that the extent and technical peculiarities of the preexisting fixed-line infrastructure are significantly related to individuals’ ICT skills, supporting the assertion that a higher (technologically determined) probability of having Internet access leads to learning-by-doing in ICT skills. Drawing only on variation in ICT skills attributable to exogenously determined broadband access, both IV strategies indicate a positive effect of ICT skills on wages that is economically and statistically significant. In the cross-country analysis, our ICT-skills estimate implies that if an average worker in the United States increased her ICT skills to the level of an average worker in Japan (i.e., the best-performing country in the skill assessment), her wages would increase by about 8 percent; this is close to the well-identified estimates on the returns to one additional year of schooling in developed countries. Thus, catching up in ICT skills from the middle of the international league table to the top position yields a similar wage increase as one additional year of schooling. In Germany, estimated returns to ICT skills are even somewhat larger. A detailed complier analysis suggests that returns to ICT skills for those who give rise to the identifying variation in the IV estimate are higher than for the average worker. One potential reason for this finding is that our IV approach isolates a specific dimension of ICT skills, namely, Internet skills, which were likely scarcer than overall ICT skills (which also include computer proficiency) when broadband emerged and therefore more highly rewarded.
We provide a comprehensive assessment of the validity of our identification strategy. For instance, we make use of the unique feature of our data that we not only have information on ICT skills but also on other skill domains, namely, numeracy and literacy. We can show in Placebo tests that our instruments are unrelated to these other skill domains when conditioning on ICT skills. We also show that the residualized (i.e., net of ICT skills) numeracy and literacy skills have high wage returns, suggesting that our IV approach isolates ICT skills from the part of numeracy and literacy skills most relevant for labor-market success.5 Moreover, we carefully assess the exclusion restriction of our IV
al. (2013) exploit variation in the timing of broadband deployment across locations in Norway, with the variation in timing stemming from limited funding of a public program and not due to decisions made by profit-maximizing telecommunication carriers.
5 Our result that exogenous Internet availability affects only a specific set of skills is in line with Malamud and Pop- Eleches (2011). Exploiting an income threshold for eligibility for a computer voucher in Romania, they show that home computer ownership has zero or even negative effects on student achievement in math and reading but supports the development of ICT-related skills. Likewise, Faber et al. (2015) use a boundary-discontinuities strategy in the United Kingdom that relies on a similar idea as our within-Germany model, and find that the availability of fast Internet at students’
homes has no effect on their test scores.
approach that exogenous broadband availability affects today’s wages only through individuals’ ICT skills, and not directly in any other way. In fact, our results continue to hold if we control for direct productivity effects of broadband within countries, industries, and even within detailed country-industry cells. Results are also robust to extensively controlling for initial cross-country differences in general technology affinity, spread of ICT-related industries, and economic strength.
A unique feature of the PIAAC survey is that it combines individual-level information on ICT skills, wages, and detailed occupation in a single dataset. This allows us to shed light on a potential mechanism behind the positive returns to ICT skills, namely, that the proliferation of personal computers caused a shift away from routine tasks—that is, those more amenable to automation—
toward problem-solving and complex communication tasks (typically called “nonroutine abstract tasks”). This argument was first made by Autor et al. (2003) when developing their task-based approach to skill-biased technological change.6 We expect that the complementarity of computers (requiring ICT skills) and abstract tasks allows workers with high ICT skills to select into abstract jobs and to benefit from the wage premia these jobs pay. To test whether occupational selection is an avenue through which ICT skills lead to higher wages, we estimate our IV models with abstract, routine, and manual task content as outcomes. We find that higher ICT skills increase the abstract task content of jobs and decrease their routine and manual task content. Back-of-the envelope calculations suggest that occupational selection explains about two-thirds of the wage increase caused by higher ICT skills.7
The paper is organized as follows. Section 2 describes the PIAAC data and the assessment of ICT skills. Section 3 outlines our two IV strategies. Section 4 presents the returns-to-ICT-skills estimates.
Section 5 provides an analysis of the validity of our instruments. Section 6 investigates whether occupational selection explains positive returns to ICT skills. Section 7 concludes and derives implications for policy-making.
6 See also Akerman et al. (2015), Autor and Dorn (2013), Autor et al. (2006, 2008), Black and Spitz-Oener (2010), Cortes (2016), Firpo et al. (2011), Goos and Manning (2007), Goos et al. (2014), Spitz-Oener (2006, 2008), and related earlier work by Acemoglu (1998) and Bresnahan et al. (2002). Acemoglu and Autor (2011) as well as Autor (2015) provide recent reviews of this literature.
7 These results are in line with Gaggl and Wright (2017), who provide evidence for the United Kingdom that ICT investments increase the earnings and employment of workers engaged in abstract tasks. See also Akerman et al. (2015) for a task-based explanation of labor-market effects of broadband Internet adoption in Norway.
2. ICT Skills
Previous work on the wage returns to computer skills (see Draca et al., 2007, for a recent review) typically relied on self-reported measures of computer use, for instance, from the U.S. Current Population Survey (e.g., Krueger, 1993) or the British National Child Development Study (Dolton and Makepeace, 2004), implicitly assuming that workers with better skills are allocated to jobs in which computer skills are required. A few papers use self-reported measures of computer knowledge or skills, provided, for instance, in the German Qualification and Career Survey (e.g., DiNardo and Pischke, 1997) or in the British Skills Survey (e.g., Borghans and ter Weel, 2004).8 Still, these measures are imperfect proxies for a worker’s true skills because they are very crude, typically limiting answers to only a few categories,9 suffer from reporting bias, and assume that workers are aware of the full skill distribution in the population. Moreover, existing worker surveys are not harmonized across countries, making an international analysis impossible. Furthermore, the returns from one or two decades ago may no longer be good indicators of the situation in economies that have undergone substantial technological change (discussed in, e.g., Acemoglu and Autor, 2011; Autor et al., 2003; Goldin and Katz, 2008).
One of the core features of this paper is its use of new and consistent international assessment data on the ICT skills of the adult population. These data come from the Programme for the International Assessment of Adult Competencies (PIAAC). PIAAC is the product of collaboration between participating countries through the Organization for Economic Co-operation and Development (OECD), and made use of leading international expertise to develop valid comparisons of skills across countries and cultures. The survey was conducted between August 2011 and March 2012 in 24 countries, which together represent about 75 percent of worldwide GDP.10 PIAAC was designed to provide representative measures of the cognitive skills possessed by adults aged 16 to 65 years, and had
8 A very recent example for the usage of self-reported computer skills is the study by Fairlie and Bahr (2017). They follow community-college students from disadvantaged backgrounds who were randomly assigned computers in 2006 for seven years. Their results indicate no effect of computer skills on earnings for these early-career workers.
9 For instance, in the British Skills Survey, people were asked whether they have “simple,” “moderate,” “complex,” or
“advanced” computer skills.
10 The countries that participated in PIAAC are Australia, Austria, Belgium (Flanders), Canada, Cyprus, the Czech Republic, Denmark, Estonia, Finland, France, Germany, Ireland, Italy, Japan, Korea, the Netherlands, Norway, Poland, the Russian Federation, the Slovak Republic, Spain, Sweden, the United Kingdom (England and Northern Ireland), and the United States. Canada (November 2011 to June 2012) and France (September to November 2012) were the only countries with a different survey period.
at least 5,000 participants in each country. The countries used different schemes for drawing their samples, but these were all aligned to known population counts with post-sampling weightings.11
Along with information on cognitive skills, PIAAC also offers extensive information on respondents’ individual and workplace characteristics, for instance, hourly wages as well as skill use at home and at work. This information is derived from a detailed background questionnaire completed by the PIAAC respondents prior to the skills assessment. The survey was administered by trained interviewers either in the respondent’s home or at a location agreed upon between the respondent and interviewer.12
PIAAC provides measures of cognitive skills in three domains: literacy, numeracy, and ICT (called
“problem solving in technology-rich environments” in the survey). PIAAC measures each of the skill domains on a 500-point scale.13 The individual-level correlation of ICT skills with literacy (numeracy) is 0.78 (0.73), which is less strong than the correlation between numeracy and literacy (0.82). Nevertheless, all three skill domains appear to measure distinct dimensions of a respondent’s skill set.14
We focus on ICT skills, defined as “using digital technology, communication tools and networks to acquire and evaluate information, communicate with others and perform practical tasks” (OECD, 2013, p. 86).15 To assess ICT skills, participants were given a series of problem scenarios and asked to find solutions to them using ICT-based applications such as an Internet browser and web pages, e-mail, word processing, and spreadsheet tools. The OECD does not publish the problem sets that were actually included in the assessment, but gives examples of tasks similar to those that were used in the
11 After the main PIAAC study was conducted in 2011/2012, there were two additional rounds of the PIAAC test. In 2014/2015, the second round of PIAAC was conducted in nine countries; in 2017/2018, further six countries participated in the third and final round of PIAAC. Our study uses only data from the first round of PIAAC.
12 The PIAAC Public Use File reports hourly wages for Austria, Canada, Germany, Sweden, and the United States only as a worker’s decile rank in the country-specific wage distribution. For Germany, we obtained the Scientific Use File, which contains continuous wage information. For the remaining countries, we follow Hanushek et al. (2015) in assigning the decile median of hourly wages to each survey participant belonging to the respective decile of the country-specific wage distribution. Moreover, in each country, we trim the bottom and top 1 percent of the wage distribution to limit the influence of outliers. Our results are not sensitive to whether or not we trim wages.
13 PIAAC provides 10 plausible values for each respondent and each skill domain. Throughout, we use the first plausible value of the PIAAC scores in each domain. See Perry et al. (2014) for a discussion of the plausible values in PIAAC.
14 The International Adult Literacy Survey (IALS), the predecessor of PIAAC, suffered from pair-wise correlations of individual skill domains that exceeded 0.9, making it virtually impossible to distinguish between different skills. Moreover, ICT skills were not assessed in IALS.
15 Literacy is the ability to understand, evaluate, use, and engage with written texts so as to participate in society, achieve one’s goals, and develop one’s knowledge and potential. Numeracy is the ability to access, use, interpret, and communicate mathematical information and ideas in order to engage in and manage the mathematical demands of a range of situations in adult life. See OECD (2013) for details.
test. For instance, one task was to click through a number of different websites containing calls for jobs and to bookmark all websites which do not require to register or to pay a fee. Accordingly, this task involves maneuvering between websites, processing of information, and a basic understanding of web browsers. Special software was programmed for the ICT skills assessment, to make sure that person who are not familiar with a specific software (e.g., Microsoft Excel or Word) do not have a disadvantage.
Often, solving the tasks in the ICT skills assessment required a combination of several applications, for example, managing requests to reserve a meeting room using a web-based reservation system and sending out e-mails to decline reservation requests that could not be accommodated.16 In general, ICT skills as assessed in PIAAC measure the extent to which a participant is capable of using modern information and communication tools to get along in a digital world. PIAAC’s ICT test does not reflect proficiency in more specific computer skills like advanced programming. However, the rather basic ICT skills tested in PIAAC likely provide the foundation for developing more complex ICT skills; for instance, occupations which likely require most advanced ICT skills (i.e., software developers, programmers, database designers) also score highest in PIAAC’s ICT test. Problem solving using modern information and communication tools certainly also involves literacy and numeracy skills, which explains the rather strong correlation with literacy and numeracy skills reported above.
ICT skills were assessed in a computer-based mode, so some basic knowledge regarding the use of computers was required to even participate in the ICT skill test; 7.5 percent of all PIAAC participants indicated in the background questionnaire that they had no prior computer experience and thus these participants did not take part in the computer-based assessment. Instead, they took the survey via pencil and paper, and only their numeracy and literacy skills were tested. Participants who reported at least basic knowledge of computer-based applications were issued an ICT core test, which assessed basic ICT competencies such as using a keyboard/mouse or scrolling through text on the screen; 5.1 percent of all participants did not pass this test and were excluded from the ICT skills assessment. Moreover, 9.8 percent of all participants opted to take the paper-based assessment without first taking the ICT
16 See OECD (2013, p. 89, 2015, p. 39f.) for other examples of problem scenarios used in PIAAC to test participants’
ICT skills. The ICT tasks to be solved were of three levels of difficulty.
core assessment, even though they reported some prior experience with computers.17 Persons without an ICT skills score are excluded from our main estimation sample.18
Assessing ICT skills was an international option. Cyprus, France, Italy, and Spain did not take part in the ICT skills assessment, which leaves us with data for 19 countries.19 We also drop individuals aged 16–19 years because most have not finished their education. Moreover, our identification strategy (see Section 3) requires that we can ascribe respondents’ ICT skills to broadband Internet access in the PIAAC test country. We therefore exclude first-generation immigrants, whooften have developed their ICT skills in a country other than the PIAAC test country.20 The resulting sample includes 53,879 individual-level observations.21
Figure 1 depicts ICT skills by country, showing mean, median, and interquartile range of the ICT skills distribution. The average (median) level of ICT skill across PIAAC countries is 287 points (289 points), with a standard deviation (SD) of 41 points.22Respondents in Japan, Sweden, Australia, and the Netherlands have the highest average scores; respondents in the former communist countries (the Czech Republic, Estonia, Poland, and the Slovak Republic) and Ireland score lowest. The difference between Japan (the best-performing country with 299 points) and Poland (the worst-performing
17 Not surprisingly, people who took the paper-based assessment are, on average, older than people who took the computer-based assessment, regardless of the reason for this choice (i.e., no computer experience, failed in core ICT test, opting out). People whose skills were assessed via the paper-based format also tend to use the Internet and computers very infrequently, if at all, at home. Moreover, they have, on average, lower numeracy and literacy skills. See also Rammstedt (2013) and OECD (2015).
18 The fact that ICT skills could not be tested for all respondents implies sample selectivity. To check whether this matters for our results, we assign people with missing ICT skills a very low value of ICT skills (e.g., zero ICT skills; minimum ICT skills either of all respondents or of the respondents in the same country; one percent of the median observed ICT skills in a country). We also experimented with other imputation methods. Returns to ICT skills tend to increase in these more inclusive samples, which is hardly surprising given that people without ICT skills information often work in low-paying jobs (see above). See Online Appendix D for details.
19 We also exclude the Russian Federation from the analysis. According to OECD (2013), data for the Russian Federation are preliminary, may still be subject to change, and are not representative of the entire Russian population because they do not include the population of the Moscow municipal area.
20 Placebo tests and robustness analyses (see Online Appendices C and D) show the appropriateness of these sample restrictions.
21 The international PIAAC sample with 24 countries contains 164,997 observations. Without the four countries that opted out of the ICT skills assessment and the Russian Federation, sample size is 138,383 observations. ICT skills could not be measured for 32,831 individuals. We restrict the sample to persons who are employed at the time of the PIAAC survey, trim the bottom and top 1 percent of the wage distribution, and exclude self-employed who do not report hourly wage information in PIAAC, leading to a decrease in sample size by 41,549 observations. The age restriction further reduces the sample by 2,989 workers and dropping first-generation immigrants reduces it by 6,349 workers. Finally, we exclude 786 workers with missing information on migration status, gender, education, full-time status, or work experience, resulting in a sample of 53,879 workers.
22 Both mean and SD of numeracy and literacy skills are very similar in the international sample (see Table A-1).
country with 273 points) amounts to roughly 0.6 SD. Countries also differ in how ICT skills are distributed in the population. The ICT skill distribution is widest in Poland, the United States, and the Czech Republic, where the 25th–75th percentile skill range amounts to more than 60 points, and is most compressed in Korea, with an interquartile range of less than 50 points.
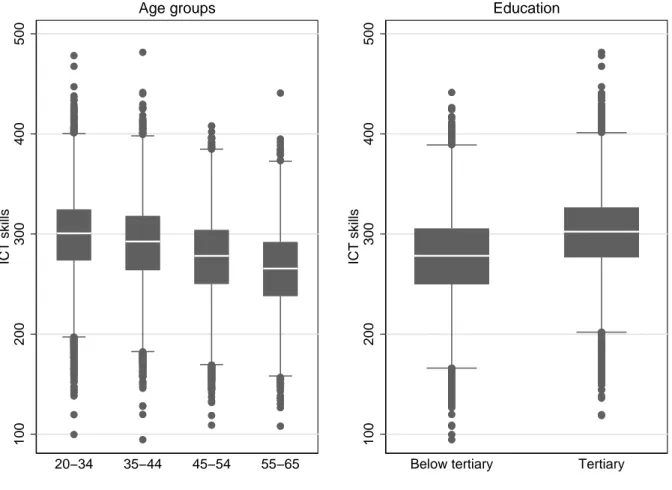
Figure A-1 in Online Appendix A shows that ICT skills tend to decrease by age (298 points for age group 20–34 vs. 267 points for age group 55–65). Similarly, tertiary-educated workers outperform workers with below-tertiary education, but not by a large margin (301 points vs. 277 points). However, there is substantial variation in ICT skills for all age ranges and education levels. The wide variation in ICT skills even within the groups of young adults or college-educated workers suggests that ICT skills are tolerably difficult to acquire, so having them might be rewarded by employers. The idea that ICT skills cannot easily be acquired is further supported by the fact that about 24 percent of the population do not possess even very basic ICT proficiency (see above).
Table A-1 in Online Appendix A sets out descriptive statistics of participants’ characteristics for the pooled international sample and separately for each country. The size of the estimation sample ranges from 1,649 persons in the Slovak Republic to 10,499 persons in Canada. The Canadian sample is much larger than that of any other PIAAC country due to oversampling to obtain regionally reliable estimates. Also apparent from Table A-1 are the substantial differences in hourly wages (in PPP-USD) across countries. Workers in Norway, Denmark, and Ireland earn the highest wages and workers in the post-communist countries are paid the least, with the difference between the highest-paying country (Norway) and lowest-paying country (the Slovak Republic) amounting to 1.6 SD.
In the econometric analysis, we standardize ICT skills to have mean zero and SD one23 and always employ the sample weights provided in PIAAC.24
23 In the international analysis, we standardize scores using the cross-country SD; in the German analysis, we use the within-Germany SD. Both are almost exactly at 41 PIAAC points.
24 In the cross-country analysis, we restrict the sum of all individual-level weights within a country to equal one to account for differences in sample size across countries; we employ an analogous weight adjustment that restricts the sum of all individual-level weights within a municipality to equal one in the within-Germany analysis.
3. Identification Strategy 3.1 Empirical Model
We estimate returns to ICT skills in a general Mincer framework (Mincer, 1970, 1974) that relates a person’s human capital to earnings on the labor market. Specifically, the international analysis is based on the following individual-level wage regression:
log𝑤𝑤𝑖𝑖𝑖𝑖 =𝛽𝛽0+𝛽𝛽1𝐼𝐼𝐼𝐼𝐼𝐼𝑖𝑖𝑖𝑖+𝑿𝑿𝒊𝒊𝒊𝒊𝜷𝜷𝟐𝟐+𝜇𝜇𝑖𝑖 +𝜀𝜀𝑖𝑖𝑖𝑖. (1)
𝑤𝑤𝑖𝑖𝑖𝑖 is gross hourly wages earned by individual 𝑖𝑖 living in country 𝑐𝑐 and 𝐼𝐼𝐼𝐼𝐼𝐼𝑖𝑖𝑖𝑖 are the individual’s ICT skills. 𝑿𝑿𝒊𝒊𝒊𝒊 is a vector of individual-level variables including age and gender. Following Hanushek et al. (2015), we estimate an earnings function without years of schooling, which is one of several inputs into cognitive skills. 𝜇𝜇𝑖𝑖 are country fixed effects that account for any differences in the countries’ wage levels. 𝜀𝜀𝑖𝑖𝑖𝑖 is a standard error term. The coefficient of interest is 𝛽𝛽1, which shows the wage change in percent when ICT skills increase by one SD.25
In this basic regression framework, 𝛽𝛽1 can hardly be interpreted as the causal effect of ICT skills on wages. The most obvious reasons for 𝛽𝛽1 being a biased estimate of the true returns to ICT skills are measurement error, reverse causality, and omitted variables (for a discussion, see Hanushek et al., 2015).
Measurement error may occur if cognitive skills in PIAAC are just an error-ridden measure of the human capital relevant on the labor market. For instance, since the ICT-based applications included in the PIAAC test are unfamiliar to the respondents, they may have problems solving the tasks even if they are perfectly capable of using ICT at their workplace. Errors in the measurement of ICT skills can also occur if PIAAC respondents had a bad testing day or solved tasks correctly or incorrectly simply by chance. This measurement error in the assessment of an individual’s ICT skills will bias the coefficient on ICT skills toward zero. Moreover, higher earnings may actually lead to improvements in ICT skills, giving rise to the problem of reverse causality. Better jobs may more likely require and reinforce skills or they may provide the resources to invest in adult education, training, or computer courses. Reverse causality will likely lead to an upward bias of the returns-to-ICT-skills estimates. Finally, omitted-variable bias may arise because unobserved variables like non-cognitive skills, personality traits, or family background could directly influence earnings and may also be related to ICT skills. The direction of the
25 For ease of exposition, we frequently refer to 𝛽𝛽1 simply as the “return to ICT skill.” It does not, however, correspond to a rate of return calculation because we have no indication of the cost of achieving any given level of skill. See also Heckman et al. (2006).
omitted-variable bias is not clear a priori. For instance, Malamud and Pop-Eleches (2011) find that home computers increase computer knowledge but worsen grades, implying that ICT skills may be negatively related to other skills. This would bias the least squares estimates downward. A positive correlation of ICT skills with other unobserved variables that are valued on the labor market would bias the least squares estimates upward.
To solve these endogeneity problems, we employ two IV strategies. The basic idea behind both is that individuals acquire ICT skills through learning-by-doing, and that this learning is facilitated when there is access to broadband Internet. Specifically, we exploit technologically determined variation in the availability of broadband Internet access via DSL across countries and between highly disaggregated regions within a single country. These IV models can be interpreted as a reduced form of the following three-stage model: (1) technological peculiarities of the broadband technology predict broadband diffusion; (2) broadband diffusion predicts ICT skills; and (3) ICT skills determine wages.
3.2 Characteristics of the DSL Network
DSL, one of the two dominant fixed-line broadband Internet access technologies worldwide,26 relies on the copper wires of the voice-telephony network connecting households with the main distribution frame (MDF). The voice-telephony networks were typically planned and rolled out by state monopolies, so decisions concerning infrastructure deployment were usually made on the basis of political rather than commercial considerations. Many countries implemented a universal service obligation, forcing telecommunication carriers to provide their services at affordable prices regardless of households’ geographic location.
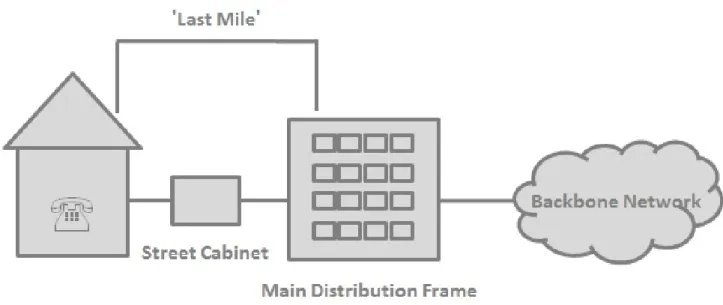
The copper wires—which were solely used for fixed-line voice calls before the emergence of DSL technology—could be upgraded to provide DSL by installing new hardware (so called DSLAMs) at the MDFs, making data traffic at high bandwidths to the telecommunication carrier’s backbone network feasible (see Figure A-2). This technological feature of DSL technology made broadband rollout substantially cheaper compared to having to roll out new wires to households. Even in countries where fiber was rolled out to the curbs or homes, the existing ducts of traditional fixed-line networks were used to reduce the deployment cost of broadband. Thus, the existing fixed-line infrastructure initially built for purposes other than the provision of broadband allowed for an economically viable widespread
26 The major alternative fixed-line access technology is broadband access via cable TV networks (see Section II of Online Appendix C).
diffusion of broadband Internet (Czernich et al., 2011). In consequence, countries with a high fixed-line penetration before the introduction of DSL could roll out broadband earlier and reached a larger share of the population faster than countries lagging behind in fixed-line infrastructure (see Section 3.3).
At the same time, the reliance of broadband rollout on traditional voice-telephony networks led to an uneven distribution of broadband access within countries in the early years of the Internet era. While the distance between the household and the MDF, the so-called last mile (see Figure A-2), is irrelevant for the quality of voice-telephony services, it determines the feasibility of DSL technology and therefore plays a crucial role in broadband access. Above a certain last-mile distance, DSL is no longer feasible without major infrastructure investment. This technological peculiarity of DSL technology induces exogenous variation in broadband access at a very fine regional level (see Section 3.4).
3.3 Cross-Country Instrumental-Variable Model
We begin by showing that preexisting fixed-line infrastructure affected the introduction and initial diffusion of broadband Internet. Figure 2 reveals a negative relationship between a country’s fixed-line infrastructure in 1996 (broadband first emerged in Canada in 1997) and the year broadband was introduced in the country. Similarly, Figure 3 shows a strong positive relationship between preexisting fixed-line diffusion and broadband diffusion in 2006, that is, several years after the first introduction of broadband. Both figures indicate that broadband infrastructure relies on traditional fixed-line networks.
One may wonder why the extent of fixed-line networks differed at the advent of DSL diffusion.
As was already noted, a country’s fixed-line penetration was largely determined by the degree to which the universal service obligation was implemented. Implementation differed across countries along three dimensions: availability, affordability, and accessibility (e.g., for people with disability) (see OECD, 2006, for an overview). With respect to the geographic extent of the voice-telephony network, the first dimension is of importance only. Consequently, those countries that put emphasis on availability had farther reaching voice-telephony networks than countries that put more emphasis on the other two dimensions. For instance, in the U.K. the universal service obligation requires British Telecom (and Kingston Communications in Hull) to provide a connection to the fixed-line network at a uniform price to basically everybody. By contrast, in the U.S., the universal service obligation focuses on affordability (discounts to low-income consumers and financial support to companies in high-roll-out-cost areas) and accessibility (for schools, libraries, and rural health care centers). These differences in implementation between the U.K. and the U.S. can also be seen in Figure 3. Even after controlling for
country-level characteristics, the U.K. had a farther reaching voice-telephony network in 1996 than the U.S.
However, the reliance of broadband Internet diffusion on preexisting fixed-line networks became substantially weaker over time. In fact, broadband diffusion in 2012 (i.e., the year of the PIAAC survey) is not significantly related to initial fixed-line diffusion (orange line in Figure 3). One reason cross- country differences in broadband penetration tend to flatten out over time is the S-shaped diffusion pattern of new technologies (Geroski, 2000; Griliches, 1957): countries that adopted broadband Internet earlier reach the concave part of the diffusion curve sooner, and thus broadband penetration grows more slowly than in countries that introduced broadband later. Moreover, new technologies such as mobile broadband infrastructure attenuate the importance of DSL for accessing the Internet.27
The variation in broadband Internet availability that we draw on to explain ICT skills thus mainly comes from the early years of the Internet era. One question that naturally arises is to what extent broadband Internet in these early years provided added value to consumers compared to technologies already available. Before the introduction of broadband Internet, only low-speed Internet access via dial-up-type technologies such as modems and ISDN was feasible. Even in the best case of high-end ISDN access, the maximum available speed was 128 kbit/s. The bandwidth increased substantially with the emergence of broadband, reducing limitations to Internet use as well as the excessive waiting times for loading web pages. According to a study by the Pew Internet and American Life Project (2002), even simple activities such as writing an e-mail are carried out more often when broadband access instead of dial-up technology is available in a household (52 vs. 67 percent). The advantage of fast Internet access is even more pronounced for information-seeking activities (13 vs. 30 percent), also including job-related research (14 vs. 36 percent). We therefore expect that primarily the availability of broadband Internet (vis-à-vis Internet access via dial-up technology) induces learning-by-doing effects in the accumulation of ICT skills. Note, however, that Internet use beyond the mere consumption of content (e.g., podcasting, blogging, social networking), as prevalent the second half of the 2000s, is less likely to contribute to the learning-by-doing effects we identify.
27 For instance, according to the annual ICT survey conducted by the German Federal Statistical Office, the share of German firms that use mobile broadband technologies to access the Internet more than doubled between 2008 and 2012, from 14 percent to 33 percent. In contrast, the share of firms using DSL to connect to the Internet has held constant at 80 percent since 2008 (Federal Statistical Office, 2012). However, given that most firms rely on DSL to access the Internet and are therefore also affected if DSL is unavailable for technical reasons, our IV strategy is likely picking up learning-by-doing effects in the accumulation of ICT skills at work and at home.
The fact that our identifying variation stems from the early phase of broadband diffusion induces a distinct age pattern in the impact of technologically determined broadband availability on the ICT skills of PIAAC respondents, which we exploit in the cross-country analysis. Figure 4 plots the effect of fixed-line diffusion in 1996 (i.e., before the emergence of broadband Internet) on ICT skills by five- year age cohort in our international sample. The bars in Figure 4 can be interpreted as follows: in countries where the fixed-line network (telephone subscribers per inhabitant in 1996) covers the entire population (diffusion of 1), the ICT skills of, say, 20-24 year olds are about one SD higher than in countries where nobody has a telephone connection (diffusion of 0).28 The horizontal axis of Figure 4 has two scales—the upper scale shows a person’s age at the time of the PIAAC survey and the lower scale shows how old these persons were when broadband first emerged in 1997. Around that time, traditional fixed-line networks should have affected broadband availability most.
The figure reveals an inverted U-shaped age pattern in the effect of technologically determined broadband availability on ICT skills.29 The young cohorts in the PIAAC sample (16–34 years) were toddlers or still at school when broadband Internet emerged in 1997 (see lower scale of horizontal axis), and thus were not using this technology professionally.30 We observe the strongest impact of technologically induced broadband availability for PIAAC respondents aged 35–44 years, who entered the labor market or started university in the early years of the Internet era. This is consistent with the notion that the most prominent applications of the Internet in these years were writing e-mails and looking up information. The effect of early broadband availability diminishes for older ages, which is explained by the psychological literature stressing that older individuals suffer more often from computer anxiety and have less computer self-efficacy (Czaja et al., 2006).31Note that Figure 4 is very similar when adjusting ICT skills by the age-specific SD to avoid potential ceiling effects (results available upon request).
28 However, the actual fixed-line diffusion in 1996 varied only between 0.17 (Poland) and 0.68 (Sweden).
29 We also observe an inverted U-shaped age pattern in computer use when looking at data from the time use survey conducted by the German Federal Statistical Office. In 2001/2002, 13 percent of computer users were 10–17 years old, 21.4 percent were 18–29 years old, 15 percent were 30–44 years old, and only 4.4 percent were 45–64 years old.
30 Many of the more leisure-oriented Internet applications (e.g., Facebook, YouTube, and Twitter) emerged only in the second half of the 2000s.
31 In Figure A-3, we observe that in countries with higher exogenous broadband availability, older individuals less often report not having any experience with computers and are also less likely to opt out of the ICT assessment. This evidence suggests that being exposed to the Internet increases individuals’ confidence in their computer and Internet abilities over time. We find no distinct age pattern in the effect of exogenous broadband availability on failing the ICT core test, indicating that by 2012, all countries were equally able to equip their inhabitants with very basic ICT skills.
Exploiting this pronounced age pattern in the impact of exogenous broadband availability on ICT skills, we estimate returns to ICT skills from differences in ICT skills and wages between age cohorts within countries. We implement the international IV model using two-stage least squares, where 𝐼𝐼𝐼𝐼𝐼𝐼𝑖𝑖𝑖𝑖
in the second-stage model (see Equation (1)) is the predicted value of the following first-stage model:
𝐼𝐼𝐼𝐼𝐼𝐼𝑖𝑖𝑖𝑖 =𝛼𝛼0+� 𝛼𝛼1𝑎𝑎𝑎𝑎𝑖𝑖𝑖𝑖×𝐹𝐹𝐹𝐹𝑖𝑖
𝑎𝑎
+𝑿𝑿𝒊𝒊𝒊𝒊𝜶𝜶𝟐𝟐+𝜇𝜇𝑖𝑖 +𝜗𝜗𝑖𝑖𝑖𝑖. (2)
Here, our instruments are interactions of the country-level fixed-line diffusion in 1996, 𝐹𝐹𝐹𝐹𝑖𝑖 (which determined broadband availability in the early Internet period), with indicators for the age cohorts, 𝑎𝑎𝑖𝑖𝑖𝑖. For expositional purposes, we aggregate the five-year age cohorts in PIAAC to broader age groups (i.e., 20–34, 35–44, 45–54, and 55–65 years), since Figure 4 indicates that the effect of fixed-line diffusion on ICT skills is rather similar within these age groups.32 The vector 𝑿𝑿𝒊𝒊𝒊𝒊 contains the individual-level control variables from Equation (1) and 𝜇𝜇𝑖𝑖 are country fixed effects. Due to the inclusion of country fixed effects, the main effect of fixed-line diffusion (pertaining to the omitted age cohort, 55–65 years) on ICT skills (first stage) or wages (second stage) is not identified. 𝜗𝜗𝑖𝑖𝑖𝑖 is the error term of the first-stage equation.
We report Huber-White heteroskedasticity-robust standard errors. We do not cluster standard errors because the variation we are using is at the individual level, that is, the variation comes from an individual’s age (see also Angrist and Krueger, 1991, for a similar argument).33 However, as can be seen from Table A-2, estimated returns to ICT skills remain statistically significant when we cluster standard errors at the country level (i.e., the level where fixed-line diffusion varies) or the country-times-age level, and are just shy of being significant (p-value of 0.106) when we cluster at the country times age-bracket level. The table also shows that results are similar when using the wild bootstrap procedure suggested by Cameron et al. (2008) for improved inference with few clusters (using Stata’s boottest command for implementation).
The IV model in Equation (2) exploits the fact that the ICT skills of different age cohorts within each country benefit differently from early (exogenous) broadband access. Using only age-induced
32 We also experimented with using quadratic, cubic, or quartic polynomials in age. However, none of these functional forms is flexible enough to capture the actual age pattern, as can be seen in Figure A-4.
33 Assigning individuals to age brackets is mainly for illustrative purposes, and it allows us to more flexibly capture the age pattern in openness to broadband adoption than using a linear or quadratic polynomial in age.
variation within countries addresses two major concerns. First, it captures any direct positive economic effect of the traditional fixed-line infrastructure on current wage levels. In fact, Roeller and Waverman (2001) show that a significant portion of economic growth in OECD countries between 1971 and 1990 can be attributed to telecommunications. Second, it controls for a potential correlation of baseline fixed- line networks with baseline levels of wealth, technology, education, institutions, skills, and so forth, all of which may affect today’s ICT skills and wages.
However, key to our identification strategy is that the effect of any omitted variables does not follow the same inverted-U-shaped age pattern as the effect of exogenous broadband availability does.
This assumption may fail to hold if omitted variables affect younger and older workers differently. Thus, Sections 5.2 and 5.3 provide comprehensive evidence that our results cannot be attributed to country- cohort specific factors. We can even allow for differential age trends by country, which addresses the concern that productivity and wages of young workers may benefit disproportionally from broadband (e.g., Autor and Dorn, 2009).
3.4 Within-Germany Instrumental-Variable Model
The extent of the preexisting fixed-line networks that we exploit for identification in the international IV strategy only affects the supply side of broadband diffusion and thus rules out demand- side effects based on differences in wealth as well as policy-induced effects. However, there may be concern that the age pattern in the uptake of broadband Internet is not fully exogenous but depends, at least to some degree, on the perceived labor-market benefits of using this new technology. We therefore complement the international analysis with a second IV strategy that uses regional variation within Germany in the deployment of broadband infrastructure as an instrument for ICT skills.
In general, differences in broadband diffusion across regions within a country are largely determined by the endogenous decisions of profit-maximizing telecommunication carriers, which are, in turn, influenced by demand factors such as income, education, and urbanization. Since these factors may also affect current wages, we exploit the fact that past a certain threshold in the distance between a household and its assigned MDF broadband is no longer feasible (see Section 3.2).Specifically, in West Germany, the general structure of the voice-telephony network dates back to the 1960s when the provision of telephone service was a state monopoly having the declared goal of providing universal
telephone service to all German households.34 While all households connected to an MDF enjoyed the same quality voice-telephony services, only those households closer than 4,200 meters (2.6 miles) to their assigned MDF could gain access to broadband Internet when a DSLAM was installed.35 Past this threshold, DSL technology was no longer feasible without replacing parts of the copper wire (typically placed between the MDF and the street cabinet) with fiber wire (see Figure A-2). Since this replacement involved costly earthworks that increased with the length of the bypass, certain West German municipalities were excluded from early broadband Internet access.36
We follow Falck et al. (2014) in using the 4,200-meter threshold as a source of exogenous variation in the availability of DSL technology in a municipality. We calculate the distance of a municipality’s geographic centroid (as a proxy for the location of the average household) to the assigned MDF and merge this information with the German PIAAC data. Following a line of argumentation similar to that in the cross-country identification strategy, we expect that PIAAC respondents in municipalities above the 4,200-meter threshold have lower ICT skills because they had less opportunity to accumulate ICT skills due to a lack of high-speed Internet access.
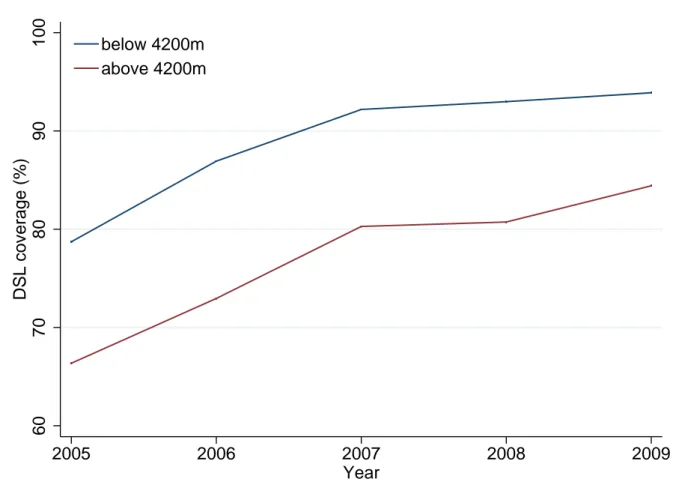
Over time, many countries expanded ICT infrastructure to their so-called white spots, which are predominantly rural municipalities that would remain underprovided if left to market forces. Today, most countries have achieved a basic provision of broadband Internet to almost all households. Figure 5 shows the share of households with access to DSL between 2005 and 2009 in municipalities below and above the 4,200-meter threshold.37 According to the figure, about 30 percent of the initial difference
34 We ignore East Germany since we cannot rule out that location decisions for the MDFs in East Germany, which were made after Reunification in the 1990s, were partly determined by unobserved characteristics of the municipalities that are also correlated with individual wages (see Bauernschuster et al., 2014, for details). Berlin is also dropped from the analysis because we are unable to distinguish between former West and East Berlin in terms of DSL availability.
35 The threshold value of 4,200 meters is a consequence of the DSL provision policy of the German telecommunication carrier, Deutsche Telekom, which marketed DSL subscriptions at the lowest downstream data transfer rate of 384 kbit/s only if the line loss was less than 55 decibel (dB). Since the copper cables connecting a household with the MDF usually had a diameter of 0.4 mm, a line loss of 55dB was typically reached at about 4,200 meters. As the actual line loss depends on other factors as well, the 4,200-meter threshold is only a fuzzy threshold (Falck et al., 2014). This fuzziness in the technological threshold of DSL availability is substantially more severe in other countries, effectively limiting the use of the threshold identification to Germany.
36 The costs of rolling out one kilometer of fiber wire subsurface amount to €80,000, with an additional €10,000 to install a new node connecting the remaining part of the copper wires to the fiber wire (Falck et al., 2014).
37 Availability of DSL is measured as the percentage of households in a municipality for which DSL is technologically feasible. Data are from the German Broadband Atlas, commissioned by the German Federal Ministry of Economics, in which telecommunication operators self-report the number of households covered by their networks at a minimum downstream data transfer rate of 384 kbit/s. Consistent data on DSL availability at the municipality level are available only for this short time period.
in DSL availability was eliminated after this four-year period. Similar to our cross-country specification, variation in broadband Internet availability thus mainly comes from the early years of the Internet era.
The first-stage model in the within-Germany analysis is a municipality-level (𝑚𝑚) version of Equation (2), using as instrument for ICT skills a dummy variable (𝐼𝐼) that indicates whether a municipality is more than 4,200 meters away from its assigned MDF:
𝐼𝐼𝐼𝐼𝐼𝐼𝑖𝑖𝑖𝑖 =𝛼𝛼0+𝛼𝛼1𝐼𝐼𝑖𝑖+𝑿𝑿𝒊𝒊𝒊𝒊𝜶𝜶𝟐𝟐+𝑿𝑿𝒊𝒊𝜶𝜶𝟑𝟑+𝜗𝜗𝑖𝑖𝑖𝑖. (3) The vector 𝑿𝑿𝒊𝒊𝒊𝒊includes a quadratic polynomial in work experience and gender.38 Since we cannot include municipality fixed effects in this specification, the vector 𝑿𝑿𝒊𝒊 contains controls for a municipality’s economic situation prior to emergence of broadband by including municipality-level unemployment rate and the local age structure, both measured in 1999 (broadband first emerged in 2000 in Germany).39𝜗𝜗𝑖𝑖𝑖𝑖 is the error term. As the threshold instrument varies only across municipalities, standard errors in the within-Germany analysis are clustered at the municipality level (Moulton, 1986, 1990).
In an extension, we focus on municipalities without an own MDF. Densely populated municipalities always have at least one own MDF and are typically below the 4,200-meter threshold; less agglomerated municipalities often share an MDF. The choice of MDF locations in these less- agglomerated areas was determined by the availability of lots and buildings for hosting an MDF at the time the voice-telephony network in Germany was planned, that is, in the 1960s. This sample thus includes only municipalities that were not chosen to host an MDF, which homogenizes the sample of municipalities with respect to socioeconomic characteristics. Some municipalities, however, were (arguably randomly) lucky to be close enough to an MDF in another municipality to have access to broadband Internet. This provides variation in the instrument in the restricted sample.40 However,
38 This specification follows the baseline model in Hanushek et al. (2015). In Online Appendix D, we report results when replacing work experience by age. Results are also similar when we use age cohort dummies as in the international analysis (results available upon request).
39 Data come from the German Federal Statistical Office. The unemployment rate is calculated by dividing the number of unemployed individuals by the population aged 18 to 65 years. To account for territorial changes due to municipality reforms that took place between 1999 and 2012, we use population weights provided by the Federal Institute for Research on Building, Urban Affairs, and Spatial Development to recode the data in ArcGIS.
40 In the full sample, 13 out of 204 municipalities (6.4%) are above the 4,200-meter threshold. In the sample of municipalities without an own MDF, half of the municipalities (9 out of 18) are above the threshold. This suggests that the identifying variation in the overall German sample mainly comes from sparsely populated, rural municipalities.
sample size is considerably smaller than in the full sample because the sampling of municipalities in PIAAC was proportional to municipality size (Rammstedt, 2013).
While it would in principle be possible to implement the age-cohort-based identification from the international analysis also in the German analysis, we refrain from doing so for three reasons: First, as we only have a limited number of observations within each municipality due to the sampling frame of PIAAC, municipalities often do not cover the full age range, so there is much less age variation within municipalities than within countries. Second, the age composition differs across municipalities, which is mainly due to selective mobility across municipalities. Third, the credibility of our results greatly benefits when they can be obtained from to identification strategies that use completely different sources of identifying variation (i.e., fine-grained regional variation in the German analysis and age variation in the international analysis).
4. Returns to ICT Skills 4.1 International Evidence
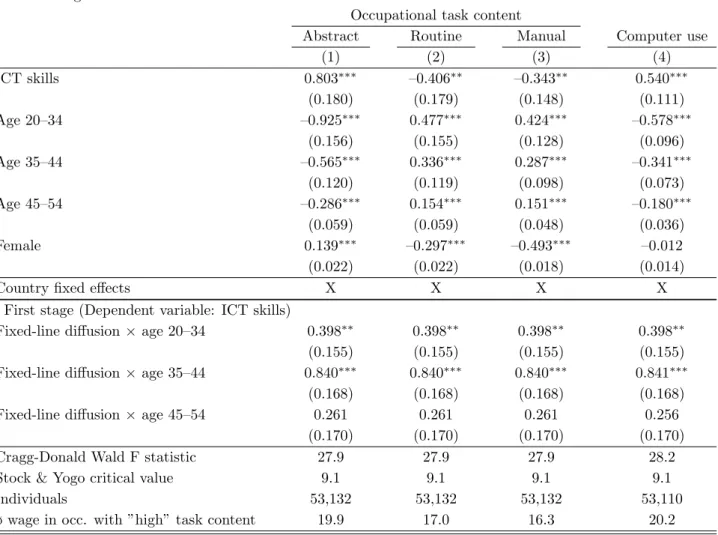
We now estimate the causal effect of ICT skills on individuals’ wages. Columns (3) and (4) of Table 1 present the results from our cross-country IV model. In the lower panel of Table 1, we report the first-stage coefficients as well as the Cragg-Donald F statistic on the excluded instruments and the associated critical values (Stock and Yogo, 2005). The instruments turn out to be strong predictors of ICT skills. In the specification with country fixed-effects serving as our baseline (Column (4)), the Cragg-Donald F statistic is 28.5 and thus well above the critical value of 9.1. Thus, weak instrument bias is not a worry in this context. The first-stage estimates indicate a distinct age pattern in the effect of exogenous broadband availability on ICT skills. Compared to the effect for persons aged 55–65 years (the omitted category), an increase in the voice-telephony penetration rate from 0 to 100 percent leads to a 0.38 SD larger increase in the ICT skills of 20–34 year olds, a 0.84 SD larger increase for 35–44 year olds, and a 0.25 SD (albeit insignificantly) larger increase for 45–54 year olds.41
The upper panel of Table 1 shows the corresponding second-stage results. Across specifications, our results indicate significant returns to ICT skills. In our baseline specification in Column (4), the ICT skill coefficient of 0.236 implies that a one SD increase in ICT skills attributable to a historically larger fixed-line network leads to a 23.6 percent increase in wages. Returns are very similar when we leave out
41 Complete first-stage results can be found in Table A-3.
country fixed effects and instead include the main effect of fixed-line diffusion to capture omitted variables that are correlated with ICT skills in the same way for all age groups within a country (Column (3)).
For assessing the magnitude of the estimated effect, note that one SD in ICT skills is substantial.
The difference in average ICT skills between the best-performing and worst-performing country is only 0.6 SD (see Table A-1). Likewise, one SD in ICT skills is roughly twice the learning progress made by school-attending PIAAC respondents between lower secondary and upper secondary education, which amounts to 20 PIAAC points across the countries participating in the study.42 We therefore provide some alternative interpretations of our effect size. For instance, if an average worker in the United States (with ICT skills of 285 points) increased her ICT skills to the level of an average worker in Japan (299 points), her wage would increase by about 8 percent; this is close to the well-identified estimates on the returns to one additional year of schooling in developed countries (e.g., Card, 1999; Heckman et al., 2006). Prime-age workers (aged 35–54 years) would experience a similar wage increase of about 8 percent if they could boost their ICT skills to the level of entry-age workers (aged 20–34 years). Another way to interpret our ICT-skills estimate is to consider occupational differences in ICT skills. Not surprisingly, ICT professionals (e.g., software developers, programmers, database designers) have by far the highest ICT skills across all occupations. They outperform the next-best occupation (ICT technicians) by 12 points (equivalent 0.29 SD) and are 36 points (equivalent to 0.87 SD) above the average in ICT skills. Our results imply that a worker with average ICT skills would increase her wage by 20 percent if she could bring her ICT skills to the level of ICT professionals.
It is also useful to compare the returns to ICT skills with existing estimates on returns to cognitive skills in other domains. In their sample of prime-age, full-time employed workers, Hanushek et al. (2015) find returns of 17.8 percent for a one SD increase in numeracy skills (see pooled model in their Table 2); returns are very similar for literacy skills.43 Estimated returns to skills are substantially larger—
increasing up to 80 percent in some specifications—in IV estimations that use changes in compulsory- schooling laws in the United States as a source of exogenous variation in numeracy skills. This would
42 We calculated this “ISCED-level equivalent” by regressing ICT skills of PIAAC respondents aged 16–18 years in the 19 sample countries on an indicator that takes the value 1 if the respondent is currently in upper secondary education (ISCED 3A-B, C long); 0 if the respondent is currently in lower secondary education (ISCED 2, 3C short). Regressions control for gender, age, number of books at home at age 15, a migrant indicator, and country fixed effects. The estimate provides an approximation of how much students learn on average transiting from lower secondary to upper secondary education.
43 The returns estimates are almost unchanged when we re-estimate their model for the 19 countries in our sample.
suggest that more traditional cognitive skills are somewhat more valued on the labor market than ICT skills as measured in PIAAC. However, given that our instruments are likely to isolate a very different complier population than previous estimations (also see analysis below), we shy away from interpreting this comparison as conclusive evidence for the value of ICT skills relative to other types of skill on modern labor markets.
Both IV coefficients are about twice as large as the corresponding OLS results, shown in Columns (1) and (2) of Table 1. These higher returns in the IV specification are likely attributable to measurement error in ICT skills, biasing our results toward zero (see Section 3.1), and that returns are higher for those who give rise to the identifying variation in the IV estimate, namely, the population of compliers. To judge the contribution of measurement error to the returns difference between OLS and IV, we provide two alternative strategies to adjust the estimated coefficient on ICT skills for measurement error. One strategy is to utilize information on the reliability of the ICT-skills test provided by the OECD and the other is to construct two different measures of ICT skills (with uncorrelated measurement errors) from the individual items of the ICT test, allowing to instrument one measure with the other. Both strategies suggest that the measurement-error-corrected effect of ICT skills on wages is about 50-70 percent larger than the baseline OLS estimate (see Online Appendix B for more details).
Since our identification comes from an inverted-U-shaped age pattern in the effect of early broadband availability on ICT skills, we aim to identify the complier population by studying this age pattern for different subgroups of surveyed individuals. Following the returns to schooling literature which suggests that widely-used instruments for schooling differently affect individuals at different education levels (e.g., Card, 2001; Kling, 2001), we explore potential differences in the age pattern of early broadband access for different levels of ICT proficiency.44 The OECD distinguishes three different ICT-proficiency levels: low (level 1 and below), intermediate (level 2), and high (level 3) (OECD, 2013).
In simple linear probability models, we find a pronounced inverted-U-shaped age pattern in the effect of early broadband availability on having an intermediate level of ICT proficiency, while there is no strong age pattern for high ICT proficiency (see Figure A-5).45 OLS regressions show that the complier population has particularly high returns to ICT skills (see Table A-4, Column (1)).46
44 We did not find pronounced differences in the age pattern for different levels of educational attainment.
45 Accordingly, the age pattern for low ICT proficiency is U-shaped.
46 A potential reason for these high returns is occupational selection. We will come back to this issue in Section 6.