Response to Microparticles: Theory, Assay Development and Model Study
DISSERTATION ZUR ERLANGUNG DES DOKTORGRADES DER NATURWISSENSCHAFTEN (DR. RER. NAT.) DER FAKULTÄT
CHEMIE UND PHARMAZIE
DER UNIVERSITÄT REGENSBURG
vorgelegt von Michaela Sperber
aus Regensburg im Jahr 2015
Die vorliegende Arbeit wurde in der Zeit von Dezember 2010 bis Dezember 2015 unter der Gesamtleitung von Prof. Dr. Joachim Wegener am Lehrstuhl für Analytische Chemie, Chemo- und Biosensorik der Universität Regensburg angefertigt.
Prüfungsgesuch eingereicht am: 22. Dezember 2015 Tag der mündlichen Prüfung: 19. Februar 2016 Prüfungsausschuss:
Vorsitzender: PD Dr. Sabine Amslinger Prof. Dr. Joachim Wegener Prof. Dr. Antje J. Bäumner PD Dr. Miriam Breunig
Für meine Familie und Wolfgang
”Ich habe keine besondere Begabung, sondern bin nur leidenschaftlich neugierig.“
Albert Einstein
1 LABEL-FREE CELL-BASED BIOSENSORS 1
Biosensors for Analysis of Cell Metabolism and Cell Morphology 3 1.1
Biological Phenomena Monitored with Cell-Based Biosensors 9 1.2
2 OBJECTIVE 15
3 MATERIALS AND METHODS 17
Cell Culture Techniques 17
3.1
Cell Lines 17
3.1.1
Subculturing 18
3.1.2
Medium and Buffer Composition 19
3.1.3
Cryopreservation and Recultivation 20
3.1.4
Physical Background of Impedance Spectroscopy 21
3.2
Electric Cell-Substrate Impedance Sensing 25
3.3
Experimental Setup 27
3.3.1
Basic Experimental Procedure 28
3.3.2
Different Modes of ECIS Recordings within the Commercially Available ECIS Setup 29 3.3.3
Electrode Layouts 30
3.3.4
Data Presentation of ECIS Recordings 32
3.3.5
Microscopy Techniques 34
3.4
Confocal Laser Scanning Microscope 34
3.4.1
Cytochemical Stainings 37
3.4.2
3.4.2.1 Fixation and Permeabilization 37
3.4.2.2 Live/Dead® Staining with Calcein AM and Ethidium Homodimer 37 3.4.2.3 Actin Cytoskeleton Staining with TRITC/Alexa Phalloidin 39
3.4.2.4 Cell Nuclei Staining with DAPI 39
3.4.2.5 Membrane Staining with DiI 40
3.4.2.6 Immunostaining of Occludin 40
3.4.2.7 PrestoBlue® Assay 41
4 SYSTEMATIC CHARACTERIZATION OF THE MONITORING PARAMETERS
BASED ON THE ECIS MODEL 43
Introducing Remarks 44
4.1
The Basic ECIS Model: Core of All Simulation Approaches 47 4.1.1
Simulation Using a LabVIEW-Based Software 50
4.1.2
Objective 52 4.2
Materials and Methods 53
4.3
Impedimetric Analysis to Support Simulation Results 53 4.3.1
4.3.1.1 Treatment with Cytochalasin D 53
4.3.1.2 Cell Seeding In Absence or Presence of Calcium 53
4.3.1.3 Co-Culture of Different Cell Types 54
4.3.1.4 Membrane Opening Due To Saponin Treatment 54
4.3.1.5 Special Electrode Layouts for Impedance Recordings 54 Microscopic Monitoring of Membrane Disruption after Saponin Treatment 56 4.3.2
Dye Diffusion across an Epithelial Cell Monolayer after Cytochalasin D Treatment 57 4.3.3
Opening and Closing of Intercellular Junctions 58
4.4
Quantification of Dye Diffusion through Layers of MDCK II Cells after Cytochalasin D 4.4.1
Treatment 59
Destruction of Epithelial Barrier Function after Treatment with Cytochalasin D 4.4.2
Monitored with ECIS 60
Reversible Effect of Cytochalasin D 64
4.4.3
Cell Seeding in Absence or Presence of Calcium 68
4.4.4
Simulation for Different Types of Barrier-Forming Cell Lines 74 4.4.5
Discussion: Monitoring Changes in Cell-Barrier Properties Using Impedance or 4.4.6
Resistance for Analysis 80
Inhomogeneity of Electrode Coverage 85
4.5
Variation of Cell-Free and Cell-Covered Area on the Electrode 87 4.5.1
4.5.1.1 Experimental Background 87
4.5.1.2 Simulation Using Varying Percentage of Cell-Free and Cell-Covered Area 90 Impedance Studies Addressing the Electrode Coverage Using the Redox Mediator 4.5.2
[Fe(CN)6]3–/4– 92
4.5.2.1 Principle 92
4.5.2.2 Concentration-Dependent Impact of [Fe(CN)6]3–/4– on ECIS Recordings 94 4.5.2.3 Use of [Fe(CN)6]3–/4– to Study Gradual Electrode Coverages 95
4.5.2.4 Simulations 98
Inhomogeneity of the Cell Population on the Electrode 100 4.5.3
4.5.3.1 Experimental Background 100
4.5.3.2 Simulation to Study the Inhomogeneity of a Cell Population 105
Open Membrane 108
4.5.4
4.5.4.1 Microscopic Analysis 108
4.5.4.2 Membrane Permeabilization after Saponin Treatment Monitored with ECIS 110
4.5.4.3 Simulated Data 112
Open Junctions 115
4.5.5
4.5.5.1 Experimental Support 115
4.5.5.2 Computed Data for Successive Opening of Epithelial Barrier Function 117 Discussion: Influences of an Inhomogeneous Electrode Coverage 121 4.5.6
4.5.6.1 Variation of Cell Coverage 121
4.5.6.2 Analysis of Electrode Coverage Based on RCT 123
4.5.6.3 Effect of a Inhomogeneous Cell Population 127
4.5.6.4 Differentiating Different Routes across the Cell Layer: “Open Membrane” vs.
“Open Junction” 129
Summary and Outlook 133
4.6
5 ASSAY TO STUDY GAP JUNCTIONAL INTERCELLULAR
COMMUNICATION 137
Introduction to Gap Junctional Intercellular Communication 138 5.1
Structural Characteristic and Organization 139
5.1.1
Regulation of Gap Junctions 141
5.1.2
Role of Gap Junctional Intercellular Communication for Cell and Tissue Physiology 146 5.1.3
Common Techniques to Analyze Gap Junctional Intercellular Communication 5.1.4
in vitro 147
Theoretical Background of Electroporation 153
5.2
Biophysical Background of Electroporation 155
5.2.1
Electroporation and Transient Permeabilization of the Cell Membrane 157 5.2.2
In Situ Electroporation of Adherent Cells 160
5.2.3
Objective and Motivation 166
5.3
Material and Methods for Analysis of Gap Junctional Intercellular Communication 5.4
Based on In Situ Electroporation 167
Experimental Setup and General Procedure for In Situ Electroporation 167 5.4.1
Protocol Modifications for In Situ Electroporation Experiments 169 5.4.2
Gap Junctional Intercellular Communication Study Based on Scrape 5.4.3
Loading Assay 171
ITO Electrode Fabrication Using Photolithography 171
5.4.4
In Situ Electroporation of Adherent NRK Cells 173
5.5
NRK Cells as Model System for Studying GJIC 173
5.5.1
Size-Dependent Dye Uptake via Electroporation 174
5.5.2
Improvement of Uptake Efficiency by Applying Sequential Pulses 177 5.5.3
5.5.3.1 Dye Uptake Study with FITC-Labeled Dextrans 177
5.5.3.2 Enhanced Uptake of Bioactive Molecules 179
Gap Junctional Intercellular Communication Studies Based on Electroporation 186 5.5.4
5.5.4.1 Electroporation in Absence of Calcium 187
5.5.4.2 Inhibition of GJIC between NRK Cells Using 2-APB 190 5.5.4.3 Dye Uptake Study to Analyze the Effect of Recovery Time on Uptake Efficiency 195
5.5.4.4 Modification of the Electrode Layout 200
5.5.4.4.1 Circular Gold-Film Electrode Layout (8W4E-micro) 200
5.5.4.4.2 ITO Electrode Layout 201
5.5.4.4.3 1st and 2nd Generation Gold-Film Electrode Layout 206 5.5.4.5 Quantification and Dye Transfer Analysis Using 8W4E-GJ Electrode Layout 210 5.5.4.5.1 Dye Transfer after Single and Two-Pulse Electroporation 211 5.5.4.5.2 Studying the Influence of 2-APB and Calcium 214
Discussion 217
5.6
Improved Electroporation Efficiency by Two-Pulse Electroporation 217 5.6.1
Assay Development for Gap Junctional Intercellular Communication Screening 220 5.6.2
5.6.2.1 Requirements for the Model Cell System 220
5.6.2.2 Protocol Optimization for the Opto-Electrical Assay 222 5.6.2.3 Electrode Layout Development for the Study of Gap Junctional Intercellular
Communication 228
5.6.2.4 Comparison with Common Techniques 230
Summary 232
5.7
Outlook 233
5.8
6 STUDYING THE IMPACT OF SILICA PARTICLES ON CELL PHYSIOLOGY USING MULTIMODAL, LABEL-FREE BIOSENSORS 235
Introduction 236
6.1
Objective 240
6.2
Materials and Methods 241
6.3
Determination of the Zeta Potential 241
6.3.1
Microscopic Analysis 241
6.3.2
6.3.2.1 Time-of-Flight Secondary Ion Mass Spectrometry (ToF-SIMS) Analysis 241
6.3.2.2 Scanning Electron Microscopy (SEM) 242
6.3.2.3 Transmission Electron Microscopy (TEM) 242
Protocols for Impedimetric Measurements 242
6.3.3
6.3.3.1 Sequence of Impedimetric Assays to Analyze Acute Toxicity, Motility and Cell
Migration 242
6.3.3.2 Impedimetric Sequence to Analyze Acute Toxicity in Serum-Free and Serum
Containing Medium 243
6.3.3.3 Silica Particle Uptake in Absence or Presence of DMA 243 6.3.3.4 ECIS Monitoring of Particle Uptake Dependent on Surface Charge 243
6.3.3.5 RTC Measurements to Analyze Cell Motility 244 6.3.3.6 Microscopic and Impedimetric Wound Healing Study in Absence or Presence of
Silica Particles 244
6.3.3.7 ECIS-Based Analysis of Cell Proliferation 245
Label-Based Assays 245
6.3.4
6.3.4.1 DAPI Staining to Analyze Cell Proliferation 245
6.3.4.2 PrestoBlue® Assay to Analyze Cellular Proliferation 245
6.3.4.3 PrestoBlue® Assay to Analyze Cytotoxicity 246
Analysis of Gap Junctional Intercellular Communication 247 6.3.5
6.3.5.1 Scrape Loading Assay 247
6.3.5.2 Parachute Assay 247
6.3.5.3 Fluorescence Recovery after Photobleaching (FRAP) Assay 248 6.3.5.4 Study of Gap Junctional Intercellular Communication in Presence of Silica
Particles Based on Electroporation 249
Studies with Cardiomyocytes to Analyze the Influence of Silica Particles 250 6.3.6
6.3.6.1 Materials Used for the Cardiomyocyte Project 250
6.3.6.2 Thawing and Seeding Protocol for Cor.At® Cells 250 6.3.6.3 Highly Time-Resolved Impedimetric Measurements to Detect Synchronous
Beating of Cardiomyocytes 251
Influence of Silica Microparticles on Mammalian Cells 252 6.4
Physicochemical Characterization of Silica Microparticles 252 6.4.1
Analysis of Particle Uptake into NRK cells 255
6.4.2
6.4.2.1 Staining Methods 255
6.4.2.2 Uptake Studies Using Scanning Electron Microscopy (SEM) 258 6.4.2.3 Uptake Studies Using Transmission Electron Microscopy (TEM) 259
6.4.2.4 ToF-SIMS Analysis 260
Impedimetric Monitoring of the Uptake of Silica Particles 263 6.4.3
6.4.3.1 Concentration-Dependency of the Spikes in the Impedance Signal 265
6.4.3.2 Particle Uptake Dependent on Surface Charge 266
Sequence of Impedimetric Assays to Analyze the Biocompatibility of Silica 6.4.4
Particles 268
6.4.4.1 Acute Toxicity 268
6.4.4.2 Silica Particle Impact on Cell Motility 270
6.4.4.3 Impedimetric Wound Healing Assay to Analyze the Impact of Silica Particles
on Cell Migration 272
Long-Term Analysis of Silica Particles’ Cytotoxicity in Serum-Free and Serum- 6.4.5
Containing Medium 275
Analysis of Cell Proliferation 276
6.4.6
6.4.6.1 Studying the Impact of Silica Particles on Cell Proliferation Using ECIS 276 6.4.6.2 Studying the Impact of Silica Particles on Cell Proliferation Using an
Optical Assay 280
6.4.6.3 Studying the Impact of Silica Particles on Cell Proliferation Using the PrestoBlue®
Assay 281
Influence of Silica Particles on Gap Junctional Intercellular Communication 283 6.4.7
6.4.7.1 Classical Assays to Study Gap Junctional Intercellular Communication 283 6.4.7.2 Analysis of the Impact of Silica Particles on Gap Junctional Intercellular
Communication Using the Developed Opto-Electrical Assay 288 6.4.7.2.1 Electroporation of NRK Cells Pre-Loaded With Silica Particles 288 6.4.7.2.2 Analysis of Cell Attachment and Response to the Addition of Silica Particles to a Confluent Cell Layer Prior to the Opto-Electrical Assay 291 6.4.7.2.3 Dye transfer Analysis to Investigate the Influence of Silica Particles on Gap
Junctional Intercellular Communication 292
Studying the Beating of Cardiomyocytes Using ECIS 296 6.5
Beating Analysis Based on RTC Measurements 296
6.5.1
Modulation of the Periodic Beating of Cardiomyocytes 302 6.5.2
Impact of the Gap Junctions Inhibitor 1-Heptanol on Beating Cardiomyocytes 309 6.5.3
Impact of Silica Particles on the Periodic Beating of Cardiomyocytes 311 6.5.4
Discussion 315
6.6
Uptake into Mammalian Cells 315
6.6.1
Determination of Toxicity of Nanoparticles Using Label-Free and 6.6.2
Label-Based Techniques 320
Impact of Microparticles on Cell Migration 324
6.6.3
Impact of Microparticles on Cell Proliferation 326
6.6.4
Analysis of Gap Junctional Intercellular Communication in Presence 6.6.5
of Microparticles 329
Impact of Microparticles on Beating Cardiomyocytes 333 6.6.6
Multi-Dimensional Analysis to Characterize Biocompatibility of Microparticles 339 6.6.7
Summary 343
6.7
Outlook 345
6.8
7 SUMMARY 347
8 ZUSAMMENFASSUNG 349
9 APPENDIX 351
Abbreviations and Symbols 352
9.1
Supplementary Figures 358
9.2
Materials and Instrumentations 368 9.3
Software 372
9.4
10 REFERENCES 375
11 DECLARATION 404
1 Label-Free Cell-Based Biosensors
In former times, living animals were used to detect dangerous gases e.g. canaries were taken into coal mines since 1911 to alert the coal miners about an increase in carbon monoxide or methane concentrations. Canaries are able to detect lower concentrations of toxic gases compared to humans. Their signal – termination of their loud chirp and falling down from their perch – clearly indicated the workers a high toxic gas concentration at the ground and initiated the workers to exit quickly the coal mines. Finally, modern portable electronic gas sensors were favored over the canaries and replaced the birds to detect harmful gases in mines a.
Today, a huge variety of different biosensors are known, which are applied to detect environmental pollutants 1, 2, for agricultural monitoring 3, 4, for medical analysis 5, 6, to control food quality and safety 7, 8 or in drug development 9, 10 (Fig. 1.1 A).
ahttp://news.bbc.co.uk/onthisday/hi/dates/stories/december/30/newsid_2547000/2547587.stm
Fig. 1.1: A: Applications of biosensors in daily life. B: Schematic principle of a biosensor: A sensoric device is connected to a transducer which converts the response of the biological sensor to a specific analyte into a measureable parameter e.g. voltage or current. In biosensoric applications the sensoric device consists of a biological element like nucleic acids, antibodies, enzymes or even whole cells or tissues.
Transducer Sensor Analytes
Signal
Nucleic Acids
Cells
Antibodies
Enzymes Acoustical Electrochemical Optical Mechanical Chemical Stimuli Biological Stimuli Physical Stimuli
A B
Medical Applications
Food Industry
Drug Development
Environment &
Agriculture
Development of biosensors is a promising part of research in the field of analytical biology.
Therefore, biosensors were rapidly established and combined with modern principles like nanotechnology 11 or biomimetic approaches 12, especially molecularly imprinted polymers to generate e.g. artificial receptors or antibodies 13. The term biosensor describes the assembly of a biological sensoric device, like enzymes, antibodies or even whole cells, connected to a transducer, which later provides bioanalytical information after detecting a specific analyte (Fig. 1.1 B). If the biological sensing device consists of living cells - accordingly the biosensor belongs to the group of cell-based biosensors - the biological response of cells after exposure to a certain analyte is converted via a transducer into an electrical, acoustical, optical or mechanical signal.
A huge variety of proliferating cell lines originating from different tissues and species are commercially available in cell culture collections, like American Type Culture Collection (ATCC) or Deutsche Sammlung von Mikroorganismen und Zellkulturen GmbH (DSMZ).
Beyond the established cell lines, genetic modifications allow to develop cells which over- express e.g. a specific target receptor, ion channel or reporter gene. Cell-based biosensors are regarded as an intermediate between complex testing in living animals and simple molecular assay system. Using established cell lines or genetically modified cells as recognition elements in the cell-based assays, allows an analysis of enzymes, receptors or ion channels in their natural environment without extracting material from living cells.
Therefore, they allow to analyze the response of living cells to the addition of a certain analyte in a physiological environment 14.
Cell-based biosensors provide a high selectivity as well as rapid responses to physical, or chemical stimuli 15, 16. Advantageously, they offer a cheap sensing device 14 and a longer life time compared to enzymatic sensors however, they are limited to the life time of the cells. An ECIS-based toxicity sensor was developed for the US Army in which rainbow trout gill epithelial (RTgill-W) cells are used to detect chemical contamination of drinking water 17. The fluidic ECIS sensing chip with an established monolayer of RTgill-W cells could be stored at 6 °C for up to 78 weeks without any impact on cell viability 18.
As living cells are immobilized to the surface of the transducer and serve as sensing element, natural environmental conditions are necessary to perform analysis with whole cell biosensors 19. Therefore, cells have to grow on the transducer surface 20-22 and require special surface characteristics regarding roughness and hydrophilicity 14.
Biosensors for Analysis of Cell Metabolism and Cell 1.1
Morphology
Ion-selective field-effect transistors (ISFET) and light addressable potentiometric sensors (LAPS) provide label-free techniques which are suitable to detect and analyze the metabolism of living cells. These promising approaches can analyze changes in pH value or other specific ion concentrations and are both based on the semiconductor technology. Small changes in cell morphology after addition of a certain analyte can be observed either using an optical approach like surface plasmon resonance (SPR), a mechanical biosensing technique like quartz crystal microbalance (QCM) or an electrochemical biosensor based on impedance spectroscopy like electric cell-substrate impedance sensing (ECIS). In the following, these different label-free cell-based biosensor techniques (Fig. 1.2) are characterized regarding their ability to detect changes in the metabolism of cells (A, B) or to analyze cellular responses after recognition of an analyte resulting in cell morphology alterations (C – E).
Fig. 1.2: Survey of different whole-cell based biosensors. Schematic illustration of two metabolic cell-based biosensors: ISFET (A) and LAPS (B) which are both based on the semiconductor technology. C – E illustrate cell-based biosensors to monitor surface coverage and changes in cell morphology using an optical (C), mechanical (D) or electrochemical approach (E). SPR (C) detects changes in refractive index near the gold surface, whereas QCM (D) is applicable to monitor changes in mass loading and viscoelastic properties. Electric impedance spectroscopy (E) is sensitive for small changes in cell shape due to the fact that the cells behave like insulating particles and force the current to flow around the cell bodies. VG: gate voltage, VDS: voltage between drain and source, ID: drain current, Vbias: dc bias voltage, Iph: photocurrent, RE: reference electrode, WE:
working electrode, CE: counter electrode. Scheme of QCM principle was kindly provided by M. Oberleitner.
RE
Laser p-Si
SiO2
Vbias
Electrolyte
- H+ CO2 Lactic Acid
- - Depletion Layer A
Iph
Cell-Based Biosensors
(C) SPR (D) QCM (E) Impedance
(B) LAPS
Quartz Electrolyte
Ion Selectiv e Material
Plasmon Wave
Au Surface Glass Prism
Detector Light Source
Electrolyte
Z(f)
WE CE
Electrolyte RE
p-Si
Electrolyte
Source n+ Channel
Drain n+ Ion Selective Material VG
VSD ID
Gate Insulator
(A) ISFET
Insulator
(A) Ion-Selective Field-Effect Transistor (ISFET)
Ion-selective field-effect transistor (ISFET) is one of the most popular electrical biosensors.
Bergveld (1970) focused on neurophysiological measurements based on FET technology 23 and later in 1991 Fromherz et al. applied cell-based ISEFTs to detect action potentials of neurons 24.
The general setup of a field-effect transistor consists of a metal gate as well as one source and drain region, separated from each other by a short channel which is covered by the gate insulator. The material of the gate insulator in most cases is SiO2. In ISFET applications the metal gate is replaced by a reference electrode, an ion-selective membrane and an electrolyte. Optionally, a second layer of Si3N4, Al2O3 or Ta2O5 as a pH sensitive layer is added 25. In Fig. 1.2 A a n-channel ISFET is schematically shown where a n-doped source and n-doped drain was introduced into a p-doped Si chip. By applying a positive gate voltage (VG) with respect to the p-doped Si chip a carrier-depletion region is created under the gate and electrons are detracted from the substrate into the channel region. If sufficient electrons are induced by VTH (threshold voltage) under the gate an electrically conducting channel between source and drain is generated. By applying a voltage between drain and source (VDS) current can ancillary flow via the mobile electrons through this n-channel. The detectable current flow ID in ISFET biosensors is influenced by the presence of charged biomolecules, pH values or other ions on the sensor surface and is recorded as a function of VG 26
. During cellular metabolism acidic products are generated like CO2, H+ and lactic acid that induce a change in pH value of the cellular environment which can be monitored by ISFET 27. They change VG and therefore, increase or decrease the depletion zone, which leads to a change in current flow. Accordingly, ISFETs can be applied to monitor changes in charge densities and a variety of different biological samples including enzymes 28, DNA 29 or cells 30 are successfully applied as bio-recognition element to enhance sensitivity and specificity of the biosensoric device. In the following the introduction will only focus on cell- based ISFETs - living cells are used as recognition element - which seem to be a promising technology for pharmacological and biomedical applications 31. Applications of cell-based ISFETs mainly focus on measuring extracellular acidification as protons are known to be an important regulator in living cells 21. Due to the fact that living cells respond with activation or inactivation of several, different pathways after the addition of external stimuli, the development of ISFET based sensors focus on non-invasive detection of multiple parameters
25. One example of online and non-invasive recording of different parameters was published by Baumann et al. (1999) using a so-called cell monitoring system (CMS) 32. Lehmann et al.
(2001) measured the acidification and respiration of adherent cells in real-time using an
ISFET based sensor 33. Another important application of ISFETs is to detect extracellular and intracellular potentials in electrogenic cells like neurons 24, 34 or cardiac myocytes 35, 36.
(B) Light Addressable Potentiometric Sensor (LAPS)
A second potentiometric semiconductor device, which is commonly used as cell-based biosensor, is the light addressable potentiometric sensor (LAPS). It was first described in 1988 by Hafeman et al. 37 and further improved in the following years to achieve better sensitivity, stability as well as biocompatibility. LAPS enables to monitor any event which influences the surface potential, like changes of ion concentrations 38, redox effects 39 and especially in cell-based approaches extracellular acidification and changes in pH value of living cells caused by cellular metabolism 27.
The setup consists of an electrolyte-insulator-semiconductor (EIS) structure e.g.
Si/SiO2/Si3N4 in contact with an electrolyte containing buffer, an additional reference electrode on the side of the insulator surface and an ohmic contact on the back side. The additional layer of Si3N4 is introduced into the LAPS device due to the higher sensitivity towards H+. In contrast to ISFET, where the entire insulating layer serves as sensing surface, the sensing spots in the LAPS device are defined by illumination with a modulated light source 40. By applying an external dc bias voltage (Vbias) a depletion layer is generated under the gate insulator. When the modulated light source, with appropriate photon energy, illuminates single spots of the LAPS chip from the backside charge carriers in the semiconductor layer are created 21. In the depletion layer, electrons further move towards the silicon bulk whereas holes accumulate at the silicon insulator interphase 41. Accordingly, the detectable photocurrent (Iph) is dependent on Vbias, on the local surface potential which is dependent on the ion concentration as well as on the illumination 21. Changes of pH value or of a specific analyte on the sensing surface can be detected either in constant-voltage or constant-current mode. The first detects the ac photocurrent (Iph) as a function of time and position by using a constant Vbias and the second records Vbias time-dependently while keeping Iph constant 40. LAPS is not only applicable to the detection of H+ but also sensitive to a variety of substances including heavy metal ions 42, alkali and alkaline earth metal ions 43 by modifying the sensor surface and implementing an ion selective membrane.
In conclusion, LAPS as biosensor is applied in many studies regarding cell biology or pharmacology to monitor ligand-receptor interactions and signaling mechanism 44-47, to detect excitable cells like neurons 48, 49, or to study the influence of drugs on cardiomyocytes 50, 51. Further development of LAPS as biosensor evolve into multi LAPS applications, which allow
simultaneous detection of H+, Na+, K+ and Ca2+ by using different sensitive membranes which are introduced at separated areas on a single LAPS surface 52-54.
The remaining methods in the survey (Fig. 1.2), surface plasmon resonance (SPR), quartz crystal microbalance (QCM) and impedance based setups like electric cell-substrate impedance sensing (ECIS) are applicable to detect cell morphology changes and changes in sensor surface coverage.
(C) Surface Plasmon Resonance (SPR)
SPR is an optical technique which is widely applied to study bimolecular interactions on the sensor surface. SPR uses the establishment of an evanescent field under total internal reflection of an incident light beam. The generation of an evanescent field excites surface plasmons in the adjacent thin gold layer. The conditions of total internal reflection depend on the wavelength of the polarized light, the angle of incidence and the refractive index near the gold surface. The SPR setup consists of a polarized light source, a high refractive index prism covered with a thin metal layer mostly gold and a CCD chip to detect the reflected light.
When resonance conditions are fulfilled surface plasmon waves are generated near the gold surface and the evanescent field can subsequently penetrate into adsorbed material for instance adherent cells on the gold surface. The penetration depth of SPR using visible light is below 200 nm 22.
SPR measurements can be performed by measuring changes in reflectivity, which is the intensity of the reflected light, at a constant angle of incidence (kinetic measurement type) or by detecting the angle of minimum reflectivity (angle scan mode). In cell-based biosensor applications mammalian cells are cultured on top of the gold surface and cellular response to external stimuli can be measured by SPR. Accordingly, SPR offers a label-free technique to monitor changes in cell-substrate interactions, however it is not suitable to detect changes, processes or interactions of materials which occur deeper in the cells. SPR technique was successfully applied to detect cell adhesion on the gold surface 55, changes inside cell morphology 56-58 or cellular responses caused by intracellular signaling 59, 60. In conclusion, SPR provides a label-free and non-invasive method to detect changes which occur near the sensor surface with a high time resolution.
(D) Quartz Crystal Microbalance (QCM)
QCM is an acoustic technique to study cell-surface interaction and cellular response in a label-free and non-invasive manner. The core component is a piezoelectrical quartz resonator which can be excited to perform mechanical shear oscillations parallel to the crystal surface 22. The piezoelectric effect was first described by J. and P. Curie in 1880 who monitored electrical polarization e.g. in quartz after applying mechanical stress and detected a voltage which is proportional to the applied stress 61. The linear relation between the resonance frequency shift of a sensor crystal to the change in mass on the quartz surface was established by Sauerbrey, as long as the material on the quartz surface behaves like a rigid material 62. A further step towards application of QCM as biosensor was done by Nomura and Okuhara who first performed QCM in liquid environment in 1982 63. The basic component of a QCM consists of a thin circular piezoelectric AT-cut -quartz disk sandwiched between two gold electrodes. One electrode is located on each side of the quartz and allows the application of an external alternating electric field. Due to the piezoelectric properties of the -quartz any mechanical deformation causes an electrical potential difference at the quartz surface and vice versa 64. After applying an oscillating potential difference the piezoelectric quartz starts to perform mechanical shear oscillations at the resonator’s resonance frequency which is influenced by the adsorbed mass on the sensor surface as well as by changes in viscosity of the liquid 65. For adherent cells on the quartz surface, which behave like viscoelastic bodies, the linear relation between frequency change and adsorbed mass is no longer valid 66. Nevertheless, QCM offers the advantage of being non-invasive and provides information about surface-near processes of the cell. For a 5 MHz quartz resonator the decay length of the shear-wave in water is ~ 250 nm at RT 67. In conclusion, the QCM technique is a powerful label-free technique to monitor the response of adherent cells to chemical, physical and biological stimuli in their environment after adhesion on the quartz surface. Therefore, this technique was successfully applied to detect cell adhesion 68-71, cellular response to different drugs 72, 73, changes in their environment like osmolarity 74 or addition of cytotoxic compounds 75, 76.
(E) Impedance Spectroscopy
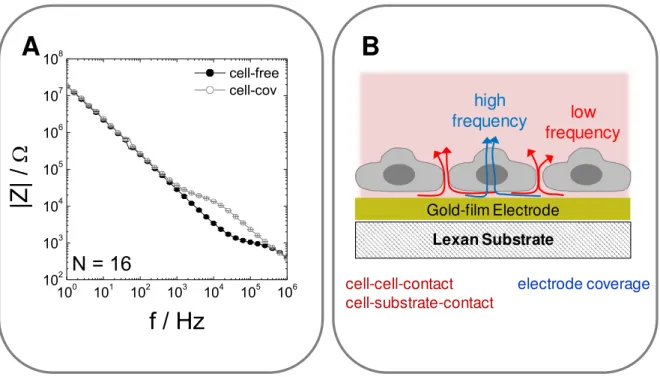
Impedance spectroscopy as an electrochemical approach in cell-based biosensors can be realized in different setups. Cells can be cultivated on porous filter membranes, whereas one electrode is located above and one below the cell layer or cells are directly grown on top of the electrodes, which serve as culture substrate for anchorage-dependent cells. The latter principle is the basis of electric cell-substrate impedance sensing (ECIS) which was introduced by Giaever and Keese in 1984 77. This technique provides a promising tool for studying cell surface interactions and changes in cell morphology by measuring the electrical impedance. The measurement principle will be introduced in more detail later (chapter 3.3).
In this setup, adherent cells are cultured on two co-planar gold-film electrodes. The cells behave like dielectric particles and the current is forced to flow around and through the cells.
Therefore, even small changes in cell shape can be recorded and analyzed with high sensitivity in the impedance signal. To summarize all advantages and limitations of ECIS, it provides a label-free and non-invasive method to detect cellular processes like cell migration and cell vitality or even small micromotion of cells with high time-resolution. The experiment can be performed automatically and up to date 96 different wells can be monitored simultaneously. The electrochemical principle is limited to conducting and electrochemically well-behaved electrode materials like gold or indium tin oxide.
Biological Phenomena Monitored with Cell-Based Biosensors 1.2
Label-free biosensors monitor responses of whole cells to a certain stimulus or to changes in their environment with high time resolution and in a non-invasive way 78. Fig. 1.3 shows a survey of different cellular events which can be monitored by whole cell biosensors in a label- free manner.
Cell-based biosensors can monitor cellular responses after binding of an analyte to a membrane-bound receptor which finally causes a certain cellular response (A). Wegener et al. (1999) used a confluent monolayer of bovine aortic endothelial cells (BAEC) grown on gold-film electrodes to monitor -adrenergic stimulation with impedance measurements 79. Yu
Fig. 1.3: Survey of different biological applications of label-free whole-cell based biosensors: Cell signaling after ligand binding to a membrane-bound receptor which activates cellular cascades subsequently inducing a cellular response (A). Monitoring of cell adhesion and cell spreading on the biosensor surface (B) or the analysis of cytotoxicity after introducing external stimuli like (nano-) particles or pharmaceutical drugs (C). Analysis of cellular proliferation (D), collective cell migration (E) or the establishment of barrier function between cells hindering substances to diffuse on paracellular pathways (F).
Cell-Based Biosensor
(B) Cell Adhesion
(E) Cell Migration
(D) Proliferation
(C) Cytotoxicity (F)
Barrier Function
(A) Cell Signaling
Cellular Response
et al. (2006) described a non-invasive and label-free technique based on impedance recordings to study morphological changes due to histamine stimulation of GPCR signaling pathways using H1/CHO cells 80. Fang et al. (2007) used a resonant waveguide grating (RWG) biosensor to record GPCR ligand induced changes in dynamic mass redistribution (DMR) of adherent human epidermoid carcinoma cells by ATP or thrombin 81. Goral et al.
(2011) 82 developed a whole-cell based RWG biosensor with microfluidics, which controls the exposure of the agonist, to monitor changes in DMR of A549 cells. Addition of thrombin to A549 cells stimulates protease activated receptor-1 (PAR1) signaling and subsequent causes pro-inflammatory responses and disruption of endothelial barrier 83.
A second approach of cell-based biosensors is the analysis of cell adhesion and cell spreading on the biosensor surface (B) as it is important for cell survival. These studies support our knowledge about the adhesion process which might be necessary for development and optimization of biomaterials e.g. medical applications 22. Impedimetric biosensors allow to monitor the kinetics of cell attachment in real-time as already demonstrated in 1984 by Giaever and Keese who detected attachment and spreading of fibroblasts on gold-film electrodes by means of the impedance signal 77. Wegener et al.
(2000) demonstrated that impedance recordings are suitable to detect increasing electrode surface coverage with MDCK II cells on different protein coatings in particular by analyzing the capacitance at high frequency 84. Angstmann et al. (2011) employed a non-invasive impedance-based assay to monitor cell adhesion and cell differentiation of mesenchymal stromal/stem cells which can be a promising tool for therapeutic applications 85. Holmes et al.
(1997) applied SPR technique to study differences in adhesion and binding of Staphylococcus epidermis and Staphylococcus aureus on fibronectin coated surfaces and found different interactions with fibronectin fragments for both bacteria 86. Adhesion and spreading of baby hamster kidney (BHK) cells was monitored using optical waveguide light mode spectroscopy in a study of Hug et al. (2001) 87. Fang et al. investigated cell attachment and spreading by using a RWG biosensor and analyzed the effect of vincristine - a plant alkaloid which inhibits microtubule assembly and binding to tubulin - on attachment of A431 cells on the sensor surface 88. QCM is a promising tool to monitor cell attachment on the quartz surface as it is correlated to an decrease in resonance frequency depending on surface coverage 22. Different groups applied QCM for detecting cell attachment with high time resolution of e.g. MDCK cells and murine 3T3 fibroblasts 69, MKE cells and CHO cells 89 as well as detachment of African green monkey kidney cells induced by chemicals or virus infection 90. Marx et al. utilized QCM to investigate biologically active drugs which alters cellular attachment and spreading by recording the response of adherent cells on the addition of cytoskeleton binding drugs nocodazole and taxol 72.
Further studies address the effect of external stimuli like pharmaceutical drugs, (nano)- particles or cytotoxic agents on anchorage-dependent cells using cell-based biosensors which provide a promising tool in drug development and discovery (C). Cell response after the addition of a certain stimulus is characterized by an integrative or holistic signal without any molecular information about the mechanism 7891. Arndt et al. (2004) analyzed the effect of apoptosis induced by cycloheximide on confluent micro-vessel endothelial cells cultured to confluence on gold-film electrodes using impedance analysis 92. A similar study was performed by Solly et al. (2004), who induced apoptosis in human ovarian cells (A2780) by introducing doxorubicin and detecting cell response by real-time cell electronic sensing (RT- CES) technology which is based on impedance recordings 93. Curtis et al. (2009) used cell- based impedance sensing to detect toxicity of drinking water in a portable automated and long-term stable fluidic device. This setup allows the detection of toxins in drinking water over several months using bovine pulmonary artery endothelial cells or bovine lung microvessel endothelial cells 94. Liu et al. (2009) used a chip with a micro-electrode array and impedance spectroscopy to detect the chemosensitivity of human oesophageal cancer cell line (KYSE30) after the addition of the anti-cancer drug cisplatin (10 – 50 µM) 95. The research on nanoparticle synthesis as well as the evaluation of their biological hazards has received considerable attentions over the last years. Therefore, some studies were performed with different nanoscale materials regarding cytotoxicity using cell-based biosensors. Hondroulis et al. (2010) applied the electrical impedance sensing system (EIS) to monitor the cytotoxic time profiles of nanoparticles made of gold and silver as well as single walled carbon nanotubes (SWCNTs) with CCL-153 and RTgill-W1 cells 91. Tarantola et al. (2011) provided an in vitro toxicity study of spherical and rod-like gold nanoparticles using a double biosensor approach of QCM and ECIS which pointed to a higher toxicity of spherical-shaped compared to the rod-shaped nanomaterial 96.
A cell-based biosensor also provides high sensitivity to monitor cell proliferation and thus increasing cell coverage of the sensor surface (D). Wodnicka et al. (2000) investigated cell proliferation using a novel fluorescent Oxygen BioSensor technology platform where a continuous real-time detection of dissolved oxygen concentration was realized based on the quenching effect of Ru(DPP)3Cl2 by oxygen. The oxygen-permeable sensor was placed at the bottom of multi-well plates. A good correlation between cell number and the fluorescence signal was found for prokaryotic and eukaryotic cells 97. Yun et al. (2010) impedimetrically monitored proliferation of osteoblasts (U2-OS) under different magnesium ion concentrations (0 – 200 mM) using interdigitated electrodes and found a moderate inhibition of cell proliferation in absence of Mg2+ and for Mg2+-concentrations above 5 mM 98. Biosensor applications are not limited to mammalian cells but also applicable for detecting bacterial growth of Escherichia coli on the sensing surface by analyzing the shift in resonance
frequency of a micromechanical oscillator 99. Therefore, it is suitable to perform a rapid antibiotic susceptibility screening 100.
Collective cell migration (E) is essential in many biological processes and many assays were developed to further characterize wound healing or cell migration 101. Beyond many microscopic and optical assays, also some cell-based biosensors are available to monitor migration of adherent cells. The first impedimetric migration study was published in 1997 by Noiri et al. studying the migration of endothelial cells over 20 h after electropermeabilization with direct current (dc) 102. This was further improved by Keese et al. (2004) who described a highly reproducible approach where a defined wound is created in a confluent cell layer by applying a high voltage pulse to cells on a gold-film electrode followed by real-time monitoring of cellular migration into the wounded area. The authors provided several ECIS recordings to characterize the migratory behavior of different adherent cell lines 103. Other studies used impedance recording after electrical wounding of adherent cells to investigate the influence of ADAM (a disintegrin and metalloproteinase) family enzymes to cellular migration of colonic epithelial cells 104 or to study the impact of EPLIN- (epithelial protein lost in neoplasm) expression on migration of breast cancer cells 105. Fang et al. (1998) analyzed the migration of human keratinocytes in dc electric fields in terms of the effect of extracellular calcium and growth factors 106 as well as the influence of epidermal growth factor receptor (EGFR) kinase activity 107. Another strategy was used by Wang et al. (2008) who established self-assembled monolayers (SAMs) on the electrode surface which inhibit cell adhesion on the surface. After applying a dc pulse to destroy the SAMs, cells start to migrate onto the electrode which is analyzed by impedance recordings and allows a quantitative comparison of migration speed of different cell lines 108.
Label-free biosensors are useful to further study the complexity of cell barrier function (F) of e.g. blood-brain barrier or epithelial cell barrier. The most applicable technique to determine and measure the electrical resistance and the permeability of the blood-brain barrier is to impedimetrically monitor the transepithelial electrical resistance (TER) 109. Hartmann et al.
(2007) analyzed the influence of endogenous extracellular matrix (ECM) derived from glia or non-glia cells on cell barrier properties of cerebral endothelial cells which were grown on gold-film electrodes 110. Seebach et al. (2000) investigated the effect of shear stress on epithelial barrier function upon applying varying laminar fluid shear stresses (0.5 dyn/cm2 - 50 dyn/cm2). They used an impedance based setup and found a shear-stress-dependent upregulation of the TER 111. To further support the understanding of drug development and drug delivery Rempe et al. (2011) used modified nanoparticles which are able to overcome the blood-brain barrier and analyzed their influence on the TER of porcine brain capillary endothelial cells grown on filter inserts 112. The well-known effect of hydrocortisone on cell
barrier function was analyzed impedimetrically by Weidenfeller et al. (2005) using primary cultured mouse brain endothelial cells adherently grown on gold-film electrodes as well as on permeable filters to determine the TER 113. A miniaturized impedance biosensor was established by Sun et al. (2010) and measured the disruption of epithelial barrier of a human bronchial epithelial cell line by increasing the concentration of EGTA (ethylene glycol-bis(2- aminoethyl-ether)-N,N,N’,N’ tetraacetic acid) 114. A dual biosensor surface, consisting of an electrical and an optical biosensor, was described by Michaelis et al. (2013), to achieve multi parametric cell profiling. They combined impedance recordings with SPR and analyzed simultaneously the response of confluent MDCK II cells grown on a sensor chip upon addition of 5 µM cytochalasin D with both techniques 115 showing disruption of actin cytoskeleton and barrier forming cell-cell contacts 116.