Development and application of analytical tools to study the origin, fate and impact of the
oncometabolite 2-hydroxyglutarate and its lactone
DISSERTATION ZUR ERLANGUNG DES DOKTORGRADES DER NATURWISSENSCHAFTEN (DR. RER. NAT.) DER FAKULTÄT CHEMIE UND
PHARMAZIE DER UNIVERSITÄT REGENSBURG
vorgelegt von
Raffaela Sarah Bergeraus Rotthalmünster
im Jahr 2019
II
Promotionsgesuch eingereicht am: 19.09.2019
Die Arbeit wurde angeleitet von: Prof. Dr. Peter J. Oefner
III
IV
„Der sicherste Weg zum Erfolg ist immer, es doch noch einmal zu versuchen. „
(Thomas Alva Edison)
Table of Content
1
1 Table of Content
1 Table of Content ... 1
2 Abbreviations ... 3
3 Objectives ... 5
3.1 Elucidate the mechanism of 2-HG-lactone formation ... 5
3.2 Investigate the metabolic fate of 2-HG and 2-HG-lactone ... 7
3.3 Analytical objectives ... 7
4 Background ... 9
4.1 IDH1/2 mutation and 2-hydroxyglutarate ... 9
4.2 Aspects of enzymology ... 13
4.3 Metabolomics by hyphenated MS-techniques ... 16
4.3.1 Overview ... 16
4.3.2 Quantitative targeted MS-analysis ... 19
4.3.3 Analysis of 2-HG in biological samples ... 21
4.3.4 Flux/tracing analysis ... 25
5 Methods and Material ... 28
5.1 Materials ... 28
5.2 Biological samples ... 28
5.2.1 Cell culture ... 28
5.2.2 Serum samples ... 29
5.2.3 Glioma tissue samples ... 30
5.3 Enzyme assays ... 30
5.4 MS-sample preparation ... 31
5.4.1 Methanol precipitation and sample extraction ... 31
5.4.2 Derivatization for GC-analysis ... 32
5.4.3 PCF-derivatization for amino acid analysis ... 32
5.5 MS methods ... 33
5.5.1 2-HG/-lactone quantification by HPLC-MS/MS ... 33
5.5.2 Amino acid quantification and tracer analysis by HPLC-MS/MS ... 33
5.5.3 Organic acid quantification by GC-EI-MS ... 34
Table of Content
2
5.5.4 Organic acid tracer analysis ... 35
5.5.5 Enantioselective analysis of D-/L-2-HG ... 36
5.6 LysoTracker staining ... 37
5.7 Miscellaneous ... 37
5.8 Statistics ... 38
6 Quantitative analysis of 2-HG/-lactone ... 39
6.1 Development and validation of a quantitative LC-MS/MS method ... 39
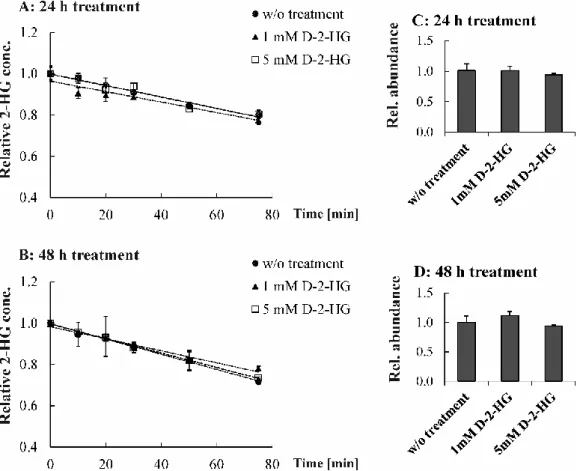
6.2 Enzymatic assay to measure degradation of D-2-HG ... 41
7 Strategies for chiral analysis of 2-HG/-lactone ... 47
8 Investigating metabolism in mutIDH1/2 cells by tracer analysis ... 53
8.1.1 GC-APCI-TOF-MS for tracer analysis ... 53
8.1.2 2-HG is the endogenous precursor of its lactone ... 58
8.1.3 Tracer analysis in HCT116 cell panel ... 60
8.1.4 Mutant IDH1/2-related effects on cellular metabolism ... 65
9 Origin and fate of 2-hydroxyglutarate-lactone ... 72
9.1 2-HG and -lactone in various biological specimens ... 72
9.2 2-HG-lactone formation is independent of IDH1/2 mutation ... 75
9.3 Impact of pH on 2-HG-lactone formation ... 77
9.4 Investigations on lysosomes in context of 2-HG-lactone formation ... 79
9.5 Does 2-HG-lactone formation involve an enzyme? ... 81
9.6 2-HG-lactone formation in cell homogenates ... 85
9.7 2-HG and its lactone are two distinct metabolites ... 86
10 Conclusions and Perspectives ... 90
11 References ... 92
12 Supplement ... 104
12.1 Supplemental Figures ... 104
12.2 Supplemental Tables ... 107
13 Publications and Presentations ... 115
14 Summary ... 116
15 Zusammenfassung ... 117
Abbreviations
3
2 Abbreviations
2-HG 2-Hydroxyglutarate
α-KG α-Ketoglutarate
Ala Alanine
AML Acute myeloid leukemia
APCI Atmospheric pressure chemical ionization
Arg Arginine
Asn Asparagine
Asp Aspartate
CE Capillary electrophoresis
D-/L-2-HGA D-/L-2-Hydroxyglutaric aciduria
D2HGDH; D2HDH D-2-Hydroxyglutarate dehydrogenase
Da Dalton
EI Electron ionization
EIC Extracted ion chromatogram
ESI Electrospray ionization
FCS Fetal calf serum
GC Gas chromatography
Glc Glucose
Gln Glutamine
His Histidine
IDH1/2, IDH1/2 Isocitrate dehydrogenase 1/2
IS internal standard
LC Liquid chromatography
LOD Limit of detection
(L/U-)LOQ (Lower/ upper) limit of quantification
m/z Mass-to-charge ratio
Abbreviations
4
MCT1/4; MCT1/4 Monocarboxylate transporter 1/4
MID Mass isotopomer distribution vector
MeOH Methanol
MeOx Methoximation
mutIDH1/2 Mutated IDH1/2
MRM Multiple reaction monitoring
MS Mass spectrometry
MS/MS Tandem mass spectrometry
NADP+/NADPH Nicotinamide adenine dinucleotide phosphate
(oxidized and reduced form)
(1H-)NMR(-spectroscopy) (Proton-)nuclear magnetic resonance (-spectroscopy)
PBS Phosphate buffered saline
PC Pyruvate carboxylase
PFPP Pentafluorophenyl propyl
PPP Pentose phoshphate pathway
Pro Proline
QqQ Triple quadupole
Ser Serine
TCA Tricarboxylic acid cycle
TIC Total ion current
TOF Time-of-flight
TMS Trimethylsilyl-moiety
WT Wild type
Objectives
5
3 Objectives
3.1 Elucidate the mechanism of 2-HG-lactone formation
This thesis was conducted within the framework of the KFO 262 “Tumor metabolism meets Immunology”, with special focus on the oncometabolite D-2-hydroxyglutarate (D-2-HG), which is produced by mutated isocitrate dehydrogenase IDH1/2 resulting in significantly increased concentrations of this metabolite.
At the Institute of Functional Genomics preliminary work was performed to measure 2-HG in different biological matrices.
IDH1/2 mutations are frequently identified ingliomas and in AML (acute myeloid leukemia), accompanied by increased D-2-HG levels in tissue and serum, respectively. Interestingly, in serum from AML patients not only D-2-HG was detected, but also a closely related metabolite, which had not been described so far. The novel metabolite is the intramolecular ester of D-2-HG and therefore named D-2-HG-lactone (IUPAC: R-5-oxotetrahydrofuran-2-carboxylic acid) (Figure 1).
Figure 1. Molecular structure of (R)-2-hydroxyglutarate and its lactone, (R)-5-oxotetrahydrofuran-2-carboxylic acid.
Initially, 2-HG-lactone was detected by chiral GC-MS as a product of the derivatization
of 2-HG with methyl chloroformate (MCF)
1. The presence of multiple 2-HG-derivatives
has already been described by others, e.g., by Duran et al. (1980) upon esterification
of 2-HG with S-2-butanol and acylation with acetic anhydride
2. However, while the ratio
of the two derivatization products remained stable in the case of standard samples, it
varied in AML serum samples (Figure 2). This led to the hypothesis that the lactone
was an endogenous metabolite. This was confirmed by LC-MS/MS and NMR analysis
of an underivatized serum extract.
Objectives
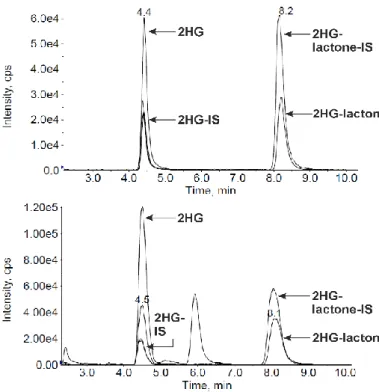
6 Figure 2. Chiral GC-MS analysis of a racemic D/L-2-HG standard (upper panel) and a serum sample of an AML patient carrying an IDH1/2 mutation (lower panel). For the standard sample, the area ratio of each enantiomer dervative of 2-HG-lactone (shown in black) to 2-HG (shown in red) was constant (4:1) across several measurements. In green and purple the respective stable isotope labeled internal standard is shown. For the exemplary AML serum sample, the ratio of D-2-HG-lactone/D-2-HG(-derivatives) was found to be increased (13.7:1) for the unlabeled, endogenous analyte. Besides, both L-forms are hardly detectable. (Capillary column was a Rt-gDEXsa, connected to an APCI-TOF-MS. Figure is based on data generated by C. Wachsmuth.)
However, the lactone form is not observed in all tumor entities analyzed, raising the question about the origin of 2-HG-lactone. In general, ester formation is favored under acidic conditions, but a pH of ~5-6 seems insufficient to cause the detected 2-HG-lactone concentrations. This thesis aims at finding the conditions and prerequisites for lactonization of 2-HG. For instance, it is investigated whether 2-HG-lactone is a product of a so far unknown enzyme (activity). This includes the analysis of cell culture samples and several biological specimens by LC-MS/MS.
Therefore, a HPLC system coupled to a triple-quadrupole mass spectrometer in MRM
(multiple reaction monitoring) mode is used for quantification of 2-HG&-lactone.
Objectives
7
Cell culture experiments are performed using several cell lines. There are cells with WT-IDH and cell with mutation of IDH, e.g. HT1080 and a panel of HCT116 cells (consisting of cells with mutations in
IDH1 or IDH2, respectively, and the WT-IDHparental cell line).
3.2 Investigate the metabolic fate of 2-HG and 2-HG-lactone
It is further hypothesized that D-2-HG is metabolized by its dehydrogenase D2HDH and that this enzyme is upregulated in response to accumulation of the substrate.
Therefore, enzyme activity in cell homogenates is determined in an enzyme assay to investigate potential regulation of enzyme kinetics. This LC-MS/MS-based assay has to be established to measure the decline of 2-HG. Regulation on the protein expression level is analyzed by Western Blot.
Moreover, as a valuable technique for investigating the metabolic fate of 2-HG and its lactone in cell culture models, metabolic tracing is performed. Typical stable isotope labeled substrates ([U-
13C]glutamine, [U-
13C]glucose) are added to cell culture medium with subsequent tracing of the label into metabolic products. For analysis of those cell extracts, new derivatization strategies need to be found as established methods are unsuitable. Finally, this experiment provides data on metabolic effects of
IDH1/2mutation.
3.3 Analytical objectives
For some of the aforementioned investigations, it is possible to use the already
established LC-ESI-MS/MS method for quantification of 2-HG and 2-HG-lactone, but
a thorough method validation has to be performed. However, this method is not
applicable to enantioselective investigations. A method for chiral analysis of 2-HG is
available, but cannot be extended to the analysis of 2-HG-lactone. Moreover, for
analysis of labeling patterns, the LC-MS/MS method has to be extended by the
respective transitions for 2-HG and 2-HG-lactone. In order to gain more information on
cellular metabolism in the context of IDH1/2 mutation and elevated 2-HG levels, a more
widespread method for tracer analysis is established. A GC-APCI-TOF-MS method
gives valuable results. But here, like for other (GC-)MS-strategies involving
Objectives
8
derivatization, work is hampered by the fact that 2-HG and 2-HG-lactone are closely related and are easily transformed into each other by harsh derivatization conditions.
Consequently, various derivatization protocols are tested, especially for the attempt to
perform chiral analysis.
Background
9
4 Background
4.1 IDH1/2 mutation and 2-hydroxyglutarate
Cellular metabolism in cancer is known to be altered to meet the increased energy demand and biomolecule turnover. In this context, several mutations were identified facilitating cellular transformation, which included mutation of isocitrate dehydrogenase
3. This enzyme has three isoforms in eukaryotic cells, cytosolic IDH1 and mitochondrial IDH2/3, which all catalyze oxidative decarboxylation of isocitrate to α-ketoglutarate using redox equivalents as co-substrates
4. To date, several non- synonymous mutations have been found in the NADP
+-dependent IDH1/2 that seem to be mutually exclusive
5.
IDH1/2 mutations have been found initially in colorectalcancer
6, and are frequently identified in tumors of the central nervous system, like glioblastoma, and in patients with acute myeloid leukemia (AML)
5,7. The most frequent mutation type in glial tumors is IDH1-R132H, which is found in 91.5% of patients with
IDH1 mutation8. Other substitutions include R132C, R132G, R132S, and R132L.
Mutations in
IDH2 in gliomas are rare (<3%) and in most cases of the R172K type9,
with R172 being the analogous residue to R132 in IDH1. In AML patients, the IDH2
mutations R140Q and R172K are typically observed and these two mutations occur at
a frequency of 15.4%, which is twice as much as
mutIDH1 in AML10. Interestingly, all
of the mutated residues are located in the active site of IDH1/2 and contribute to
substrate binding via hydrogen bonds
11. Accordingly, the mutations result in a neo-
enzymatic activity,
i.e., the production of D-2-HGfrom α-ketoglutarate and its
subsequent accumulation
11. This corresponds to the almost reverse reaction
compared to the WT-IDH1/2, only lacking the carboxylation step.
Background
10 Figure 3. Scheme depicting the formation of D-2-HG in cell metabolism under both, physiological conditions and due to somatic mutations in IDH1/2 in cancer.
Some authors described that IDH2 mutations result in higher concentrations of 2-HG
compared to IDH1 mutations
12-14. This seems to be due to the dependency of the latter
isoform on metabolic flux through a WT-IDH1 to supply α-KG
13. Therefore,
IDH1mutations are generally heterozygous, with only one allele being mutated, whereas for
IDH2 rare cases of biallelic mutations have been reported15. MutIDH1/2 generate
exclusively the D-enantiomer of 2-HG. The concentrations detected, for instance, in
gliomas typically range from 5 to 35 mM, i.e., they are 10-100-fold higher compared to
control samples without IDH1/2 mutations
16. In healthy cells, 2-HG is produced only in
low amounts (intracellular levels <0.1 mM)
17as side products of enzymes like HOT
(hydroxyl acid-oxoacid-transhydrogenase)
18and PHGDH (phosphoglycerate
dehydrogenase)
19(Figure 3). Enantiospecific dehydrogenases, named
D-/L-2-hydroxyglutarate dehydrogenase (D-/L-2HGDH), assure the oxidation back to
α-ketoglutarate. Deficiency of these enzymes due to germline mutations result in
D-/L-2-hydroxyglutarate aciduria (D-/L-2-HGA) with similarly elevated 2-HG-levels in
Background
11
urine, plasma and also in cerebrospinal fluid
20,2,21. Clinical symptoms caused by pathological accumulation of 2-HG differ for the two enantiomers. L2HDH deficient patients suffer from encephalopathy and their risk of brain tumors like gliomas is increased
22. Deficiency of D2HDH results in a neurometabolic disorder, which is associated with encephalopathy and cardiomyopathy, but not with cancer
23. Additionally, there is D-2-HGA type II, which is caused by a germline mutation or mosaicism in
IDH2, also resulting in elevated D-2-HG levels24,25. It is suggested that even functional D2HDH cannot cope with the extremely elevated 2-HG levels obtained when
IDH1/2 is mutated due to a huge difference in the catalytic rate for 2-HGproduction and degradation
11,26.
D-2-HG is regarded as an oncometabolite, contributing to and in cooperation with other oncogenes even initiating oncogenesis
27. The underlying mechanism(s) are currently still discussed. Its structural similarity to α-KG is known to exert inhibitory effects on α-KG-dependent enzymes and depicts possible ways of mediating transformation. An example is the competitive inhibition of α-KG-dependent TET2 and histone demethylase KDM4C (also known as JMJD2C) resulting in DNA hypermethylation and an altered histone methylation pattern, respectively, which in turn block cell differentiation and change gene expression
28,29.
The L-enantiomer of 2-HG, in contrast, is increasingly produced under hypoxic conditions by promiscuous enzyme activity of lactate dehydrogenase (LDH) and malate dehydrogenase (MDH), which is further enhanced by acidic conditions
30. The biological function in this context was found to be HIF1a-stabilization in adaptation to acidosis and hypoxia. These interactions again involve inhibition of α-KG-dependent- dioxygenases, which was found to be stronger by L-2-HG than D-2-HG
28,31,32.Thus, for 2-HG there are shared, as well as enantiospecific effects.
Interestingly, mutations in other TCA enzymes, like fumarate hydratase (FH) and
succinate dehydrogenase (SDH), also lead to elevated metabolite levels, which share
the common feature of inhibiting α-KG-dependent enzymes
31,33,34. This indicates, that
metabolites like D-2-HG, as well as fumarate and succinate, are implicated in the
dysregulation of cellular processes and have comparable roles in cellular
transformation and oncogenesis.
Background
12
Additionally,
IDH1/2 mutant status or elevated D-2-HG concentrations, respectively,were associated with increased ROS-production. This is a consequence of mutant
IDH1/2 consuming rather than producing NADPH11,35,36, which is used to regenerate the antioxidant glutathione. Therefore, mutIDH1/2 impacts the redox status of the cell, which is important with regard to possible DNA-damage by radicals
37. Moreover, it wasreported that elevated 2-HG concentrations cause a homologous recombination (HR) defect
38, conferring chemosensitivity and radiosensitivity to patients with
mutIDH1gliomas
38.
Further studies showed that treatment of the erythroblast cell line TF-1 with 200 µM trifluoromethyl benzyl (TFMB)-esterified D-2-HG caused growth factor independence and impaired differentiation
39. Additionally, overexpression of D2HGDH was found to inhibit tumor growth in cells harboring
mutIDH140. In contrast to slightly elevated D-2-HG levels from
IDH1/2 mutation, which enhance proliferation in some cell line8, high D-2-HG concentrations are toxic. For example, the LD
50for D-2-HG in HEK293T embryonic kidney cells was determined to be 10 mM, while it was approximately 50 mM in LN229 glioblastoma cells. Therefore, it is assumed that toxicity at high concentrations and an increased chemosensitivity are the reasons for a better prognosis of glioma patients with
mutIDH1 compared to WT-IDH13,41. Regarding the prognostic impact of D-2-HG/
IDH1/2 mutation in AML patients, findings arecontradictory so far
42,43,44,45.
A growing number of studies investigates the effects of D-2-HG on the tumor environment, for instance in promoting immune escape. I contributed to a study investigating the impact of D-2-HG on T-cells
46. First of all, it was confirmed by analyzing cell extracts by LC-MS/MS, that T-cells take up D-2-HG produced by
mutIDH1/2myeloblasts of AML patients. Furthermore, it was shown that D-2-HG altered T-cell metabolism towards oxidative phosphorylation. On a functional level, a higher frequency of regulatory T-cells and a reduced polarization of Th17-cells was observed. A similar study found that D-2-HG impairs differentiation of monocytes into dendritic cells with impaired capacity for T-cell stimulation (Hammon et al, manuscript in preparation).
For gliomas, which have a different microenvironment, 2-HG also seems to have an
impact on immune cells.
MutIDH1/2 gliomas were found to have less immuneBackground
13
infiltration, namely lower accumulation of CD3
+CD8
+T-cell in tumor sites, as a consequence of reduced chemokine production by glioma cells
47. Additionally, it was reported that
mutIDH1 glioma cells showed translational silencing of NK receptors(NKG2D), which activate NK- and CD8
+T-cells and mediate cytotoxicity.
Consequently, those cells acquired resistance to NK cells
48. In conclusion, these reports provide evidence that D-2-HG might be an immune-modifying factor.
4.2 Aspects of enzymology
In investigations on accumulation of 2-HG in different diseases, enzymes play an important role. There is on the one hand IDH1/2 which - by single amino acid substitutions - undergoes changes in its affinity towards its actual product (α-KG) resulting in the almost reverse reaction now using α-KG as a substrate
11. Additionally, type and position of the amino acid substitution affect the amount of 2-HG formed
8. On the other hand,
D2HGDH mutation like in 2-HG-aciduria cause a decreased enzymeactivity with subsequent reduced degradation of D-2-HG. Even intact D2HDH is a low capacity enzyme and is described as a metabolic repair enzyme characterized by high affinity towards its typically low concentrated substrate
49.
These findings were made by investigating enzyme kinetics, hence analyzing and
comparing reaction rates, for instance in dependence on changed experimental
parameters. A frequently used method here is an enzyme assay, where the velocity of
an enzymatic reaction is calculated from the decrease in substrate or increase in
product per time, respectively. This is based on the assumption that, under
experimental conditions, the reaction is in a steady state according to the theory of
Michaelis and Menten, which can be applied to many, but not all enzymes
50,51(see
Figure 4). This state is given, when formation and breakdown of the enzyme-substrate-
complex is equal, but not limited by any compound involved in the reaction. Drawing
such a curve must give a linear relationship, otherwise the curve does not reflect the
initial reaction velocity v
0and a steady state
52. If the total amount of enzyme is known,
the turnover number of every single enzyme molecule at saturating conditions (called
k
cat) can be calculated. Likewise, turnover in catalyzing α-KG formation from isocitrate
for WT-IDH1 (4.4x10
41/s ) was found to be 1000 fold higher than for IDH1-R132H
(37.5 1/s)
11. Another characteristic value describing enzyme kinetics is the maximum
Background
14
velocity v
max, which is also required for determination of k
cat. Additionally, K
mis the substrate concentration at half maximum velocity and often regarded as a measure for the enzymes´ affinity towards its substrate. However, this is only true in the case of rapid equilibrium for the substrate-enzyme-complex with product formation being the rate limiting step. For applying saturating conditions in assays, a concentration of 10- 100 fold K
mis suggested
52.
Figure 4. Kinetics of an enzyme-catalysed reaction according to Michaelis and Menten.
This theory says that the turnover rate can be determined when formation and breakdown of the enzyme-substrate- complex (ES) are in steady state. Kcat can only be calculated when the enzyme concentration [E]
is known.
In establishing an enzyme assay, conditions should resemble physiological conditions as closely as possible to obtain sensitive and reliable data on kinetics. Several factors impact enzyme activity. For human enzymes, the optimum temperature usually is 37 °C and reaction rates decrease at higher and lower temperatures. Another important factor is pH, where the optimum often reflects the typical pH of the cell compartment the enzyme is located in
53,54. The pH as well as ionic strength of the assay buffer are essential for proper conformation and stabilization of the enzyme.
Finally, reactions are often dependent on cofactors and counter-ions, which need to
Background
15
be included into the assay buffer in non-limiting concentrations. Both reactions investigated in this thesis are redox reactions: the formation of 2-HG is a reduction, while its degradation is an oxidation. Consequently, enzyme assays include a redox equivalent. The endogenous co-factors are NADPH for IDH1/2 and FAD for D2HDH.
In assay buffers, however, often artificial redox agents are included, which allow for higher reaction rates and, therefore, enhanced sensitivity, especially for low substrate concentrations. Once the optimal assay conditions have been identified, they need to be kept constant. The only compound, the concentration of which may be varied, is the substrate in order to create a Michaelis-Menten plot. The assay is usually started by the addition of substrate to the reaction mixture or any other compound obligatory for the reaction. A blank sample, which lacks one component, can provide information about unspecific noise or spontaneous degradation in the absence of enzyme
52. The measurement of substrate decrease or product increase, respectively, can be accomplished by different methods. One way is to perform a colorimetric assay, which is especially appropriate for the detection of colored products. A technical variant of this approach is a fluorometric assay, which is more sensitive. One prominent example is detection of the fluorescent signal from NADH, which is also used for determining 2-HG in different biological specimens (explained in detail in 4.3.3)
55. Fluorescence plate readers can automatically and continuously measure over a defined time range, providing data for kinetic analysis. Like used for this thesis, the substrate/product concentration can also be determined by (hyphenated) MS analysis. This is a so-called stopped assay, as aliquots at different time points are taken and the enzymatic reaction needs to be stopped, e.g., by enzyme precipitation. The advantages of such an assay are higher sensitivity and specificity.
The results of enzyme assays do not only provide information on enzyme
characteristics but also on enzyme regulation. Non-competitive inhibition can be seen
from reduced v
max, while a higher K
mis indicative of competitive inhibition. Furthermore,
there is allosteric inhibition, which is a more complex inhibition type and does not
necessarily give a Michaelis-Menten kinetic. Allosteric enzymes typically have a low-
affinity and a high-affinity state, with an inhibitor or activator, respectively, changing the
state by interacting with the enzyme. Feedback inhibition is one example for that
regulation; here the end product of a metabolic pathway can downregulate the key
enzyme to prevent product accumulation. Compounds interacting in that way, can only
Background
16
be identified when included in the assay mixture. Besides, regulation can also take part via posttranslational modifications (PTM). These include covalent attachment of a functional group, most commonly phosphorylation. Conformational changes, introduced in this way, can for instance alter substrate binding and, therefore, catalytic activity. For detection of PTMs, further methods are necessary like isoelectric focusing (IEF), which unravels changes in the isoelectric point of proteins. In addition, MS-based proteomics of PTMs has shown the large extent of protein modifications. More detailed information is gained from modification-specific enrichment techniques, like phospho- peptide enrichment, combined with advanced MS/MS methods
56,57. Finally, many enzymes can be upregulated at the protein level to adapt catalytic capacity. This can be detected via western blot using an antibody specifically raised against the enzyme.
For some proteins, there are also antibodies targeting the phospho-site, which can again be helpful in the analysis of modifications.
4.3 Metabolomics by hyphenated MS-techniques
4.3.1 Overview
The analysis of metabolites comprising a systems´ metabolome
58is called
metabolomics
59. This term was coined based on the nomenclature of other “omics”-
techniques such as genomics, transcriptomics and proteomics. Together those
techniques reveal the “omics cascade” with the metabolome being the closest to
phenotype. The metabolome can be subdivided into further classes, such as amino
acids, organic acids, lipids, which all have distinct chemical properties. Thus, no
instrument platform is suitable to analyze all metabolites
60but metabolomics still relies
on combining several instruments and analytical methods. Nuclear magnetic
resonance (mainly 1H-NMR) is also being used in metabolomics
61-63. Although
1H-NMR comes close to being a universal detector, it does not allow for complete
coverage of a metabolome due to its low sensitivity. In the early years of MS in
metabolomics, often direct infusion was favored because of short run time. However,
this entails several problems like high background especially when injecting complex
samples, severe ion suppression and lack of isomer separation. Coupling of
chromatography and MS can overcome many of these problems and often is able to
Background
17
distinguish between isomers by chromatographic separation. Therefore, in metabolomics hyphenated mass spectrometry is more commonly used, but there are still some rare applications with direct infusion.
The classical metabolomics approach is called fingerprinting or untargeted metabolomics, which entails the analysis of all detectable compounds preferably with high resolution mass spectrometers. From these complex data, metabolites differentially regulated between groups are identified. However, this approach only gives rise to semi-quantitative data. To confirm findings of metabolites differing in abundance between different conditions or specimens, an alternative metabolomics approach has to be applied, namely metabolic profiling also called targeted metabolomics (see below).
Depending on the separation technique coupled to mass spectrometry, one can distinguish three main platforms: GC-MS, LC-MS and CE (capillary electrophoresis)- MS. In GC-analysis the mobile phase is gaseous and, therefore, highly suited for volatile compounds. For polar compounds with insufficient vapor pressure, derivatization is necessary to rise volatility, increase thermal stability, and enhance detection. Derivatization commonly reduces polarity by performing alkylation, silylation or acetylation on polar functional groups. (Some derivatization strategies are explained in chapter 7). For ionization, classically EI (electron ionization) is the first choice, which is regarded as a hard ionization technique commonly causing extensive fragmentation.
Hence, the molecular ion is often low abundant or not detectable. However, this can be helpful for identification and structure determination of unknown compounds. The most frequent GC-MS instrument is a GC-EI-qMS, with a quadrupole as mass analyzer. In general, GC-MS is a robust bioanalytical technique providing a high chromatographic resolution.
In liquid chromatography the mobile phase is a liquid; for isocratic elution a solvent is
used. Mostly, however, two solvents are employed for gradient elution to facilitate
elution and to shorten run times. The stationary phase consists of silica-based or
polymer particles, which can be modified to change polarity. Based on the type of
stationary phase, one can distinguish between normal phase (NP)-LC, reversed phase
(RP)-LC, and HILIC (hydrophilic interaction liquid)-chromatography. Polarity of the
mobile phase is adapted to the stationary phase and the type of LC application. The
Background
18
most frequently used method is RP-LC, which combines a non-polar stationary phase with polar mobile phases (e.g., water, methanol, acetonitrile) for analysis of less polar compounds. By derivatization of bare silica, like in normal phase, the polarity is reversed giving the name to this LC-subtype. The most frequently employed stationary phase consists of C
18-alkane modified silica. Finally, HILIC is a valuable separation technique to analyze polar and even ionic compounds, using columns like in NP-LC in combination with rather polar RP like mobile phases (more details see chapter 4.3.3).
The choice of technique is driven by the chemical properties (defining solubility/retention) of the metabolites of interest.
The typical ionization technique used in coupling of LC to MS is electrospray ionization
(ESI). Ionization procedure starts with formation of charged droplets at the end of a
capillary electrode, which are reduced by evaporation of the solvent until a bare
charged analyte remains in the gas phase. This type of ionization takes place at
atmospheric pressure. It is regarded a soft ionization technique forming primarily
quasi-molecular ions, but also for example adducts. Positive and negative mode
ionization can be carried out by applying voltage of the respective polarity. Certainly,
ESI also has some drawbacks, e.g., matrix effects, which have an irreproducible impact
on signal intensity. These interferences arise from coeluting (matrix) components,
which are assumed to compete with the analyte during ion formation causing ion
suppression or even enhancement
64,65. However, proper sample extraction and clean-
up as well as chromatographic separation can reduce those interferences and,
thereby, enhance signal intensity
65. Furthermore, mobile phase additives can also
influence the formation of ions in the source. In this context more problematic modifiers
like the ion pairing reagent trifluoroacetic acid might be exchanged by, e.g., formic acid,
which causes usually less ion suppression
66. Finally, internal standards can be used
to control for matrix dependent variation in ion yield (see below).
Background
19 4.3.2 Quantitative targeted MS-analysis
Quantitative analysis means experimental determination of the absolute concentration/
amount of a set of pre-defined compounds. The set of analytes is usually limited to a certain compound class or metabolites and intermediates of an explicit pathway. This targeted analysis is called metabolic profiling and is often used to verify a hypothesis, generated on other preliminary data
67.
One instrument that is highly qualified for this targeted analysis is a LC-ESI-QqQ-MS.
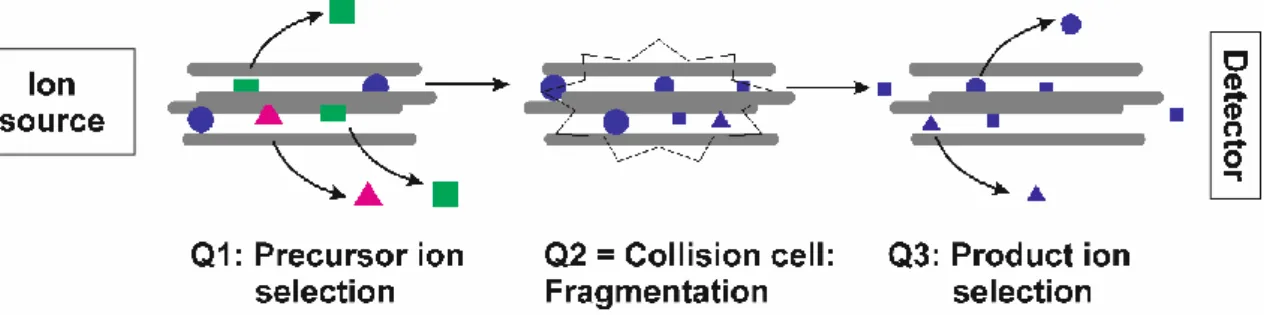
As the colloquial name, TripleQuad-MS, already implies this instrument has three quadrupoles (QqQ), which are arranged in line with the second quadrupole Q2 being the collision cell. The other two quadrupoles (Q1 and Q3) can be operated in different scan modes with Q1 and/or Q3 set to a fixed mass or used to scan a certain mass range, respectively. MRM-mode (multiple reaction monitoring) is the most prominent mode for quantification analysis due to its high sensitivity and a broad dynamic range (of three to five orders of magnitude)
68. Figure 5 shows a scheme of the principle of MRM:
Figure 5. Scheme of a Triple Quad-instrument operated in MRM-mode. The charged analytes, produced by the ion source, are focused to form a narrow ion beam entering the first quadrupole Q1. The voltage applied here is set to isolate the parent ion. Ions of other m/z- values are deflected and leave the ion path. The parent ion is accelerated to Q2, where it is fragmented by collision with a collision gas (N2 or argon). Q3 is operated identical to Q1, now selecting for the product ion, which hits the detector. The mass range isolated in Q1 and Q3 is usually a window of 1 Da around the m/z-value of the target compound. The pair of precursor and fragment ions is called a transition.
MRM mode benefits from a low signal-to-noise-ratio and increased selectivity. The
scheme shows the process for one analyte. For a set of analytes, the process needs
to be repeated iteratively. Such a cycle gives one data point for each analyte, which
are summed up to re-build a chromatogram. For a reliable peak reconstruction, a
Background
20
minimal number of 15-20 data points across the peak is necessary
69. Therefore, the time spent on scanning one analyte (called dwell time) is limited. On the other hand, when the dwell time is too short signal quality will be impaired. To circumvent this issue, it is possible to divide the LC-run into windows/periods, where only transitions of analytes are measured that are expected to elute from the column in this time range.
Depending on the instrument options scheduled MRM´s can be programmed with a specific window for each analyte. All acquisition parameters for each compound are optimized by measuring analyte standards during method development.
Linear range of TripleQuad instruments (like with other LC-ESI-MS instruments) is limited at the ULOQ (upper limit of quantification) either by saturation at the detector or due to e.g. charge limitations in the ion source
70. The LLOQ (lower limit of quantification) is mainly dependent on ionization efficiency. As mentioned before, matrix effects can drastically affect ionization and therefore cause an increase of LOQ in comparison to standard samples or a different biological matrix.
This is one explanation, why response, hence the peak intensity in arbitrary units, does not allow for absolute quantification. Another issue is, for instance, analyte loss during sample preparation. These problems can be overcome by including an internal standard (IS). The internal standard can be a compound of similar chemical nature or a structural analogue. The best option, however, is a stable isotope labeled analogue, where the analyte and its corresponding isotopologue elute from the column at the same retention time and are only distinguished by their mass. Thus, the IS corrects for matrix effects and ensures high specificity. In practice, a known concentration of IS is spiked into the sample at the earliest possible stage during sample preparation. The ratio of the analyte area and the IS area (A
analyte/ A
IS; also called response) is used to calculate the sample´s absolute concentration. Two approaches are distinguished:
on the one hand, the stable-isotope dilution (SID) methodology
71-73, where the ratio
(A
analyte/ A
IS) is multiplied with the IS-concentration to calculate the analyte´s
concentration. On the other hand, a multipoint calibration curve can be constructed
based on the response (y axis) and the ratio of analyte concentration and IS
concentration (x axis)
74,75. The disadvantage of the addition of stable isotope labeled
standard is the high expense, especially for methods containing a high number of
analytes, and the limited availability.
Background
21
Furthermore, quantitative approaches exist also for GC-MS. A comparable way to MRM is SIM (selected-ion-monitoring-) mode, where the quadrupole of a GC-EI-qMS instrument is set to iteratively isolate ions of preselected m/z-values
76,77. Here, again sensitivity is increased in comparison to a full-scan approach. Nevertheless, inclusion of an internal standard and a calibration curve are recommended for absolute quantifications.
The FDA (U.S. Department of Health and Human Services, Food and Drug Administration) has provided a guide for method development and validation of bioanalytical, quantitative assays for the analysis of metabolites and drugs in biological matrices such as blood, serum, plasma, or urine
78. This guide should ensure high data quality by monitoring accuracy, precision, selectivity, sensitivity, reproducibility, and analyte stability.
4.3.3 Analysis of 2-HG in biological samples
Quantification of 2-HG in biological samples can be achieved by enzymatic assays, on the one hand. As mentioned earlier, Balss
et al. (2012) developed an assay wheredegradation of D-2-HG is coupled to a fluorescence reaction via a two-step reaction
55. Purified 2-hydroxyglutarate dehydrogenase from
A. fermentans expressed in E. coliconverts D-2-HG into α-KG using NAD
+as a hydride acceptor. The produced NADH is used by diaphorase to produce the fluorescent Resorufin from its non-fluorescent precursor Resazurin. To perform this assay, a reaction solution containing all enzymes and cofactors is mixed with the sample and incubated for 30 minutes at room temperature. Fluorescence signal intensity is used to calculate D-2-HG concentrations from a standard curve acquired in parallel with standard samples of known D-2-HG concentration. This assay is applicable to the analysis of several specimens like cell culture supernatant, urine, or serum. Even deparaffinized and deproteinized FFPE- material can be subjected to this assay. According to the authors, the LLOQ for this assay is 0.44 µM D-2-HG in tumor tissue and 2.77 µM in serum. The assay shows results comparable to determination by GC-MS up to a concentration of about 500 µM.
Beyond this enzymatic assay, several (quantitative) methods using GC-MS or
LC-MS/MS were published. Quite a few publications apply one of two frequently cited
Background
22
enantioselective methods: Gibson et al.
79(1993, butylated diastereomers via GC-MS) and Struys
et al.80(2004, DATAN-derivatives via LC-MS). Both methods are enantioselective, as they were developed in context of 2-HG-aciduria, where it is necessary to distinguish between D- and L-2-HG for diagnosis of D-2-HGA or L-2- HGA, respectively. Gibson
et al. reported a derivatization regimen using D-2-butanolfor esterification of carboxyl groups (under acidic conditions) and acetic anhydride for acetylation of hydroxyl groups. By addition of enantiomeric pure D-2-butanol diastereomers are formed, which can be separated on polar, non-chiral GC-columns.
In this method GC is coupled to MS via chemical ionization and data are acquired in SIM-mode. This derivatization strategy was already applied by the Wadman group to determine the absolute configuration of urinary 2-hydroxydicarboxylic acids including 2-HG
2,81. However, Gibson et al. further established this approach as a quantitative method including isotope dilution using D,L-[3,3,4,4-D
4]-2-hydroxyglutaric acid (prepared from D
4-α-KG) as internal standard. Similarly, Janin
et al. in 2014 used[1,2,3,4-
13C
4]-labeled 2-HG (prepared from [
13C
4]-α-KG) in a GC-QqQ-MS/MS method
82. Here the linear range is from ~ 50 pmol to 400 nmol (which equals to 0.5 µM and 4 mM, respectively, in a 100 µL sample) with the LOD determined at 20 pmol.
Figure 6. Derivatization of 2-hydroxyglutarate using D-2-butanol and acetaldehyde for enantioselective analysis. For the structure of the derivatization product see Figure 14.
Struys
et al. used DATAN (diacetyl-L-tartaric anhydride) for derivatization againyielding diastereomers of 2-HG, which could be separated within five minutes on a
C18-HPLC column (Xterra, Waters)
80. Acquisition of MS-data was performed in MRM-
mode. Once more, D,L-[3,3,4,4-D
4]-2-hydroxyglutaric acid (prepared from [D
4]-α-KG)
is included as stable-isotope labeled standard. This method is stated to be less time-
consuming and less expensive than the aforementioned method reported by Gibson
Background
23 et al. Poinsignon et al. (2016) similarly used derivatization with DATAN in the context
of IDH1/2 mutation to analyze AML-patient samples in a clinical setting, as well as in preclinical applications using cellular and tissue samples
83. Here the linear calibration curve ranged from 0.34 µM to 135.04 μM. Moreover, this method was used in the 2-HG analysis of mutIDH1/2 samples in the context of intrahepatic cholangiocarcinoma (ICC) with a comparable LLOQ of ~0.2 µM
84. Those recent publications have made use of now commercially available deuterated 2-HG ([2,3,3- D
3]-(RS)-2-hydroxyglutaric acid).
Additionally, Ward
et al. (2010) reported a GC-EI-MS method based on the silylationof cell extracts with MTBSTFA (N-methyl-N-tert-butyldimethylsilyltrifluoroacetamide)
10. Derivatized samples were then injected onto a HP-5MS capillary column for non-chiral analysis. Here, no internal standard was included, and peak areas were normalized to glutamate as relative measure of metabolite abundances. Therefore, this publication did not yield absolute quantitative values. It was rather used to check for drastically increased 2-HG levels in AML samples as marker for a mutation in IDH1/2.
Many methods developed to detect elevated 2-HG levels due to
mutIDH1/2 are notenantioselective, because the neo-enzymatic activity of IDH1/2 is specific for the production of D-2-HG. Thus, analysis of 2-HG may be accomplished directly by LC- MS without derivatization. However, the hydrophilic nature of 2-HG impedes retention on classical, non-polar RP-LC-columns (e.g., C18). In addition, highly aqueous mobile phase conditions are required for solubilization and loading of 2-HG, which can cause phase collapse of traditional C18 columns. Modern C18 columns (e.g., Agilent, ZORBAX SB-Aq) can be operated with 100% water. Juratli et al. (2013) used such a column for the simultaneous quantification of TCA intermediates and 2-HG in low- grade gliomas
85. Detection was performed in MRM-mode and stable isotope-labeled internal standards were included for absolute quantification.
Besides, methods using other types of LC-columns were developed, which regularly comprise several other metabolites. Fluorinated silica-based columns are an attractive alternative due to their effectiveness in retaining small polar molecules. Navis
et al.(2013) used a Luna PFP column for analysis of D-2-HG by LC-MS/MS in MRM mode
in specimens obtained from an IDH1-R132H mutation carrying xenograft model
86. For
absolute quantification, a
13C
5-2-HG stable isotope solution was added to the sample
before filtration to remove proteins.
Background
24
Another means for increasing retention of charged analytes on reversed phase columns is the addition of an ion-pairing agent. Those agents are often non-volatile and, therefore, not compatible with online LC-ESI-MS. However, there are also volatile ion pair modifiers like tributylammonium acetate (TBAA), which was introduced into 2-HG (and TCA) analysis by Dang 2009
11. Thus, a C18-column (Synergi Hydro-RP, Phenomenex) could be used in a LC-MS/MS approach, run on a TripleQuad instrument in MRM-mode. Quantification was achieved by comparison of peak areas with metabolite standards. However, experience in our laboratory showed that TBA is quite
“sticky” and tends to remain in the chromatographic system causing serve interferences for methods using positive mode ionization and extensive flushing is required (K. Dettmer, personal communication).
Finally, ion-exchange chromatography can be used for separation of charged compounds. However, high salt concentration is typically applied for elution. Therefore, this is not compatible for detection via MS, as most salts are non-volatile and impede ionization. Still, Borger et al. (2014) used a multiple-mode column (BioRad Fast Acid analysis) and isocratic elution with 0.1% formic acid in water
87. Total run time was only four minutes. In this LC-MS/MS approach, the column was connected to a TripleQuad instrument operated in MRM-mode to quantify 2-HG in serum samples. Internal standard was again
13C
5-2-HG, which was added before sample precipitation.
Besides, hydrophilic interaction liquid chromatography (HILIC) is highly suitable for separation of polar and even ionic compounds like 2-HG. HILIC is a hybrid LC-method making use of polar stationary phases. Mobile phase - similar like in RP-LC - consists of a high percentage of an organic water-miscible solvent. But the gradient profile for HILIC is inverse to that of RP chromatography, i.e., the highest water content (maximal
~50%) is reached at the end of the run. Separation is achieved by partitioning of the
analytes between the water-rich layer, which is formed on the surface of the polar
stationary phase, and the water-deficient mobile phase
88. Consequently, HILIC offers
retention to hydrophilic compounds in contrast to classical RP-LC methods. Gelman et
al.(2015) reported the use of HILIC for the analysis of 2-HG and glutamine
89. The
column used was an Acquity UPLC BEH Amide column (Waters) coupled to a
QqQ-MS, again in MRM-mode. Becker-Kettern
et al. (2016) also set up a HILICmethod investigating total 2-HG, together with several organic and amino acids
90. A
Background
25
ZicHILIC SeQuant column was connected to a Q-Orbitrap-HRMS. External calibration curves ranged from 0.01 µM to 50 μM for each metabolite.
In addition to mass spectrometric bioanalytical methods, various NMR-based investigations were performed to analyze 2-HG
14,91. For glioma patients it is even possible to perform
in vivo measurements via MRT instruments. However, theseinvestigations suffer from low sensitivity and a high background signal. Information on spatial metabolite distribution is also gained from analysis of tissue sections. Volexen
et al. (2016)92developed a bioluminescence assay for this purpose, Longuespee et al.
(2018)
93used MALDI-TOF to examine tissue sections.
In conclusion, it can be stated that numerous methods were published for 2-HG analysis, none of which is universally applicable. Each has its strengths but also shortcomings, which determine the usability of the method in the respective context.
4.3.4 Flux/tracing analysis
The metabolic flux of a cell is regarded as the metabolite amount that is converted in
a certain time,
i.e., the intracellular metabolic rate94. Flux or tracer analysis are two
methods aiming to answer questions about cellular metabolic pathway (activity) and
nutrient contribution. In contrast, quantitative data provide only a snapshot of
metabolism at a given time point, but together with uptake and secretion rates it can
be used to generate knowledge about a biochemical network. Metabolic flux data are
generated by feeding a stable isotope labeled compound, named tracer, to the model
system and samples are subsequently analyzed via hyphenated MS or NMR. All
metabolites that are produced from the tracer, show an altered mass distribution due
to the incorporated label, which can be made visible by MS-measurements. However,
metabolic flux data are very complex and require computational data interpretation to
calculate absolute pathway activity. Furthermore, the biological system, e.g. a cell,
needs to be in a state without changes in flux and metabolite concentrations (metabolic
steady state
95) and in isotopic steady state, which means that the label enrichment in
the metabolite of interest (=tracee) is stable
96. These conditions require continuous cell
culture to avoid limitations in nutrients, increasing cell density and therefore changes
in proliferation rate. Furthermore, incubation times until isotopic steady state is
Background
26
reached, differ based on the intermediates/pathways as well as the cell type and are dependent on the tracer used
97.
A much easier, though less informative approach, is tracer analysis, where the labeling patterns of cellular metabolites after incubation with a labeled precursor are interpreted directly
97. Yet, change in flux should be minimal within the experimental time (ideally metabolic steady state, practically pseudo-steady state). This can be assumed for most pathways (e.g. glycolysis) in monolayer cell culture or suspension cells, when performing the tracer study as long as the cells are in the exponential growth phase
98. Interpretation of such labeling pattern can give insights into relative pathway activity and contributions, in context of mutations or changes, which were evoked by administration of a metabolically active drug.
Tracer analysis provides labeling patterns in all compounds involved in the metabolism of a labeled nutrient. The mass isotopomer distribution vector (MID) contains all fractional abundances of each isotopologue (M+0 to M+n; n is the analytes´ maximal labeled isotope number, introduced by the tracer, e.g. M+6 for
13C
6-citrate) normalized to the sum of all possible isotopologues
99. Therefore, these labeling patterns are independent of pool size and can unravel increased flux while absolute concentrations stay the same. Metabolites with identical patterns are in complete exchange. MIDs do not contain information on the position of label within the molecule. This can be determined by further experiments using NMR or by interpreting specific fragments from MS/MS-analysis.
Another important measure in
13C-tracer analysis is mean isotopic enrichment (also called fractional contribution), which determines the fraction of a metabolite’s carbon that is produced from a certain nutrient. The mean isotopic enrichment is calculated as follows:
𝑀𝐸 =
∑𝑛𝑖=0𝑖∗𝑠𝑛
,
where n is the number of carbon atoms in the metabolite, i denotes the isotopologues
and s the relative fraction of the isotopologues as calculated in the MID
100. Prerequisite
is, that the tracer is fully
13C-labeled. Especially glucose and glutamine as the main
carbon sources are well suited for tracer analysis. Summing up, the mean isotopic
enrichment for those two (calculated from two independent experiments) is often close
to 100%. If not, another substrate contributes to the formation of the tracee. For
Background
27
instance, it was reported for different cells that under hypoxic conditions acetate contributes to fatty acid synthesis
101.
With focus on glycolysis and TCA cycle, commonly fully labeled compounds are used.
Lactate can be formed from glycolysis and via pentose phosphate pathway. These two alternative routes can be distinguished by using 1,2-
13C
2-glucose as tracer
102. This example shows that the choice of the tracer is dependent on the pathway of interest.
Besides
13C-labeled nutrients, also tracers containing further stable isotopes like
15N or
2H are sometimes supplemented to cell culture media
103,104. Nevertheless,
13
C-labeled compounds are the most frequently used.
Cellular compartmentalization can influence the labeling pattern too. An established example here is pyruvate, which is found in both cytosol and mitochondria. A cell´s average labeling pattern cannot resolve the cellular distribution of pyruvate. However, it was found that the labeling pattern of alanine reflects mitochondrial pyruvate, while lactate is a cytosolic product of pyruvate
97.
Once the tracing data has been acquired, it needs to be subjected to correction for natural abundance of heavy isotopes introduced by the tracer. For instance,
13C has a natural abundance of 1.07 % contributing mainly to the M+1, but to a lower extent also to all other isotopologues. This correction is complex, nevertheless can be accomplished by using tools available from different sources (e.g. IsoCor
105, IsocorrectoR
106). Additionally, some bias is potentially introduced by derivatization,
e.g., silylation (28Si 92.23 %,
29Si 4.68 %,
30Si 3.08 %).
In conclusion, tracer analysis and to an even larger extent flux analysis are valuable
tools for investigations on metabolism and alternative pathways. Nevertheless, this
technique hides several pitfalls and therefore requires careful handling to avoid
misinterpretations.
Methods and Material
28
5 Methods and Material 5.1 Materials
D- and L-2-hydroxyglutarate, R- and S-5-oxotetrahydro-2-furancarboxylic acid, as well as pyridine, methyl chloroformate (MCF), and methoxylamine hydrochloride were from Sigma-Aldrich (Taufkirchen, Germany). Formic acid, methanol and ethyl acetate (LC-MS grade) from BDH Prolabo (VWR International, Vienna, Austria). N-Methyl-N- (trimethylsilyl)-trifluoroacetamide (MSTFA) was purchased from Macherey-Nagel (Dueren, Germany).
In all experiments purified water from a PURELAB Plus system (ELGA LabWater, Celle, Germany) was used.
5.2 Biological samples
5.2.1 Cell culture
For this thesis the following cell lines were cultured using the listed conditions:
HT1080 (a fibrosarcoma line; ATCC CCL-121, ATCC, Manassas, VA, USA) were
cultured in DMEM (PAN, Aidenbach, Germany) supplemented with 10 % fetal calf
serum (FCS, Biochrom AG, Berlin, Germany), 1 % penicillin-streptomycin (PAA,
Pasching, Austria), and 2 mM L-glutamine (PAN). The HCT116 panel (colon
carcinoma; Horizon Discovery, Waterbeach, UK; HD 104-013, HD 104-019, HD 104-
020) consists of a parental line (WT-IDH1/2) and three cell lines carrying the mutations
IDH1-R132H, IDH2-R172K, and IDH2-R140Q, respectively. This panel was cultured in
RPMI (1640, PAN), supplemented with 10 % FCS, 1 % penicillin-streptomycin, and
2 mM L-glutamine. The same medium was used for cultivation of the LS174T-cell panel
(colorectal adenocarcinoma, kindly provided by M. Kreutz, Regensburg) and CCRF-
CEM-C7H2 (acute lymphoblastic T-cell line; kindly provided by R. Kofler, Innsbruck,
Austria). The breast cancer cell line MCF7 (ATCC HTB-22) was cultured in DMEM
supplemented with 10 % FCS, 1 % penicillin-streptomycin and 2 mM L-glutamine. The
MCF7 cells formed clusters after trypsinization and, therefore, could not be counted,
but sub-cultured and seeded based on ratios. All other cells were counted using the
Casy TT System (OLS OMNI Life Science, Bremen, Germany).
Methods and Material
29
Adherent cells were sub-cultured by trypsinization, while suspension cells were diluted in fresh medium and once a week centrifuged (800 rpm, 5 min) to completely remove the old medium. Cells were sub-cultured two or three times a week and incubated at 37°C, 5 % CO
2.
For experiments with treatment of cells, adherent cells were seeded into 6-well plates the day before treatment was started. Cell count was 0.25-0.510
6/ well but was adapted to the intended incubation time.
TRACER ANALYSIS
Cells were seeded into plates and kept under standard conditions overnight. The next day, the medium was replaced with RPMI (+10% FCS, 1% P/S, +2 g/L glucose, w/o L-glutamine) supplemented with 2 mM
13C
5-L-glutamine (CIL, Andover MA, USA), for glucose tracing with RPMI (+10% FCS, 1% P/S, w/o glucose, +2 mM L-glutamine) supplemented with 2 g/L
13C
6-D-glucose (CIL), respectively. Cells were incubated for 24 h or 48 h. Sample collection and extraction were performed using the routine protocol, but without addition of internal standard solution(s).
OCTYL-2-HG
Cells were seeded into plates and kept under standard conditions overnight. The next day, the medium was replaced with medium supplemented with (2R)-2-hydroxyglutaric acid octyl ester (Toronto Research Chemicals, Toronto, Canada). For control cells, the medium was replaced with fresh standard medium. Cells were incubated for 24 h.
Sample collection and extraction were performed using the routine protocol.
5.2.2 Serum samples
Serum samples were collected at the Department of Internal Medicine III at the
University Hospital Regensburg. Written informed consent was obtained from all
participants. The study was approved by the local ethics committee and registered in
the national registry for clinical studies (05-097). Serum was stored at -80°C until
sample preparation, which was an extraction by methanol precipitation (see chapter
5.4.1).
Methods and Material
30 5.2.3 Glioma tissue samples