~~,,
wsp
water and
~~ sanitation proyrarn
Situation Analysis
SANITATION SCENARIO IN HOSHANGABAD
.. Madhya Pradesh
'
- Pravin More
February 2009
Public Disclosure AuthorizedPublic Disclosure AuthorizedPublic Disclosure AuthorizedPublic Disclosure Authorized
82622
~,wsp
... ~ ,, water and
. . , , sanitation program
CONTENTS ABBREVIATIONS DEFINITIONS CHAPTER1:
1.1 1.2 1.3 CHAPTER2:
2.1 2.2 2.3 2.4 CHAPTER3:
3.1 3.2 3.3 3.3
BACI((;ROlJND AND INTRODlJCTION ... 1
Background ... 1
MP State programmes ... 2
Methodology, Constraints and limitations ... .4
HOSHAN(;ABAD: A BRIEF PROFILE ... 6
Demography ... 6
City Governance ... 7
Assets ofHoshangabad Nagar Palika Parishad ... 8
Slums and Squatter Settlements ... 8
lJRBAN BASIC SERVICES ... 10
Household Sanitation ... 11
Public Sanitary Conveniences ... 14
Solid Waste Management ... 17
Water Supply ... 20
CHAPTER 4: WASTEWATER COLLECTION, CONVEYANCE AND DISPOSAL ... 23
4.1 Wastewater Generation and Collection ... .23
4.2 Wastewater Disposal ... 24
4.3 River Water Quality ... 26
4.4 Wastewater Reuse: Current and Potential ... 27
4.5 Proposed Sewage Collection and Treatment Schemes ... 27
CHAPTER 5: MlJNICIPAL FINANCES ... 30
5.1 Trends in Revenue and Expenditure ... .30
5.2 Trends in Recovery of Municipal Taxes and Other Revenues ... .33
CHAPTER6: 6.1 6.2. 6.3 Annexes Annex 1: Annex2: Annex 3: Annex 4: Annex 5: Annex 6: Annex 7: List of Figures Figure 2.1: Figure 2.2: Figure 2.3: EMER(;JN(; ISS liES ... 34
Status of Municipal Services: A Brief Summary ... .34
Emerging Issues ... .35
The Opportunity ... 3 7 List of Municipal Wards ... A.1 Ward-wise Breakdown of Cattle Waste Disposal Practices ... A.2 Ward-wise breakdown of 'other' latrines ... A.3 Assets and Infrastructure ... A.4 Ward wise Breakdown of Household Sanitation Arrangements ... A.5 List of Surveyed Households, where Information on Sanitation Arrangements is Contradictory ... A.6 Roles and Functions ofULB ... A.9 India Map showing location of Hoshangabad ... 6
Hoshangabad- Ward Map ... 7
Hoshangabad- Slum Wards ... 9
~·~§P
a\\ sanitation proyram
Figure 3.1:
Figure 3.2:
Figure 3.3:
Figure 3.4:
Figure 3.5:
Figure 3.6:
Figure 3.7:
Figure 3.8:
Figure 3.9:
Figure 3.10
Figure 4.1:
Figure 4.2:
Figure 4.3:
Figure 4.4:
Figure 4.5:
Figure 5.1:
Figure 5.2:
Figure 6.1:
List of Tables Table 2.1:
Table 3.1:
Table 3.2:
Table 3.3:
Table 3.4:
Table 4.1:
Table 4.2:
Table 4.3:
Table 4.4:
Table 5.1:
Table 5.2:
Table 5.3:
List of Boxes Box 1.1 Box 1.2 Box 3.1 Box 4.1
Household Sanitation Arrangements (200 1 and 2008) ... 12
Pit latrine with pucca superstructure built under ILCS scheme ... 12
Deluxe toilet block at Sethani Ghat ... 1 5 Willingness to Contribute Towards Capital Cost and Maintenance of Common Sanitation Facility ... 16
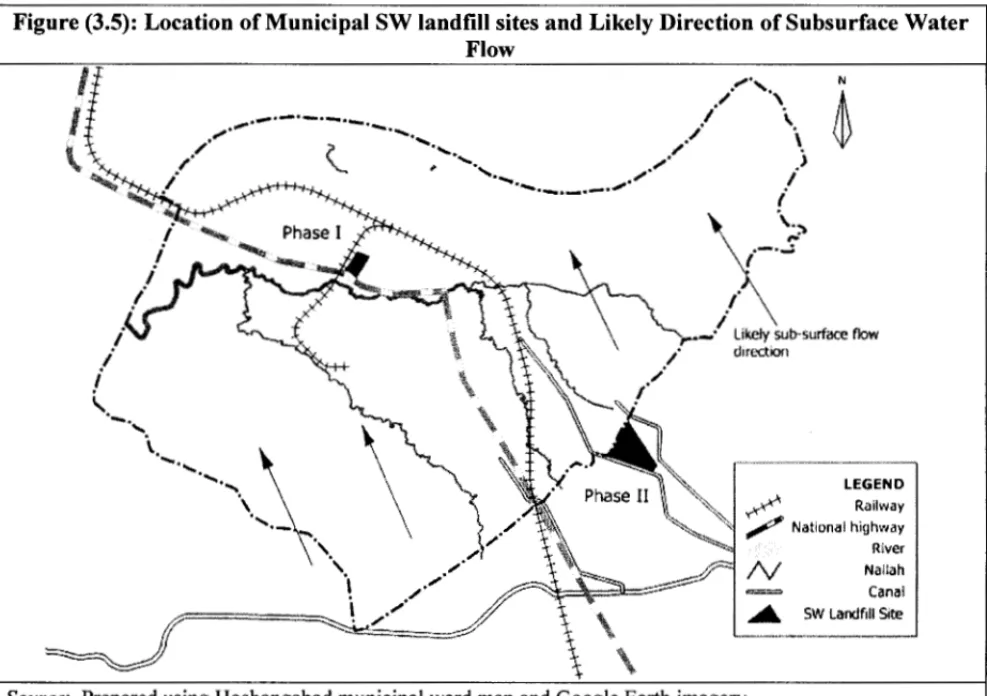
Location of Municipal Solid Waste Landfill Sites and Likely Direction of Subsurface Water Flow ... 18
Solid Waste Disposal Practices Adopted by Households ... 18
Citizen Perception: Solid Waste Bin/ depot Clearance Frequency ... 20
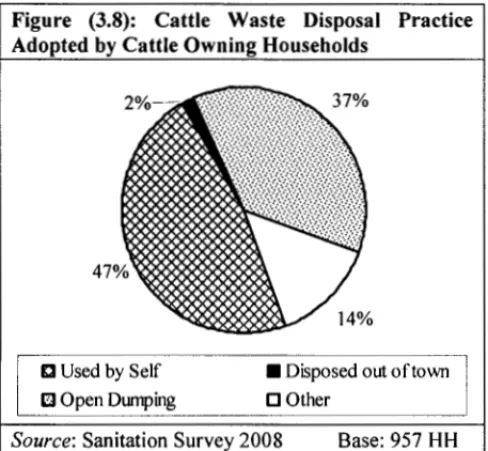
Cattle Waste Disposal Practice Adopted by Cattle Owning Households ... .15
Drinking Water Supply, Hoshangabad ... 21
Left- Flowing yard tap- a common sight; Right- Water pipe crossing Khojanpur Nallah ... 22
Typical box type Sullage and storm water drains ... .23
Drainage and Topography ... 24
Korighat Pumping Station ... .25
Existing Oxidation Ponds at Bheelpura ... 25
Hoshangabad: Sewerage Zones and proposed Sewage Treatment Plant Sites ... 29
HNPP Revenue from Own Sources as Percentage ofTotal Revenue ... 31
Per Capita Revenue and Expenditure of Municipal Reforms ... 32
Generic Elements of Planning, Implementation and M&E of City-wide Sanitation ... 4
Population Growth ( 1961-2001) ... 6
Ward-wise Change in Household Count- Census 2001 to Sanitation Survey 2008 ... 1 0 Preferred Sanitation Option by Households Currently Lacking Access to Sanitation Facilities ... 13
Location of Existing and Proposed Public Sanitary Conveniences (PSC) ... 14
Ward wise breakdown of Solid Waste Disposal Practices Adopted by Households ... 19
Wastewater Flow Estimation ... .23
Criteria for Classification of Water Quality ... 26
Narmada River Water Quality at Hoshangabad ... 26
Components of proposed trunk sewerage and sewage treatment scheme for Hoshangabad ... 28
Hoshangabad Nagar Palika Parishad: Revenue and Expenditure ... .30
Profile of Revenue and Expenditure ... 31
Trend in Recovery of Municipal Taxes ... .33
National Urban Sanitation Policy: Key Goals ... 2
City Wide Sanitation Plan: Guiding Principles ... .4
Household Latrine Typology ... 11
Potential agricultural land for wastewater reuse ... .27
~~·'·
wsp
water and~~ sanitation program
ABBREVIATIONS AAY
ADB APL BPL CES CMO CPCB CSP DflD DPR EPCO Go I GoMP HDR HNPP JMP JNNURM lpcd MDG MP MPPCB MPUSP MT NFHS NGOs NRCP NUSP PSC sc
SPM ST STP UADD UIDSSMT UNICEF UWSEIMP WAC
we
WHO WSP-SA
Antyodaya Anna puma Y ojana Asian Development Bank Above Poverty Line Below Poverty Line
Consulting Engineering Services ChiefMunicipal Officer
Central Pollution Control Board City Wide Sanitation Plan
Department for International Development Detailed Project Report
Environmental Planning and Control Organisation Government of India
Government of Madhya Pradesh Human Development Report
Hoshangabad Nagar Palika Parishad Joint Monitoring Programme
Jawaharlal Nehru Urban Renewal Mission Litres per capita per day
Millennium Development Goal Madhya Pradesh
Madhya Pradesh Pollution Control Board Madhya Pradesh Urban Services for the Poor Metric Tonne
National Family Health Survey Non-Government Organisations National River Conservation Plan National Urban Sanitation Policy
Public Sanitary Convenience (Public Toilet) Scheduled Caste
Security Paper Mill Scheduled Tribe
Sewage Treatment Plant
Urban Administration and Development Department
Urban Infrastructure Development Scheme for Small and Medium Towns
United Nations Children's Fund
Urban Water Supply and Environmental Improvement Project Water for Asian Cities
Water Closet
World Health Organisation
Water and Sanitation Programme-South Asia
~····.··~§P
6\\ sanitation progmrn
DEFINITIONS
Slum Area: where the competent authority is satisfied in respect of buildings in an area 'the buildings in that area are in any respect unfit for human habitation; or are by any reason of dilapidation, overcrowding, faulty arrangement of streets, lack of ventilation, light or sanitation facilities or any combination of these factors, are detrimental to safety, health or morals may, by notification, declare such area to be a slum area (MP Slum Area Improvement and Relocation Act, 1976)
Septage: Septage is the liquid and solid material pumped from a septic tank, cesspool, or other primary treatment source
Domestic Sewage: Wastewater generated as a result of household human activities- bathing, cloth washing, excreta flushing, etc.
Sewer: A pipe or conduit that carries wastewater or drainage water
Sewerage: A complete system of piping, pumps, basins, tanks, unit processes and infrastructure for the collection, transporting, treating and discharging of wastewater
Definitions of Household Sanitation Arrangements according to Census 2001
Water closet latrine (WC): The sanitary water flush latrines are those latrines that have water closets fitted with flushing cistern. Such latrines that may be connected to a septic tank or an underground sewerage system will also be recorded as water closet latrines. The faecal matter from these types of latrines is removed without the need for scavenging
Pit latrine: The latrines attached to the pit that is dug into the ground for the reception of night soil are reckoned as pit latrines
Other latrine: This category includes service latrines; latrines serviced by animals such as pigs, etc. and all latrines other than the pit and the water closet types of latrine
Note: the definitions adopted for baseline sanitation survey tally with above definitions.
~wsp
~.,. water and l\\ sanitation program
CHAPTER 1: BACKGROUND 1.1 Background
Excreta and wastewater contain high concentrations of pathogens. Poor excreta and wastewater handling and disposal leads to excreted pathogens entering the environment. This coupled with lack of adequate personal and domestic hygiene; in-sanitary conditions at community level and discharge of untreated wastewater pose high risk to human health. The World Health Organization (WHO) estimates that 2.2 million people die annually from diarrhoeal diseases and that 10% of the population of the developing world are severely infected with intestinal worms related to improper waste and excreta management (WHO 2000).
Recent WHO I Unicef Joint Monitoring Programme (JMP) report (2006) indicates that ' ... To reach the MDG water and sanitation target presents a huge challenge .... nearly 2.6 billion need to gain access from 2005 to 2015 to reach sanitation target .... ' Nearly 0.6 billion of the un-served reside in urban areas. Though this is less than a third of the un-served population in rural areas, the problem of urban sanitation is much more complex. It is exacerbated by high population densities in slums, poor urban infrastructure, lack of secure tenure and poverty.
Improving access to sanitation facilities and management of liquid waste continues to be a major challenge for all ULBs in India. According to census 2001, about 285 million people (54.79 million households) lived in urban areas. Nearly 26 percent of these households lacked access to sanitation facilities (and most were forced to defecate in the open). In the same year, 32 percent of 2.79 million urban households in Madhya Pradesh lacked access to sanitation facilities.
At the beginning of 'Water for Life' decade (2005-2015), National Family Health Survey (NFHS) Round 3 reports that nearly 17 percent urban households, in India, lack access to any kind of sanitation facilities. The coverage at 83 percent however, conceals unpleasant statistics, as it includes nearly 5 percent households accessing 'other' sanitation facilities and about 24 percent households accessing 'shared facility'. The situation on wastewater collection and disposal front is equally critical. A recent Central Pollution Control Board (CPCB, n.d.) report presents a grim picture- 903 Class I and II towns are reported to generate about 29,130 mid wastewater; ofthis merely 21 percent is treated.
Madhya Pradesh, popularly referred as the heartland oflndia, has 338 urban centres (GOMP, 2007). In 2001, the level of urbanization (at about 27 percent) in the state was comparable with the national urbanisation level (28 percent). More than a third of the state's urban population lives in 9 major cities of the state. According to GOMP (2007), in 1991, only about 45 percent urban households had access to all three facilities of water, sanitation and electricity. By 2001, this proportion went up to about 62 percent. Though this is a significant progress, there is still a long way to achieve universal access. Nearly 12 percent urban households lack access to safe drinking water. The status of urban sanitation is abysmal with only about 53 percent households reporting access to improved sanitation facilities. Among the rest, 15 percent access 'other' latrines and a large proportion of households (32 percent) lacked access to sanitation facilities. Thus, improving access to improved sanitation facilities continues to be a major challenge despite more than two decades of focus and attention to the sector.
The governments of developing countries and donor community have been approaching the challenge with renewed vigour to achieve the Millennium Development Goals (MDG). The year 2008 was declared by the United Nations as the International Year of Sanitation.
Urban_ San_ Situation Analysis: Hoshangabad WSP-SA February 2009
For Government of India, this is a watershed year marked by the adoption of 'National Urban Sanitation Policy' with a vision - 'All Indian cities and towns become totally sanitised, healthy and liveable and ensure and sustain good public health and environmental outcomes for all their citizens with a special focus on
Box 1.1 National Urban Sanitation Policy: Key Goals
• Awareness generation and behavioural change
• Open defecation free cities
• Integrated city-wide sanitation
• Sanitary and safe disposal
• Proper operation and maintenance of all sanitary installations
Source: NUSP, Gol
hygienic and affordable sanitation facilities for the urban poor and women.'
Ongoing centrally sponsored programmes that contribute substantially to urban infrastructure (including water supply and sanitation) development include:
Jawaharlal Nehru National Urban Renewal Mission (JNNURM): Focuses on state-wide municipal reforms and infrastructure development in 63 mission towns/ cities1• The JNNURM comprises of two sub-missions on Urban Infrastructure and Governance and Basic Services for the Poor
Urban Infrastructure Development Scheme for Small and Medium Towns CUIDSSMT):
Cities not covered under the JNNURM are covered under the UIDSSMT. Started around the same time as the JNNURM, this scheme subsumes the earlier schemes of Integrated Development of Small and Medium Towns (IDSSMT) and Accelerated Urban Water Supply Programme (AUWSP). This scheme is almost similar to JNNURM in terms of admissible components and funding mechanisms.
- National River Action Plan CNRAP): This is Goi's largest wastewater management programme aimed at reduction/ control of pollution in rivers (and water bodies). The programme launched in 1986 as Ganga Action Plan was later on expanded nationally.
- Integrated Low Cost Sanitation (ILCS): The Centrally Sponsored Scheme of Low Cost Sanitation for Liberation of Scavengers started from 1980-81 initially through the Ministry of Home Affairs and later on through the Ministry of Welfare. From 1989-90, it came to be operated through the Ministry of Urban Development and later on through Ministry of Urban Employment and Poverty Alleviation now titled Ministry of Housing
& Urban Poverty Alleviation.
In 2008, the Gol has revised the guidelines of the scheme. Accordingly, the objective of the Scheme is to convert/ construct low cost sanitation units through sanitary two pit pour flush latrines with superstructures and appropriate variations to suit local conditions (area specific latrines) and construct new latrines where EWS household have no latrines and follow the in-human practice of defecating in the open in urban areas.
Integrated Housing & Slum Development Programme CIHSDP): aims at combining the existing schemes of V AMBA Y and NSDPunder the new IHSDP Scheme for having an integrated approach in ameliorating the conditions of the urban slum dwellers who do not possess adequate shelter and reside in dilapidated conditions. The scheme is applicable to all cities and towns as per 2001 Census except cities\towns covered under Jawahar Lal Nehru Urban Development Renewal mission (JNNURM).
1.2 MP State Programmes
The state government, for past few years, has been focussing on urban infrastructure through various projects. Key projects include:
1 Cities with over a I million population, state capitals, places of tourist importance
Urban_ San_ Situation Analysis: Hoshangabad WSP-SA February 2009 2
~~
... wsp
~·'• water and
l\\ sanitation program
a. Project Uday (Urban Water Supply and Environmental Improvement Project in MP - UWSEIMP) is being implemented with financial assistance from Asian Development Bank (ADB). The project aims at promoting sustainable growth and reducing poverty in the project cities of Bhopal, Gwalior, Indore, and Jabal pur.
b. Water for Asian Cities (WAC) has been initiated with financial assistance from UN Habitat in four major cities of Bhopal, Indore, Jabalpur and Gwalior. Under the project, poverty pocket situational analysis has been completed; it has identified about 20,000 poor households for interventions through NGOs.
c. Jawaharlal Nehru Urban Renewal Mission (JNNURM) and Urban Infrastructure Development Scheme for Small and Medium Towns (UIDSSMT): Launched by Government of India in 2005, four cities (Bhopal, Indore, Jabalpur and Ujjain) are covered under JNNURM and remaining towns are covered under UIDSSMT. These programmes aim at integrated development of infrastructure services in the cities covered, securing effective linkages between asset creation and asset management so that the infrastructure-related services created in the cities are not only maintained efficiently but also become self-sustaining over time.
d. MP Urban Services for the Poor (MPUSP): Madhya Pradesh Urban Services for the Poor is a five-year (2006-11) programme working with the Government of Madhya Pradesh and selected urban local bodies (ULBs) to build their capacity to deliver better services for the poor. Key project components include - i) helping cities and state government to bring about reform; ii) improving the ways in which urban local bodies and their staff work; and iii) develop community capacity to improve their access to services. The programme was initially focusing on four ULBs (Bhopal, Gwalior, Indore and Jabalpur);
10 more ULBs have been recently added for intervention.
Municipal Reforms
The State has initiated reforms by suitably amending municipal act by incorporating the provisions of 74th Constitutional Amendment Act [Functions of ULBs are presented in Annex 6}. Several initiatives such as accounting reforms, empowering ULBs by reducing the role of parastatals have already been implemented. A system for self-assessment of property tax has been introduced as early as 1996.
Planning for Total Sanitation in Cities
On the sanitation front the Government of Madhya Pradesh is in the process of launching Urban Sanitation Mission with the overall goal of improving the quality of life of the urban poor by enhancing access to better sanitation facilities, ensuring sustainability with a holistic approach. The objectives of the mission are:
Making cities free from open defecation
Create awareness about sanitation and its impact on health and environment and bring it to centre-stage of policy debate
Increasing household coverage by individual toilets, especially for the urban poor and un-served households on demand basis
Safe collection, treatment and disposal of toilet and kitchen wastewater 100 percent collection, treatment and disposal of solid wastes
Research and extension on low cost solutions
Develop appropriate legal and institutional mechanism for ensure lasting benefits for urban areas
Regulation of health and environmental outcomes and
Monitoring and evaluation on a sector wide and citywide basis
Urban_ San_ Situation Analysis: Hoshangabad WSP-SA February 2009 3
~~§P
6\\ sanitation program
The Mission's strategy will be to focus on each town/ city as a basic unit. Key implementation phases identified are- i) start-up activities, ii) IEC activities, iii) providing public facilities, school & public offices' sanitation, putting SWM systems in place, iv) on- site coverage for sanitation, v) major infrastructure creation, and benefit monitoring and evaluation.
The State is in the process of formulating urban sanitation policy. It is expected to give further impetus to improving urban sanitation scenario across the state. GoMP has already initiated a state-wide survey, to assess baseline sanitation situation, across all the urban centres ofthe state. Simultaneously, the Urban Administration and Development Department (UADD) has proposed to pilot development of city wide sanitation plans. The Water and Sanitation Programme-South Asia (WSP-SA) and Department for International Development (DflD) have agreed to support the initiative. City of Hoshangabad and one zone in Gwalior Municipal Corporation area have been selected to pilot the preparation of City Wide Sanitation Plans.
City Wide Sanitation Plan (CSP): The National Urban Sanitation Policy provides a framework for City Wide Sanitation Plan. The framework has outlined elements (presented in Chapter 6) of planning, implementation and M&E of city wide sanitation. These are generic and presented to assist in thinking through the challenge. The framework also cautions that though some of these appear to be linear, the process needs to be highly iterative.
The CSP preparation process is expected to evolve over time. The data collection for Hoshangabad town is complete. This report analyses the baseline data and presents situational analysis for the town.
A TARU study (2008) on 'Sewerage and Sanitation Interventions in India' presents guiding principles of a City-wide Sanitation Plan; these are summarised in Box 1.1 below.
Box 1.2: City-wide Sanitation Plan: Guiding Principles
Comprehensive, Long-Term and Holistic: The CSP must be comprehensive and holistic to account for the entire population, especially the poor and those who are forced to defecate in the open. Cover a spectrum of sanitation arrangement including household sanitation arrangements, wastewater collection, treatment and disposal arrangements
Specific and Localised: The CSP should respond to specific condition of the city (rather than adopting one size fit all approach)
Additive and Consolidating the Existing Infrastructure: Reversing the current trend of exclusive focus on new infrastructure creation, the CSP should aim at first consolidating the existing infrastructure, and then on new infrastructure connections and improving services levels
Participatory: The process of CSP formulation should involve a wide range of public consultation with various stakeholders, especially with the poor and vulnerable and women
Aiming at Financial Sustainability: The CSP should aim at financial sustainability and independence including raising the resources for capital investments in the medium to long run
Environmentally Sustainable: The CSP should be environmentally sustainable. It must promote and provide incentives for green and clean technologies. It should explore ways by which environmental sustainability can be achieved through reduce, recycle and reuse technologies
Source: T ARU 2008
1.3 Methodology, Constraints and Limitations Methodology
This report is primarily based on review of secondary literature, analysis of census 2001 data, baseline sanitation survey (2008) data, discussions with key informants and a quick reconnaissance visit (WSP-SA team) to Hoshangabad. Key informants included- Deputy Mayor, the Chief Municipal Officer and other municipal staff, representative of consultant
Urban_ San_ Situation Analysis: Hoshangabad WSP-SA February 2009 4
~,
YY§P
6\\ sanitation proyrarn
(CES2) who prepared the sewerage and sewage treatment scheme for Hoshangabad town.
During the city visit, the team visited different pockets of the town including market areas, residential colonies, slum pockets, slum pockets, bathing ghats (along River Narmada), public sanitary conveniences and proposed sewage treatment plant site.
Census 2001 housing data on access to basic amenities was analysed to estimate household coverage by various sanitation arrangements. Data collected from recent baseline sanitation survey was analysed to estimate the household coverage by various sanitation arrangement.
The two datasets were compared to understand the trends, during past 8 years, in coverage and access. The report also draws from detailed report on proposed scheme for collection and treatment of wastewater.
Constraints and Limitations
Major constraint identified as of now is the limited information on river water quality. As a result, it is difficult to analyse the extent and pattern of river pollution resulting from disposal of untreated domestic wastewater.
Another constraint is that the sanitation survey has not captured some of the critical aspects of urban sanitation such as sanitation arrangement used by households currently lacking the facility, lack of preference for either individual or community sanitation facility, and segregation of slum households. As a result these issues could not be analysed further.
~ Sanitation arrangements used by households currently lacking individual facilities: This information is critical to determine extent of open defecation and also to quantify the proportion of households using community sanitation facilities.
~ Sanitation arrangements in public institutions: The survey has not covered the status of sanitation in public institutions. Most critical among these are the educational institutes- both private and government
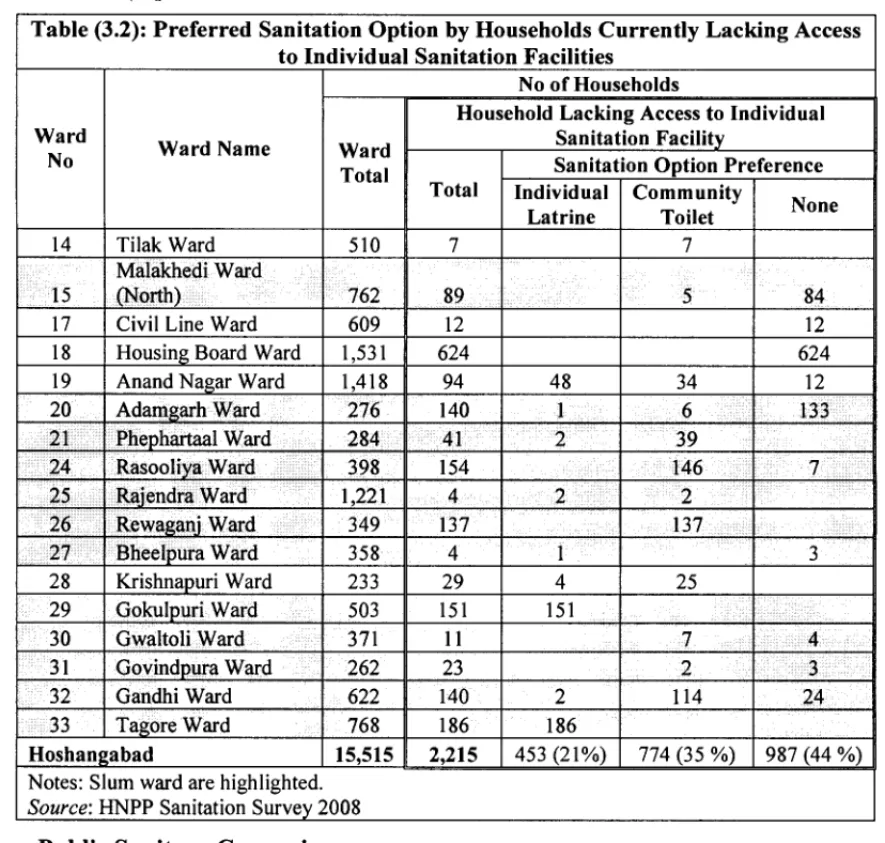
~ Lack of preference by households (currently lacking sanitation facilities) to either individual or common facilities: The survey identified 2,215 households that lack access to individual sanitation arrangements. 21 percent of these households have indicated preference for individual household latrine and 35 percent have indicated preference for community sanitation facilities. However, nearly 44 percent households have not indicated any preference. The survey fails to capture reasons for not selecting either of the option.
Nevertheless, the baseline sanitation survey serves as a good starting point.
2 Consulting Engineering Services, New Delhi
Urban_ San_ Situation Analysis: Hoshangabad WSP-SA February 2009 5
~wsp
... ~~, water and
. . . \ \ sanitation program
CHAPTER2: HOSHANGABAD- A BRIEF PROFILE
Hoshangabad, located at 22° 46' N and 77° 44' E, is picturesquely placed along the southern bank of Narmada River, while north of the river stretch the Vindhyan hills. The name of the place is derived from Hoshangshah Ghori, Sultan of Malwa, who is said to have founded Hoshangabad in 151h century e].
Figure (2.1): India Map showing location
Hoshangabad is well connected from Bhopal, the state capital, by both- road and railway. The town is about 70 km south of Bhopal. !tarsi, a major railway junction, that connects major towns across the country, is only about 18 km away from Hoshangabad. Located at about 330 m above mean sea level, the average minimum and maximum temperatures are 11 °C and 41 °C respectively.
Average annual precipitation is reported to be about 1,340mm.
of Hoshangabad
Source: Devlnfo
N
&
•J
'
The town has religious importance. Narmada being Holy River, thousands of pilgrims take bath in it. Several bathing ghats have been built along the riverbank for the convenience of pilgrims. Rough estimates suggest that almost 0.10 to 0.15 million pilgrims visit on festive occasions. Such occasions are reported to be almost once every month. Hoshangabad is district and Tehsil headquarter and important agriculture trade centre in the region.
Hoshangabad is also nearest big town from two important locations of tourist attraction - Panchmarhi4 and Bhimbetika5• It is reported that even on ordinary days about 10,000 to 15,000 visitors arrive in Hoshangabad.
2.1 Demography
In 1961, the town had a population of 19,284, which has grown more than 5 times in 40 years. Over 1961-1991 period, town population increased at more than 50 percent; however, 1991-2001 decade saw a considerable decline in growth rate with an increase of only about 37 percent.
Table (2.1): Population Growth (1961-2001) Sl # Year Population Decennial Growth
(percentage)
1 1961 19,284
2 1971 29,434 52.63%
3 1981 46,300 57.30%
4 1991 70,914 53.16%
5 2001 97,424 37.38%
Source: Census of India
According to census 2001, Hoshangabad had a population of 97,424. This comprised of 52 percent Male population and 48 percent Female population. Scheduled Cast (SC) and Scheduled Tribe (ST) population comprised about 15 percent and 6 percent respectively.
3 Imperial Gazetteer of India available at
<http://dsal.uchicago.edulreference/gazetteer/pager.html?objectid=DS405.1.134 V 13 197.gif>
4 Hill station
5 Famous for cave paintings
Urban_ San_ Situation Analysis: Hoshangabad WSP-SA February 2009 6
~.wsp
~~.,. water and a\\ sanitation program
2.2 City Governance
The Hoshangabad Nagar Palika Parishad (HNPP) was established in 18696. Hoshangabad is classified as a Class II town and has a municipal council in place. The territorial jurisdiction of the municipality extends over an area of 24 sq km.
Figure (2.2): Hoshangabad- Ward Map
legend
/ ' Railway
, . • ' Mun!Cl!l<11 Boundary
~ Natlonalllighway
11111111111 River
Nalah
= Canal
c::J Mun!Cipal Ward
Note: Numerals within ward boundary represent ward number; for ward names refer Annex (1 ).
Source: Prepared using Hoshangabad municipal ward map and Google Earth Image
The municipality has 33 wards as shown in Figure (2.2) above. The 33 member municipal council is led by a Chairperson (Mayor), directly elected by the people. Day-to-day business administration is led by Chief Municipal Officer (CMO) - an officer from State Municipal Services (Executive cadre). The CMO is also responsible for implementation of municipal council's decisions. The Chief Municipal Officer is supported by officers leading various departments; key municipal departments include - Health, Engineering, Revenue and Accounts. Health and Engineering departments are led by staff belonging to State Municipal Services - health and engineering cadre respectively. Hoshangabad Municipality has a sanctioned strength of 357 employees. It is interesting to note that all the staff positions are filled.
The municipality is responsible for provision of basic services - water supply, sanitation, street-lighting and maintenance of roads, parks and recreational facilities. The municipality is also responsible for planning and sanctioning housing plans and layouts. With the incorporation of provisions of 74th amendment, the role of parastatals such as Public Health Engineering Department (PHED) has been reduced substantially. Responsibility for planning, extension and day-to-day service provision within municipal limits now rests with the municipal staff.
6 Imperial Gazetteer of India available at
<http://dsal.uchicago.edu/reference/gazetteer/pager.html?objectid=DS405.l.l34 V 13 l97.git>
Urban_ San_ Situation Analysis: Hoshangabad WSP-SA February 2009 7
~,wsp
~ ~, water and
l\\ sanitation program
Main municipal revenue sources include- property, license fees and rent from market buildings. Separately Municipality receives development grants from State and Central governments for implementation of various schemes.
2.3 Assets of Hoshangabad Nagar Palika Parishad
Hoshangabad municipality currently maintenance nearly 106 km roads; 154 km drains (94 kmpucca and 60 km kutcha); nearly 58 tube-wells and 71 hand-pumps; and 6 public sanitary conveniences (PSC) and 20 public urinals. The municipality also has mechanical equipment - one vacuum emptier truck used for septage clearance and 2 Lorries and 6 tractor trailers for garbage clearance. The municipality also owns shops (that are rented out). Breakdown of assets owned and maintained by is presented in Annex 4.
2.4 Slums and Squatter Settlements
The MP Gandi Basti Kshetra (Sudhar Tatha Nirmulan) Act 1976 (MP Slum Area- improvement and Relocation Act) specifies that - where the competent authority is satisfied in respect of buildings in an area 'the buildings in that area are in any respect unfit for human habitation; or are by any reason of dilapidation, overcrowding, faulty arrangement of streets, lack of ventilation, light or sanitation facilities or any combination of these factors, are detrimental to safety, health or morals may, by notification, declare such area to be a slum area. ' Further to specify that a building is unfit for human habitation, the criteria to be considered are 'repair, stability, freedom from damp, natural light and air, water supply, drainage and sanitary conveniences, facilities for storage, preparation and cooking of food andfor the disposal of wastewater.
Discussions with officials on the process of delineating slums indicated that - owing to difficulties in exactly delineating such pockets, entire ward is declared as slum ward. Thus everyone in a declared ward is counted under slum population. As a result reported slum population is much higher at 48,111. This is nearly half the town population. The proportion is more than thrice the state average, wherein the proportion of slum population is reported at
15 percent.
According to municipal records, currently there are a total of 17,833 Above Poverty Line (APL) families and 9,360 Below Poverty Line (BPL) families. Further 1,000 families are listed as beneficiaries under Antyodaya Annapurna Y ojana (AA Y). BPL and AA Y families together add up to 10,360 and constitute 37 percent of the total 28,193 (17,833 APL, 9,360 BPL and 1,000 AA Y) families7• There are a total of 15 slum wards in Hoshangabad as presented in Figure (2.3) below.
7 The total number of households as per sanitation survey-2008 is only 15,515.
Urban_ San_ Situation Analysis: Hoshangabad WSP-SA February 2009 8
~··wsp
.... ~"" water and 6\\ sanitation prograrn
Figure (2.3): Hoshangabad- Slum Wards
Legend
... Ra11way
·' Mun;cipal Boundary
~ Nal>Onal ftighway
-
Muntcipat Wards NaHan Qlnal Rwerc:J Non-slum ward
ez:za Slum Wiud
Note: Numerals within ward boundary represent ward number; for ward names refer Annex (1).
Source: Prepared using Hoshangabad municipal ward map and Google Earth imagery
Urban_ San_ Situation Analysis: Hoshangabad WSP-SA February 2009 9
~~§P
. . . \ \ sanitation program
CHAPTER3: URBAN BASIC SERVICES
GOMP (2007) presents a snapshot on the status of basic amenities in the urban MP.
'Drinking water, however, continues to be a critical area for the state as demonstrated in recurring droughts in some part of the state over the last four years. The state government, in its submission to the Vidhan Sabha, stated that water supply crisis was apprehended in 279 urban areas in 3 7 drought affected districts of the state. The problem was also envisaged in the remaining 55 towns of the state where the existing water schemes had become obsolete.
In addition to water, sewerage, drainage, and solid waste disposal facilities are the most critical problems in urban settlements of MP as they are grievously affecting the environment, apart from emerging as urban eyesores. '
Household Count: 2001 (Census) 7 2008 (Baseline Sanitation Survey)
As discussed earlier, the GoMP has initiated a state-wide survey, to assess baseline sanitation situation, across all the urban centres of the state. The data collected from the survey in Hoshangabad town is used for analysing the sanitation situation presented in this report.
According to census 2001, there were a total of 13,739 households. The household tally, according to sanitation survey (2008) has registered an overall increase of 1,776 households (13 percent). Logically, there should be an increase in number of households in all wards; however, a decrease is registered in 12 wards as presented in Table (3.1) below. Highest decrease is registered in SPM East ward (75 percent). Other wards registering more than 25 percent decrease are- Adamgarh ward (54 percent), Subhashganj ward (52 percent), SPM west (33 percent) and Govindpura ward (31 percent), Ganeshganj (29 percent) and Shanichara ward (28 percent).
Table (3.1): Ward-wise Change in Household Count -Census 2001 to Sanitation Survey 2008
NoofHH Ward
Name Slum
Census Sanitation Change Over 2001 HH
No Ward Count
2001 Survey (2008)
(+/-)Nos Percentage
1 Shashri Ward - 372 347 -25 -7%
2 Shanichara Ward - 312 224 -88 -28%
3 Jagdishpura Ward - 217 401 184 85%
4 Mangalwara Ward - 219 237 18 8%
5 Narayanganj Ward - 144 200 56 39%
6 Ramganj Ward Yes 214 330 116 54%
7 Azad Ward Yes 241 249 8 3%
8 Sub hash Ward - 341 162 -179 -52%
9 Balaganj Ward - 180 212 32 18%
10 Ganeshganj Ward - 181 128 -53 -29%
11 Janakpuri Ward - 288 293 5 2%
12 Sadar Bazar Ward - 403 371 -32 -8%
13 Kothi Bazar Ward - 462 692 230 50%
14 Tilak Ward - 239 510 271 113%
15 Malakhedi Ward (North) Yes 569 762 193 34%
16 Malakhedi Ward (South) Yes 728 805 77 11%
17 Civil Line Ward - 445 609 164 37%
18 Housing Board Ward - 1,577 1531 (-46) -3%
19 Anand Nagar Ward - 985 1418 433 44%
20 Adamgarh Ward Yes 606 276 ( -330) -54%
21 Phephartaal Ward Yes 347 284 (-63) -18%
Urban_ San_ Situation Analysis: Hoshangabad WSP-SA February 2009 10
~·.·.·wsp
~..., waterand l\\ sanitation program
Table (3.1): Ward-wise Change in Household Count -Census 2001 to Sanitation Survey 2008
NoofHH Ward
Name Slum Change Over 2001 HH
No Ward Census Sanitation Count
2001 Survey (2008)
(+/-)Nos Percentage
22 SPM Ward (East) - 444 112 ( -332) -75%
23 SPM Ward (West) - 413 277 ( -136) -33%
24 Rasooliya Ward Yes 290 398 108 37%
25 Rajendra Ward Yes 660 1221 561 85%
26 Rewaganj Ward Yes 345 349 4 1%
27 Bheelpura Ward Yes 284 358 74 26%
28 Krishnapuri Ward - 282 233 (-49) -17%
29 Gokulpuri Ward Yes 354 503 149 42%
30 Gwaltoli Ward Yes 265 371 106 40%
31 Govindpura Ward Yes 380 262 (-118) -31%
32 Gandhi Ward Yes 419 622 203 48%
33 Tagore Ward Yes 533 768 235 44%
Total 13,7398 15,515 1,776 13%
Source: Census 2001- quoted in EPCdl CES (2006), Sanitation Survey 2008
Other 21 wards have registered an increase in number of households. Wards with more than 50 percent increase are- Tilak ward (113 percent), Jagdishpura and Rajendrapura (85 percent each), Ramganj (54 percent) and Kothi bazaar ward (50 percent).
3.1. Household Sanitation
Box 3.1 Household Latrine Typology
Water closet latrine (WC): The sanitary water flush latrines are those latrines that have water closets fitted with flushing cistern. Such latrines that may be connected to a septic tank or an underground sewerage system will also be recorded as water closet latrines. The faecal matter from these types of latrines is removed without the need for scavenging
Pit latrine: The latrines attached to the pit that is dug into the ground for the reception of night soil are reckoned as pit latrines
Other latrine: This category includes service latrines; latrines serviced by animals such as pigs, etc. and all latrines other than the pit and the water closet types of latrine
Source: Census 2001 (Definitions adopted by Baseline Sanitation Survey 2008 match with these definitions.)
According to census 2001, nearly three quarters of households had access to sanitation facilities. This included - 51 percent households with 'WC' type latrines, 10 percent households with 'pit latrines' and 14 percent households with 'other' type latrines. Nearly 25 percent households lacked access to household sanitation facility.
Analysis of recent household sanitation survey covering 15,515 households (within HNPP area) indicates that nearly 85 percent of the households access individual sanitation facilities.
This includes 74 percent households accessing WC type latrines, a little less than 11 percent households accessing pit type latrines and less than one percent households accessing 'other' latrines.
8 This information needs to be cross checked, census Household series data indicates a total of 17,424 households
9 Environmental Planning and Control Organisation, Bhopal
Urban_San_Situation Analysis: Hoshangabad WSP-SA February 2009 11
~,~§P
Ill\\ sanitation program
There has been about 10 percent reduction in the proportion of households without latrines.
Proportion of household with 'other10' type latrines has also reduced from 14 percent in 2001 to less than 1 percent (64 households) in 2008 as presented in Figure (3.1) below.
Figure (3.1): Household Sanitation Arrangements (2001 and 2008)
10%
51%
74%
I 12!1 we []Pit Latrine • Other 0 No Latrine I I lSI we fJ Pit Latrine • Other ONone I Source: Census 2001 Base: 17,420 Source: HH Sanitation Survey Base: 15,515 Notes: WC- Water closet type latrine connected to septic tank or sewerage
Over the same period, proportion households accessing 'WC' (connected to septic tanks) and 'pit latrines' has increased by 23 percent and 1 percent respectively. Substantial decrease in proportion of 'other' latrines indicates a shift in urban user's preference towards improved sanitation facilities. [In case of households without sanitation facilities, the survey does not capture current sanitation arrangements - share with others/ community toilet or practice open defecation].
The change in proportion of latrine types (with reference to 2001) also shows that latrine upgrading has happened at faster rate compared to new addition. Though it is not clear, new addition may have been constrained by space or tenure related issues for poor households.
Higher proportion of pit latrines are reported from Adamgarh, Phephartaal, Bheelpura and Tagore ward, where the ratio of pit latrine to
we is 71:61, 230:2, 161:158 and 409:164 respectively. All these are categorised as slum wards. In most other wards, WC type latrines are most common. Ward wise household sanitation arrangements are presented in Annex 5.
Figure (3.2): Pit Latrine with pucca
""'"~"'r'•tr•" ... t''"""' Built Under ILCS Scheme
Ward-wise analysis of survey results indicate following:
• 100 percent sanitation coverage is reported from 9 wards: Shashri ward, Narayanganj ward, Balaganj, Janakpuri, Sadar Bazar, Malakhedi South, SPM (East and West) and Rajendra Ward
• More than 25 percent households each in 9 wards report lack of access to sanitation facilities: Ramganj ( 41 percent), Azad ward (31 percent) and Subhashganj (32 percent),
10 'Other' type includes latrines where night soil is- lifted by scavengers, serviced by animals or disposed to open drainage
Urban_ San_ Situation Analysis: Hoshangabad WSP-SA February 2009 12
Housing board ward (41 percent), Azamgarh ward (51 percent), Rasooliya (39 percent), Rewaganj (41 percent), Gokulpuri (30 percent) and Tagore ward (25 percent).
• 27 percent of all households lacking access to sanitation facilities are concentrated in Housing board ward (No 18). This indicates presence of large slum population. However, this is not declared as a slum ward.
The sanitation survey reports that there are only 64 households that use 'other' type latrines.
This includes - 26 latrines where night soil is disposed in open drainage and 19 latrines each where night soil is lifted by scavengers and serviced by animals. All manually scavenged service latrines are located in Subhashganj (ward 8). A detailed ward-wise breakdown 'Other' type latrine user households is presented in Annex (3).
A total of 2,311 households reported lack of access to sanitation facilities. Out of this, 96 records are not considered for further analysis, as there are contradictions11 in reported sanitation arrangements for these households (list of these households is presented in Annex
6).
During the survey, 2,215 households currently lacking sanitation facility were asked for their preference for sanitation facility (from - individual household latrine/ community toilet/
none). About 21 percent households expressed preference for individual facilities and little more than a third (35 percent) expressed preference for common facilities. However, nearly 44 percent households expressed preference for neither individual household latrine nor community toilet. As the survey does not probe further, reasons for household choice remain unanswered. Ward level analysis indicates following:
• Out of 26 wards, where households have expressed preference for community toilet, 11 are slum wards
• All households (currently lacking access to sanitation) in ward 17 and 18 (Civil lines and Housing board ward respectively) have rejected both options- individual and community toilet
• All households in ward no 29 and 33 (Gokulpuri and Tagore ward respectively) have expressed preference for individual latrines.
Table (3.2): Preferred Sanitation Option by Households Currently Lacking Access to Individual Sanitation Facilities
No of Households
Household Lacking Access to Individual Ward
Ward Name Ward Sanitation Facility
No Total Sanitation Option Preference
Total Individual Community
Latrine Toilet None
2 Shanichara Ward 224 5 3 2
3 Jagdishpura Ward 40I 23 I I9 3
4 Mangalwara Ward 237 9 7 2
5 N arayanganj Ward 200 I I
6 Ramgan_j Ward 330 134 5 116 13
7 Azad Ward 249 75 42 33
8 Subhashganj Ward I62 52 4I II
IO Ganeshganj Ward I28 I I
I3 Kothi Bazar Ward 692 69 I 4 28
11 These households do not have individual household sanitation facilities and are reported to use either community toilet blocks or practice open defecation.
Urban_ San_ Situation Analysis: Hoshangabad WSP-SA February 2009 13