Conference Paper
Physical modelling of RC concrete structures using additively manufactured reinforcement of submillimeter diameter
Author(s):
Del Giudice, Lorenzo; Wrobel, Rafal; Leinenbach, Christian; Vassiliou, Michalis F.
Publication Date:
2021
Permanent Link:
https://doi.org/10.3929/ethz-b-000476387
Originally published in:
http://doi.org/10.5592/CO/1CroCEE.2021.244
Rights / License:
In Copyright - Non-Commercial Use Permitted
This page was generated automatically upon download from the ETH Zurich Research Collection. For more information please consult the Terms of use.
ETH Library
PHYSICAL MODELLING OF RC CONCRETE STRUCTURES USING ADDITIVELY MANUFACTURED REINFORCEMENT OF
SUBMILLIMETER DIAMETER
Lorenzo Del Giudice(1), Rafal Wrobel(2), Christian Leinenbach(3), and Michalis F. Vassiliou(4)
(1) PhD Student, ETH Zurich, delgiudice@ibk.baug.ethz.ch
(2) PhD Student, Empa (Swiss Laboratories for Materials Science and Technology), rafal.wrobel@empa.ch
(3) Dr., Empa (Swiss Laboratories for Materials Science and Technology), christian.leinenbach@empa.ch
(4) Prof. Dr., ETH Zurich, vassiliou@ibk.baug.ethz.ch
Abstract
This paper claims that a major source of error in Seismic Analysis of Structures is the assumptions used to scale up from component- to system-level behavior. It also claims that validation of numerical models should be performed statistically. As a statistical validation requires multiple virgin specimens, the paper suggests the use of a 3D printer to construct the reinforcement of micro RC specimens (1:40) to be tested in a geotechnical centrifuge. It presents some first tests on gypsum-based micro concrete, additively manufactured rebars with diameters as low as 0.35mm, and small scale RC beams. The properties observed seem to resemble the ones of full scale RC components. Given the material properties, Opensees is able to accurately capture the behavior of the micro-beam.
Keywords: Model Validation, Physical Modelling, 3D printing, Additive Manufacturing, Reinforced Concrete, Centrifuge Modelling, Small Scale Testing
1. Introduction
Structural models blatantly fail to predict the response of shake table tests. This paper claims that the problem sources from the uncertainty/error introduced to scale up from the component-level cyclic to the system-level dynamic behavior of the problem. It also claims that the appropriate way to validate models in Earthquake Engineering is to perform multiple tests on virgin specimens under different ground motions, and to demand that the model predict the Cumulative Distribution Function (CDF) of the maxima of the response quantity of interest. Then manufacturing the virgin specimens becomes the constraint. Therefore, this paper suggests, that the specimens be constructed at a small scale (1:40) using an additive manufacturing technology to fabricate and place the reinforcement. A geotechnical centrifuge should be used to preserve similitude of stresses.
2. Statement of the problem
Time history analysis is considered as the state of the art in modeling of the seismic response of reinforced concrete (RC) structures. Its most widespread validation procedure is the test of predicting the response of an RC structure tested on a shaking table. However, blind prediction contests show that the contestants fail in predicting the response of the tested specimens with reasonable accuracy, even for structures much simpler than the ones constructed in practice, and even when the structural properties and measured excitation are given to the contestants [1]. For example, a simple RC bride pier was tested on the shaking table of UCSD in 2010 under 6 ground motions [2-3], and a total of 41 expert teams (17 from professional practice and 24 from the academia) were invited to predict the response.
The measured response and the prediction for the maximum top displacement are indicatively shown in Figure 1. There is a large dispersion of the numerical results and many predictions grossly underestimate or overestimate displacements. In the context of post-Galileo science, the above indicative results directly question current analysis and design methods.
Figure 1. Left: Bridge column tested in UCSD [2]. Middle: Maximum top displacements predicted by the blind prediction contest contestants [3]. Right: Number of predictions for each of the six suggested failure modes [3]
Figure 2. Schematic representation of material to component to system level transition.
In order to track the main source of the error, one can break down the sources of error and uncertainty at 3 levels: Material, Component, and System Level. Given the behavior at each level, the engineer makes certain (good or bad) assumptions to level-up. For example, for given material properties in cyclic loading we use the beam theory and a set of assumptions for the interaction of rebars and concrete to reach the component level cyclic behavior. Then, using another set of assumptions (boundary conditions, interaction of components, damping model, numerical integration scheme) we reach the system level. Moreover, one should discriminate between quasi-static and dynamic behavior. Contrary to blind prediction of system-level dynamic behavior, predicting the component-level cyclic behavior has been proven a more successful process [4-6]. Therefore, it is reasonable to assume that the main source of error is the assumptions that earthquake engineers do to scale up from component-level cyclic to system-level dynamic behavior.
This is in accordance with Bradley [7]: He claims that current uncertainty propagation methods usually focus on the first two levels of modelling, while it is often the transition from component to system level that induces the largest error. Apart from very insightfully illustrating the above problem and identifying its solution “as a key research area in the coming years” Bradley [7] does not seem to offer a way of addressing it - and to our knowledge such a way has not been offered in the literature. It is worth mentioning that there is currently no consensus on fundamental issues of structural modelling:
Important figures of Earthquake Engineering disagree on conceptual issues like fiber vs lumped plasticity, or how damping should be modelled. This paper claims that this disagreement sources from the lack of a large database of full-scale dynamic tests to serve as a validation benchmark.
3. The concept of statistical validation
Bachmann et al. [8-9] claimed that the conventional validation test of reproducing the experimentally obtained response to a particular ground motion with acceptable accuracy is too strict of a validation test for structural models. The Earthquake Engineering design problem involves predicting the statistics of the response to an ensemble of ground motions characterizing a given seismic hazard; not to a single ground motion. This is a weaker model validation test that requires that the
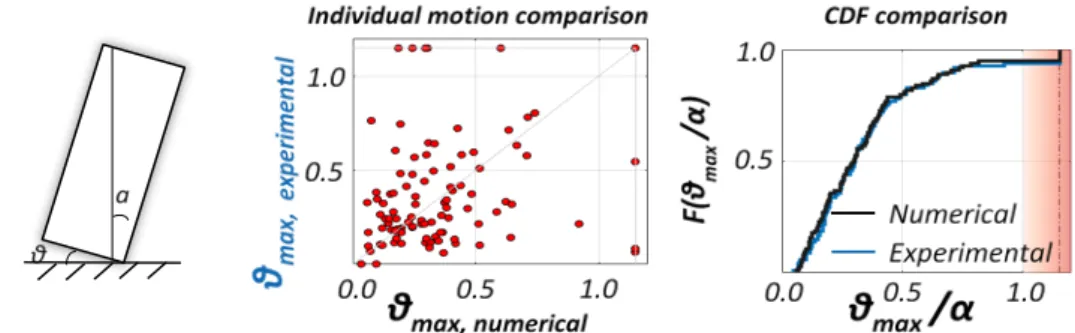
Figure 3. Left: Uplifting oscillator; Middle: Comparison of the maximum rotation obtained experimentally and numerically: Individual motion comparison; Right: CDF Comparison. Adapted from Bachmann et al. (2018).
structural model only be unbiased and introduce less uncertainty than the uncertainty of the excitation itself. Bachmann et al. [8-9] applied this weaker (but sufficient) validation procedure on the 1963 Housner dynamic response model of an uplifting structure (Figure 3, left). They performed 600 shaking table tests using a well-defined and repeatable uplifting structure as well as 600 numerical simulations of these tests, and compared both the individual test responses and the statistical aggregates of these responses focused on predicting limit states such as overturning or maximum tilt angle (Figure 3). They showed that the 1963 Housner model passes the weak validation test (Figure 3, right) even though it fails the strong validation test (Figure 3, middle). In other words, in this case the motion-to-motion variability is more important than the accuracy of the structural model. Therefore, the model is good enough for the scope of Earthquake Engineering.
It is worth noting that the concept of comparing seismic analysis methods in terms of the statistics of the response to sets of ground motions rather than in terms of individual responses is not something novel in Earthquake Engineering. It can be seen in Chapter 23 of the 4th edition of Chopra’s Structural Dynamics textbook [10]. However, up to now it involved comparisons between different analysis methods (usually a more approximate against a more refined, taken as benchmark); not between an analysis method and experimental tests.
The optimal validation procedure question extends beyond Earthquake and Structural Engineering. Roy and Oberkampf [11] describe a comprehensive framework for verification, validation, and uncertainty quantification in scientific computing that resembles the method proposed herein.
Extending this statistical validation method to more realistic structures is not trivial: Since testing of RC specimens, involves damaging them, one would need multiple virgin specimens. This is cost- and time-wise not viable in full scale, and this is the reason why researchers only perform comparisons between individual excitations.
4. Testing of micro specimens
To address the above contradiction, we restrict the problem from the statistical validation of the whole numerical modelling procedure (which is impossible) to the statistical validation of the assumptions made to scale up from component-level to system level dynamic response. The latter can be performed with multiple virgin small-scale models (say 1:40 scale) in a centrifuge. A similar concept can be applied to structures of other material such as masonry, as described by Del Giudice et al. [12].
As geotechnical engineers often need to describe Soil Structure Interaction problems, they have used reduced-scale models of piles and walls, although using different materials. Knappett et al. [13]
developed a micro-concrete (concrete with small-scale aggregates and gypsum instead of cement) for use in geotechnical centrifuge. They present experimental results on tests of 1:40 scaled RC beams and slabs made of micro-concrete and steel wires as reinforcement. The modes of failure between model and prototype scales coincide, and the quantitative comparison of strength and ductility is relatively good, even if seen from the potentially stricter point of view of a structural engineer. Strength is better captured than the moment-curvature relationship and stiffness, but we have reasons to believe that the actual situation is better than described by Knappett et al. [13]: They compared the experimental M-κ
relations they obtained, to analytical solutions using cracked cross section analysis. However, based on Panagiotakos and Fardis [14] and Priestley et al. [15] suggestions, such an analysis would be too stiff.
Thus, the apparent extra flexibility is not a product of the scaled model, but of the equations that Knappet et al. [13] used to predict the prototype behavior. If one uses the stiffnesses provided by Priestley et al. [15] the curves match much better.
The micro-concrete that was developed was subsequently used to study a rocking isolated RC bridge pier at a 1:40 scale [16]. However there were three limitations: (a) The accuracy in positioning of the handmade micro-reinforcement, as well as the diameter of the stirrups (they were larger than what proper scaling would suggest). (b) The construction time: It took 8 hours of quasi-watchmaker’s work and many failed specimens for a single column. (c) It was practically impossible to build frames, as there were difficulties in positioning the rebars in the joints at a 1:40 scale by hand.
This paper suggests that the problem of manufacturing and placing the reinforcement can be solved by using a metal 3D printer. Then, the construction of multiple specimens for a statistical validation of numerical models is time-wise feasible. Moreover, the method allows for the experimental study of a plethora of structural engineering problems that was impossible till now, namely SSI, pounding between adjacent buildings, or between a bridge and the abutment.
In order to avoid scale phenomena, it is necessary to perform the material and component level cyclic tests, at the model scale, namely 1:40. This paper presents some first experimental results of compression and tension strength of micro-concrete, tension tests of 3D printed steel reinforcement of 0.50 mm nominal diameter (without considering the ribs), and 4 point bending tests of micro RC beams.
5. Testing of micro-concrete in tension and compression
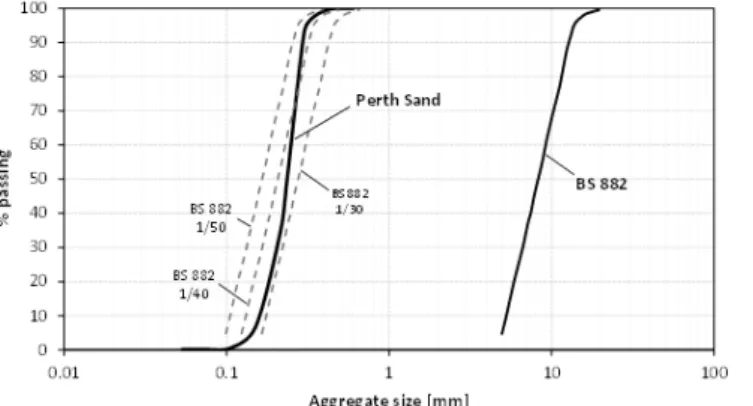
Micro concrete comprises a mixture of plaster, sand and water. In this work, Saint-Gobain Hartform 1 gypsum based plaster was used. Perth silica sand with d50 = 0.23 mm was used as a model aggregate.
Figure 4 compares a typical aggregate size distribution scaled down 40 times to the distribution of the used sand. The ratio of the water/plaster/sand ratio of the mixture was 0.4/1/1.
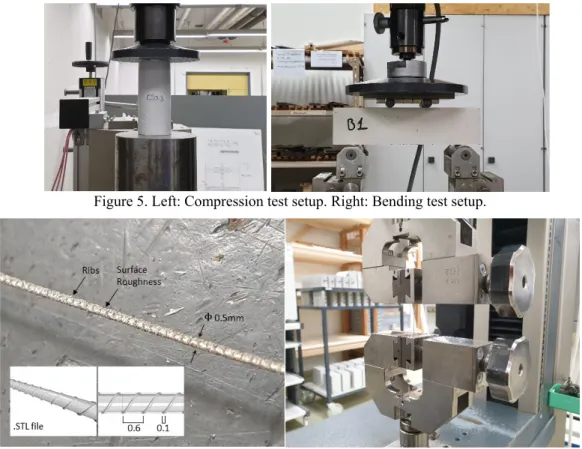
Cylindrical specimens of 50 mm diameter and 112 mm height were constructed and tested in compression (Figure 5, left) after 20 days. The deformation was applied at a rate of 0.5 mm/min. The average maximum compressive strength fc is equal to 15.61MPa with a coefficient of variation (CoV) of 3.2%. In the future, smaller models, as close to 1:40, will be constructed to study any scale effect and to consider it in the numerical model validation procedure.
Unreinforced 12.5x12.5x80 mm and 40x40x160 mm size rectangular beams were also constructed and tested in 4 point bending after 20 days (Figure 5, right). The average value of modulus of rupture (ffl) for the small samples is equal to 8.48MPa with a CoV of 8.4% whereas for the big samples ffl is 6.22MPa with a CoV of 5.9%. The maximum flexural strength is larger for the small specimens and this is in agreement with the expected size effect.
Figure 4. Scaling of typical aggregate size.
Figure 5. Left: Compression test setup. Right: Bending test setup.
Figure 6. Left: .STL file and printed rebar. Right: Uniaxial tension test setup.
6. Testing of 3D printed micro reinforcement in tension
The 3D reinforcements were produced by Laser Powder Bed Fusion (LPBF) technology using a Sisma Mysint100 equipped with a fiber laser of wavelength 1061 nm and a laser spot size 55 μm. The material used for manufacturing reinforcement was gas atomized 316l stain-less steel powder provided by Oerlikon Metco. The tested reinforcement had a diameter of 0.35 mm for the stirrups and 0.50 mm for the rebars (1:40 scaled models of Φ14 and Φ20). Printing the rebars in a way that their bonding with concrete is similar to one of the prototype models is not trivial and will be a subject of future research.
Due to some limitations in the size of the working chamber and appearance of high residual stress during the LPBF process, manufacturing the ribs of the reinforcement in 1:40 scale is problematic.
The minimum feature size of LPBF parts is around 200 μm (i.e. of 10 mm in the prototype scale). The ribs would have a size on the order of 1 mm in the prototype scale. However, the LPBF process results in a rough surface anyways with Ra values of 15-20 μm. For many technical applications, post processing steps reducing surface roughness (e.g. grinding, polishing) are required. In our case, we did not apply this process, as roughness is a target property. Moreover, an attempt to print ribs was made.
Figure 6, left shows the STL file that was used for printing the parts as well as a photo of the rebar surface in the as-manufactured state.
5 rebars were tested in tension in order to assess the yielding and maximum strength of the printed rebars. The tests were performed with a Zwick Universal Testing Machine equipped with a 1 kN load cell. The initial gap between the clamping jaws was 30 mm, which increased at a rate of 0.1 mm/min.
Figure 7 shows the results of the tension tests for all 5 tested specimens. The yield strength of the rebars was defined imposing a conventional 0.01 offset of the initial linear part of the curves. The average yield and maximum strength of the specimens were fy = 400.7 MPa and ft,max = 454.5 MPa. Casati et al.
[17] on (10 mm × 10 mm × 75 mm) specimens had shown a yield strength of the 3D printed 316L stainless steel of 500-600 MPa meaning that the 0.5 mm diameter rebars were weaker: Any defects as well as the surface roughness will have a more pronounced effect in small-scale specimens. Hence, there is a scale effect that needs further investigation. The Young modulus was 75
Figure 7. Tension tests of printed rebars.
GPa, which is substantially lower than the 180 GPa value reported by Casati et al. [17], showing that more research is needed on the field to understand why.
7 FOUR POINT BENDING TESTS OF MICROREINFORCED CONCRETE BEAMS
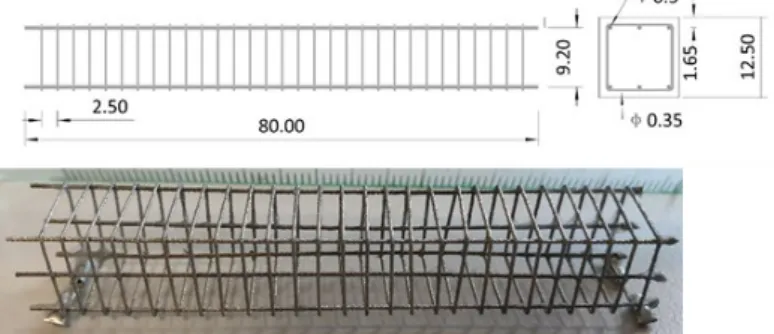
Three model beams were manufactured and tested to determine their bending properties. The beams were designed to represent a 1/40 scale beam with 0.50 m by 0.50 m cross section and 3.2 m length, featuring 6 Φ20 longitudinal rebars and Φ14 shear reinforcement with 10cm spacing, all in the prototype scale. This translated in the model scale into 80 mm long beams with a cross section of 12.5 mm by 12.5 mm, Φ0.50 longitudinal rebars, and Φ0.35 stirrups spaced at 2.5 mm. The entire reinforcement cage, i.e. rebars and stirrups, was printed with the desired layout. Figure 8 shows the reinforcement cage detail, as well as the cross section layout.
Figure 8. Reinforcement details and 3D printed cage.
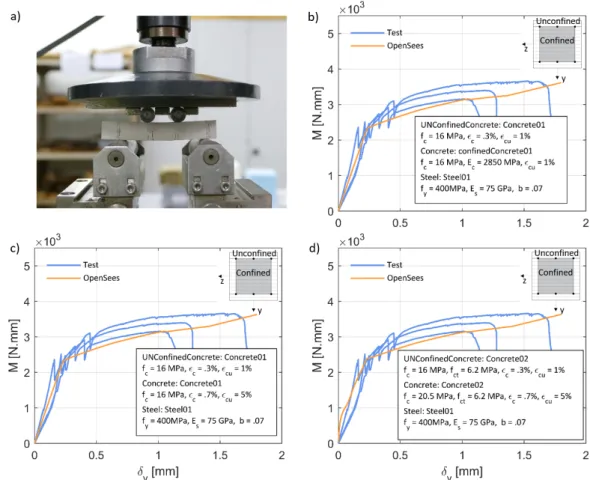
The reinforcement was carefully placed into the molds, making sure that the 1.65 mm cover was respected. Subsequently the micro concrete was casted. The specimens were left for 2 days in the molds, which were then removed. The unmolded specimens cured for 18 more days for a total of 20 curing days before testing. The test setup consisted of a four point bending test with a support span of 60 mm and a loading span, i.e. the spacing of the loading pins, of 20 mm (Figure 9a). The applied loading rate was 0.1 mm/min to ensure static testing conditions. Figure 9 (b-d) shows the moment-vertical displacement plot, at the middle of the beams. The average moment capacity was 3220 Nmm. Moreover, we noticed that after a first quasi-linear branch the curves become jagged at about 2’000 Nmm, this region corresponds to the crack onset within the loading span. A visual inspection during the tests has indeed shown that the first cracks appeared when the first peak of the curves were observed. A visual inspection of the specimens after the tests has shown that the printed rebars fractured. Hence, the bonding strength created by the surface roughness and the printed details was enough to prevent debonding.
Figure 9. Comparison between experimental results and OpenSees simulation using fiber model.
Numerical models of the four point bending test were developed in OpenSees and the results compared against the experimental curves. The beam was modelled using a displacement-based element with non- linear fiber section. The section was divided into three types of fibers, i.e. confined concrete (in the area enclosed by the rebars), unconfined concrete (concrete cover), and steel (longitudinal rebars). Steel was modelled with Steel01 material with fy=400 MPa, Es=75 GPa, and 7% hardening. Different concrete modelling options were tried (Figure 9 (b-d). Concrete01 has zero tension strength, while Concrete02 presents linear-softening behavior in tension. ConfinedConcrete01 computes the confined concrete properties automatically based on the transverse reinforcement. In all cases, we used the results of the compression and bending tests to characterise the unconfined concrete. When confined properties were needed as an input, the Mander et al. [18] model was used. Figure 9 (b–d) shows the comparison between experimental results and the OpenSees analyses. The numerical results seem to be in good agreement with the experimental ones, which indicates that the fundamental assumption valid for reinforced concrete elements (i.e. perfect bonding between steel and concrete) applies for the micro- reinforced concrete beams.
8 CONCLUSIONS
Additive manufacturing is a promising technology for the automated construction of the reinforcement cages of small-scale RC specimens. The tested members show a behavior, which is close to full scale RC structural members – with the exception of concrete tension strength, that needs to be reduced.
Therefore, it seems feasible to use the proposed methodology to construct small-scale models of full structures with the aim of testing them on a shake table inside a geotechnical centrifuge. The shake table tests datasets can be used by the Earthquake Engineering community to statistically validate the assumptions that are usually made to scale up from component-level cyclic to system-level dynamic behavior, namely boundary conditions, interaction of components, conceptual formulation of damping, and participation of slabs. Further investigations on materials and component at small scale are required.
References
[1] Fajfar P. (2018): Analysis in seismic provisions for buildings: past, present and future, European Conference on Earthquake Engineering, Thessaloniki, Greece, pp. 1–49.
[2] Schoettler M., Restrepo J., Guerrini G., and Duck D. E. (2012): A full-scale, single-column bridge bent tested by shake-table excitation.
[3] Terzic V., Schoettler M. J., Restrepo J. I., and Mahin S. A. (2015): Concrete column blind prediction contest 2010: outcomes and observations, Technical Report PEER 2015/01, Pacific Earthquake Engineering Research, Berkeley, USA
[4] Trüb M. (2011): Numerical modeling of high performance fiber reinforced cementitious composites, IBK Bericht, 333.
[5] Collapse Prevention Center (2011). [Online]. Available: http://www.collapse-prevention.net/download/
Competition /RC_Frame/ RC_Frame_ Competition.htm. (Accessed: 29-Sep-2019).
[6] Lin X. and Lu X., Numerical Models to Predict the Collapse Behavior of RC Columns and Frames (2017):
The Open Civil Engineering Journal, 11(1).
[7] Bradley B.A. (2013): A critical examination of seismic response uncertainty analysis in earthquake engineering. Earthquake engineering & structural dynamics, 42(11),1717–1729.
[8] Bachmann J. A., Strand M., Vassiliou M. F., Broccardo M., and Stojadinović B. (2018): Is rocking motion predictable? Earthquake Engineering & Structural Dynamics, 47(2), 535–552, doi: 10.1002/eqe.2978.
[9] Bachmann J. A., Strand M., Vassiliou M. F., Broccardo M., and Stojadinović B. (2019): Modelling of rocking structures: Are our models good enough?,2nd International Conference on Natural Hazards &
Infrastructure, Crete, Greece.
[10] Chopra, A. K. (2012): Dynamic of structures. Pearson Education, 4th edition, United States.
[11] Roy C. J. and Oberkampf W. L. (2011): A comprehensive framework for verification, validation, and uncertainty quantification in scientific computing. Computer methods in applied mechanics and engineering, 200(25–28), 2131–2144.
[12] Del Giudice, L. and Vassiliou, M. F. (2020). Mechanical properties of 3D printed material with binder jet technology and potential applications of additive manufacturing in seismic testing of structures. Additive Manufacturing, 36, 101714, https://doi.org/10.1016/j.addma.2020.101714
[13] Knappett J. A., Reid C., Kinmond S., and O’Reilly K. (2011): Small-scale modeling of reinforced concrete structural elements for use in a geotechnical centrifuge, Journal of Structural Engineering, 137(11), 1263–
1271.
[14] Panagiotakos T. B. and Fardis M. N. (2001): Deformations of reinforced concrete members at yielding and ultimate, Structural Journal, 98(2), 135–148.
[15] Priestley M. J. N., Calvi G. M., and Kowalsky M. J. (2007): Displacement-based seismic design of structures.
IUSS press.
[16] Loli M., Knappett J. A., Brown M. J., Anastasopoulos I., and Gazetas G. (2014): Centrifuge modeling of rocking-isolated inelastic RC bridge piers. Earthquake engineering & structural dynamics, 43(15), 2341–
2359.
[17] Casati R., Lemke J., and Vedani M. (2016): Microstructure and fracture behavior of 316L austenitic stainless steel produced by selective laser melting, Journal of Materials Science & Technology, 32(8), 738–744.
[18] Mander J. B., Priestley M. J. N., and Park R. (1988): Theoretical stress-strain model for confined concrete, Journal of structural engineering, 114(8), 1804–1826.
![Figure 1. Left: Bridge column tested in UCSD [2]. Middle: Maximum top displacements predicted by the blind prediction contest contestants [3]](https://thumb-eu.123doks.com/thumbv2/1library_info/4425717.1584452/3.892.121.756.97.340/figure-bridge-middle-maximum-displacements-predicted-prediction-contestants.webp)