Photoreduction of Aryl Halides by TTA-UC Under Aerobic Conditions in Gel Medium Supporting Information
S1
Supporting Information
Photoreduction of Aryl Halides by TTA-UC Under Aerobic Conditions in Gel
Medium
Photoreduction of Aryl Halides by TTA-UC Under Aerobic Conditions in Gel Medium Supporting Information
S2
Table of Contents
page 1.Devices for irradiation and Tgel determination ………... S3 2.GC-FID analyses………...………... S4 3.UV/Vis spectroscopy………... S7 4. Cyclic voltammetry………... S8 5.References……….……….. S10
Photoreduction of Aryl Halides by TTA-UC Under Aerobic Conditions in Gel Medium Supporting Information
S3 1. Devices for irradiation and Tgel determination
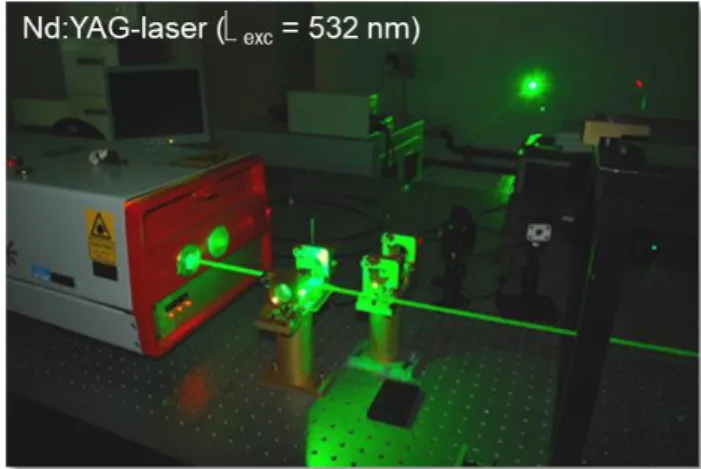
Laser flash photolysis system: The pump source is an optical parametric oscillator (OPO) pumped by the third Harmonic of a Nd:YAG-laser (Surelite II and Surelite OPO PLUS, Continuum) (Figure S1).
The wavelength can be set from 400 nm to ca. 700 nm, with a pulse width of ca. 5 nm. The typical pulse duration is 8 ns.
Figure S1. Set-up of the laser flash photolysis system, using an Nd:YAG-laser set to a wavelength of 532 nm.
LED photolysis system: The vial containing the corresponding doped gel was placed vertically above the aperture of the LED during the experiments using a custom made cooling apparatus as shown in Figure S2.
Figure S2. Custom-made irradiation device. A) Array of six LEDs connected to a power supply. B) Set-up with a stainless steel jacket to maintain refrigeration of the vials (5 mL). The distance between the LEDs and the reaction vials is adjusted to 0.9 ± 0.1 cm. The apparatus also allows magnetic stirring of the reaction mixtures.
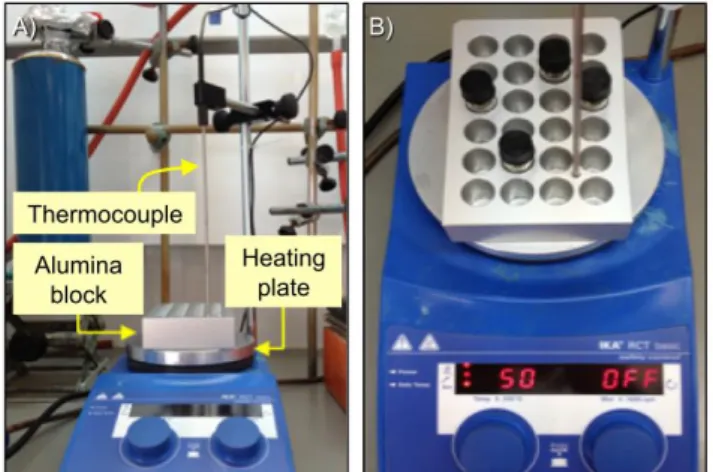
Tgel determination: Gel-to-sol transition temperatures were determined using a custom-made set-up where a sealed vial was placed into a mold of an alumina block and heated up at 1 °C/5 min using an electric heating plate equipped with a temperature control couple (Figure S3). The values obtained by this method have been previously verified with different supramolecular gels by means of DSC measurements as well as the inverse flow method (IFM).1 It should be noted that the values determined by IFM strongly depend on factors such as cooling rate, aging time, thermal history, and degree of hysteresis among others. Moreover, verification of the independence of the position inside the custom made apparatus has also been carried out.2 Herein, the temperature at which the gel started to break was defined as Tgel with an estimated error of ± 2 ºC after several heating-cooling cycles.
Photoreduction of Aryl Halides by TTA-UC Under Aerobic Conditions in Gel Medium Supporting Information
S4
Figure S3. Custom made apparatus for Tgel determinations. A) Front view of the set-up. B) Top view of the set-up during a typical experiment. The vials must fit smoothly inside the molds to ensure the optimal transmission of the heat flow.
Air-Sensitive Photoredox Catalysis Performed Supporting Information Under Aerobic Conditions in Gel Networks
S5 2. GC-FID
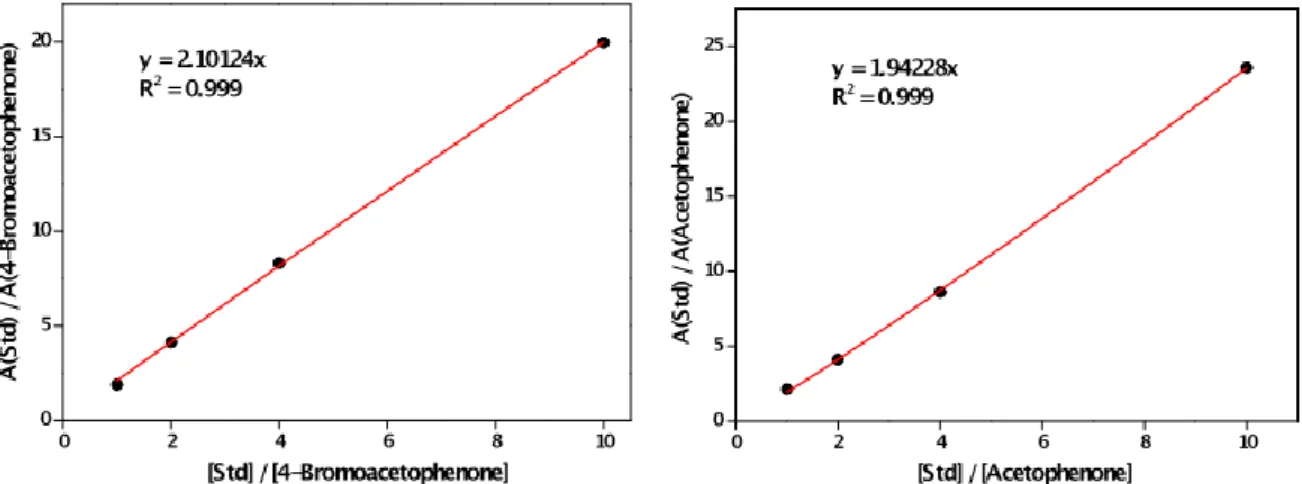
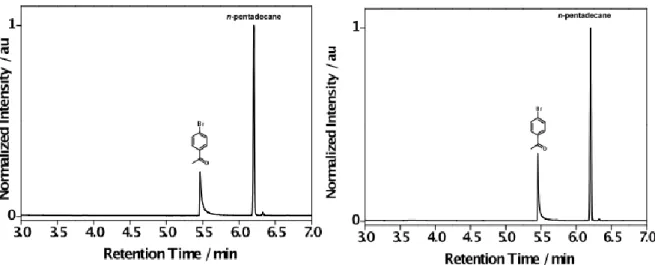
GC was calibrated using a four-point calibration vs. 10 mM of the intenal standard n-pentadecane (Std.). Representative calibration curves and GC chromatograms are shown in Figure S4 and Figures S5-S8, respectively. The GC oven temperature program was adjusted as follows: The initial temperature (50 °C) was kept for 0.5 min, and subsequently increased at a rate of 25 °C min-1 over a period of 8 min until the final temperature (280 °C) was reached and maintained for 10 min.
Figure S4. Quantitative GC calibration for substrate ArBr conversion and product ArH formation vs. 10 mM of internal standard (Std) n-pentadecane.
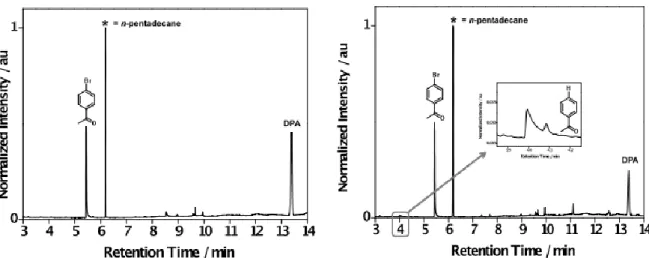
Figure S5. Representative normalized GC-FID chromatograms for the intragel photocatalyzed reduction of 1 in the presence of the TTA system (PtOEP + DPA) in the gel made from G-1 (DMF) obtained before (left) and after 2 h of pulsed laser irradiation at 532 nm (right).
Air-Sensitive Photoredox Catalysis Performed Supporting Information Under Aerobic Conditions in Gel Networks
S6
Figure S6. Representative normalized GC-FID chromatograms for the photocatalyzed reduction of 1 in the presence of the TTA system (PtOEP + DPA) in aerated DMF solution obtained before (left) and after 2 h of pulsed laser irradiation at 532 nm (right).
Figure S7. Representative normalized GC-FID chromatograms for the intragel photocatalyzed reduction of 1 in the presence of the TTA system (PtOEP + DPA) in the gel made from G-1 (DMF-d7) obtained before (left) and after 2 h of pulsed laser irradiation at 532 nm (right). Inset: ESI-MS spectrum of formed deuterated acetophenone: Exact mass (EI+) required for C8H7OD 121.06479 (M•+); found 121.06422.
Air-Sensitive Photoredox Catalysis Performed Supporting Information Under Aerobic Conditions in Gel Networks
S7
Figure S8. Representative normalized GC-FID chromatograms for the intragel photocatalyzed reduction of 1 in the presence of TTA system (PtOEP + DPA) in the gel made from G-1 (toluene) obtained before (left) and after 2 h of pulsed laser irradiation at 532 nm (right).
Air-Sensitive Photoredox Catalysis Performed Supporting Information Under Aerobic Conditions in Gel Networks
S8 3. UV-Vis and fluorescence spectroscopy
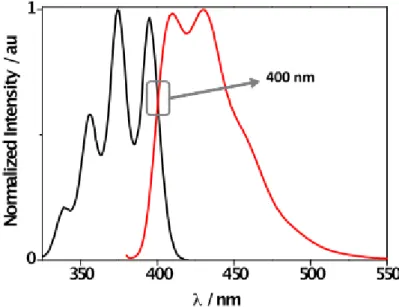
Figure S9 shows the interception point between absorption and emission bands of DPA for the determination of excited singlet state energy.
Figure S9. Normalized absorption (black) and emission (red, λEx = 375 nm) of an aerated DMF solution of DPA (0.01 mM). Singlet energy of DPA in DMF, Es = 71.5 kcal mol-1.
Air-Sensitive Photoredox Catalysis Performed Supporting Information Under Aerobic Conditions in Gel Networks
S9 4. Cyclic voltammetry
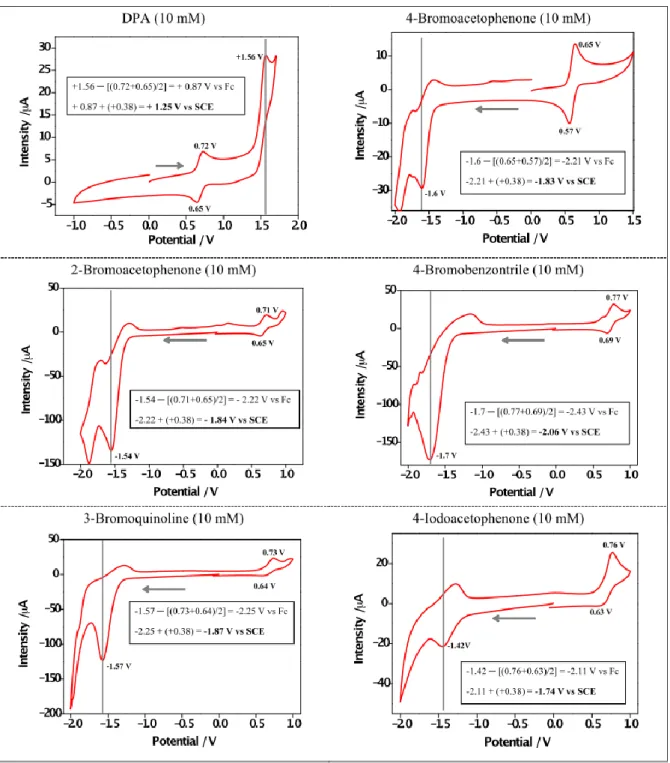
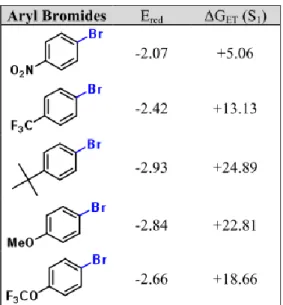
The redox potentials were measured by cyclic voltammetry with an Autolab PGSTAT302N Metrohm apparatus. All measurements were made in deaerated DMF containing tetrabutylammonium tetrafluoroborate (0.1 M) as supporting electrolyte, a glassy carbon as working electrode, a platinum wire as counter electrode, a silver wire as pseudo reference and ferrocene as internal standard. The scan rate was 0.05 V s-1. Potentials are reported with respect to the saturated calomel electrode (SCE) as reference (Figure S10).3 Figure S11 shows the reduction potentials of selected aryl bromides and free energy changes (∆GET) of the electron transfer process.
Figure S10. Cyclic voltammetry of DPA and substrates in dearated DMF.
Air-Sensitive Photoredox Catalysis Performed Supporting Information Under Aerobic Conditions in Gel Networks
S10
Figure S11. Reduction potential of selected aryl bromides and free energy changes (∆GET) of the electron transfer process.
Air-Sensitive Photoredox Catalysis Performed Supporting Information Under Aerobic Conditions in Gel Networks
S11 5. References
[1] J. E. Eldrige, J. D. Ferry, J. Phys. Chem., 1954, 58, 992-995.
[2] J. Bachl, A. Hohenleutner, B. B. Dhar, C. Cativiela, U. Maitra, B. König, D. D. Díaz, J.
Mater. Chem. A, 2013, 1, 4577-4588.
[3] V. V. Pavlishchuk, A. W. Addison, Inorg. Chim. Acta, 2000, 298, 97-102.