cells
Article
Four-And-A-Half LIM-Domain Protein 2 (FHL2) Deficiency Aggravates Cholestatic Liver Injury
Judith Sommer
1, Christoph Dorn
2, Erwin Gäbele
3, Frauke Bataille
4, Kim Freese
1, Tatjana Seitz
1, Wolfgang E. Thasler
5, Reinhard Büttner
6, Ralf Weiskirchen
7, Anja Bosserhoff
1,8and Claus Hellerbrand
1,8,*
1
Institute of Biochemistry, Emil-Fischer-Zentrum, Friedrich-Alexander University Erlangen-Nürnberg, Fahrstr. 17, D-91054 Erlangen, Germany; judith.sommer@fau.de (J.S.); kim.freese@fau.de (K.F.);
tatjana.seitz@fau.de (T.S.); anja.bosserhoff@fau.de (A.B.)
2
Institute of Pharmacy, University Regensburg, D-93053 Regensburg, Germany;
christoph.dorn@chemie.uni-regensburg.de
3
Department of Internal Medicine I, University Hospital Regensburg, D-93053 Regensburg, Germany;
erwin.gaebele@ukr.de
4
Institute of Pathology, University Regensburg, D-93049 Regensburg, Germany; bataillef@t-online.de
5
Hepacult GmbH, D-82152 Planegg/Martinsried, Germany; Wolfgang.Thasler@hepacult.de
6
Institute of Pathology, University Hospital Cologne, D-50937 Cologne, Germany;
reinhard.buettner@uk-koeln.de
7
Institute of Molecular Pathobiochemistry, Experimental Gene Therapy and Clinical Chemistry, RWTH University Hospital Aachen, D-52074 Aachen, Germany; rweiskirchen@ukaachen.de
8
Comprehensive Cancer Center (CCC) Erlangen-EMN, D-91054 Erlangen, Germany
* Correspondence: claus.hellerbrand@fau.de; Tel.: +49-9131-85-24644; Fax: +49-9131-85-22485
Received: 21 December 2019; Accepted: 16 January 2020; Published: 19 January 2020
Abstract: Cholestasis occurs in different clinical circumstances and leads to severe hepatic disorders.
The four-and-a-half LIM-domain protein 2 (FHL2) is a scaffolding protein that modulates multiple signal transduction pathways in a tissue- and cell context-specific manner. In this study, we aimed to gain insight into the function of FHL2 in cholestatic liver injury. FHL2 expression was significantly increased in the bile duct ligation (BDL) model in mice. In Fhl2-deficient (Fhl2-ko) mice, BDL caused a more severe portal and parenchymal inflammation, extended portal fibrosis, higher serum transaminase levels, and higher pro-inflammatory and pro-fibrogenic gene expression compared to wild type (wt) mice. FHL2 depletion in HepG2 cells with siRNA resulted in a higher expression of the bile acid transporter Na
+-taurocholate cotransporting polypeptide (NTCP) gene. Furthermore, FHL2-depleted HepG2 cells showed higher expression of markers for oxidative stress, lower B-cell lymphoma 2 (Bcl2) expression, and higher Bcl2-associated X protein (BAX) expression after stimulation with deoxycholic acid (DCA). In hepatic stellate cells (HSCs), FHL2 depletion caused an increased expression of TGF- β and several pro-fibrogenic matrix metalloproteinases. In summary, our study shows that deficiency in FHL2 aggravates cholestatic liver injury and suggests FHL2-mediated effects on bile acid metabolisms and HSCs as potential mechanisms for pronounced hepatocellular injury and fibrosis.
Keywords: four-and-a-half LIM-domain protein 2; FHL2; cholestatic liver injury; bile acids
1. Introduction
Fibrosis is a highly conserved protective response to tissue injury. It is an essential biological mechanism for the maintenance of structural and functional tissue integrity. Additionally, hepatic fibrosis can be considered as a wound-healing response to liver injury. It reflects a balance between
Cells2020,9, 248; doi:10.3390/cells9010248 www.mdpi.com/journal/cells
Cells2020,9, 248 2 of 12
liver repair and scar formation. Pathological fibrosis corresponds to impaired wound healing [1]. The liver usually regenerates after an acute liver injury, but, if the injury persists, the liver reacts with progressive inflammatory response and fibrogenesis. The progressive and uncontrolled accumulation of extracellular matrix (ECM) proteins eventually leads to liver cirrhosis and hepatic failure. Furthermore, liver cirrhosis is a major risk factor for the development of hepatocellular cancer (HCC) [2,3]. Therefore, hepatic fibrosis is the most important pathophysiological factor that determines the morbidity and mortality of patients with chronic liver disease [4,5]. Unfortunately, no effective anti-fibrogenic therapy has been established thus far. Accordingly, there is a high medical need to improve our understanding of pathogenic mechanisms underlying hepatic fibrogenesis in order to identify new targets and to develop therapeutic strategies to inhibit hepatic fibrosis in patients with chronic liver disease.
The four-and-a-half LIM-domain protein 2 (FHL2), also known as SLIM3 or DRAL, is the second member of the four-and-a-half LIM-domain protein family [6]. LIM proteins mediate protein–protein interactions, and FHL2 has also been described to interact with more than 50 different proteins that are involved in different signaling pathways [7]. Consequently, FHL2 has been shown to play important roles in various biological mechanisms, including cell proliferation, apoptosis, and transformation [7,8].
FHL2 is ubiquitously expressed, but it exerts tissue- and cell context-specific functions that are often opposing. For example, FHL2 inhibits the migration of dendritic cells, but it induces the migration of fibroblasts [9]. FHL2 has also been shown to affect different steps of wound healing [9]. The deletion of the Fhl2 gene in mice has been found to result in impaired wound healing in the skin, the intestine or ischemic muscle tissues [10–13]. So far, little information exists regarding the role of FHL2 in the liver and chronic liver diseases.
Cholestatic liver injury is a pathophysiological situation that is relevant for a variety of diseases such primary biliary cholangitis, primary biliary sclerosis, and drug-induced hepatotoxicity. Cholestasis leads to hepatocellular injury and subsequent inflammation and fibrosis. Still, the molecular mechanisms and interplay between different pathological effects and cell types that lead to disease progression are only incompletely understood.
The aim of this study was to analyze the role of FHL2 in cholestatic liver injury with a focus on hepatocellular damage and fibrosis.
2. Materials and Methods
2.1. Cells and Cell Culture
The hepatoma cell line HepG2 (ATCC HB-8065) and the human hepatic stellate cell line LX-2 were cultured as described in [14]. The isolation and culture of primary human hepatic stellate cells (HSCs) was performed as described in [15]. Human liver tissue for cell isolation was obtained from the charitable, state-controlled Human Tissue and Cell Research (HTCR) foundation [16] with informed patient’s consent.
2.2. FHL2 Depletion with siRNA-Pools
Transfection with FHL2 siRNA-pools was performed as described in [17] by using the Lipofectamine RNAimax transfection reagent (Life Technologies, Darmstadt, Germany) and siRNA-pools against human FHL2 mRNA (functionally verified by siTOOLs Biotech GmbH, Planegg, Germany). Si-pools are complex pools of defined siRNAs that are directed against the target gene, leading to a robust knockdown, while off-target effects are believed to be significantly reduced [18].
At 72 h after transfection, cells were further analyzed. For stimulation experiments, HepG2 cells
were treated with deoxycholic acid (DCA) (Sigma-Aldrich, Steinheim, Germany) for 24 h at indicated
concentrations. Cytotoxic effects were monitored by the analysis of lactate dehydrogenase (LDH)
release into the supernatant by using the Pierce LDH cytotoxicity assay kit (Thermo Fisher Scientific,
Waltham, MA, USA).
Cells2020,9, 248 3 of 12
2.3. Animals and Bile Duct Ligation
Male Fhl2-ko mice [13,19] and wild type (wt) littermates aged 10–12 weeks were kept under controlled standard conditions. The mice were fed with a standard laboratory diet and had access to water ad libitum. Bile duct ligation (BDL) and sham operations (control animals) were performed as described (n = 5 animals/group) [20]. The animal studies were approved by the Committee for Animal Health and Care of the local government (54-2531.1-28/05) and conformed to international guidelines on the ethical use of animals. After 2 weeks, animals were sacrificed, and blood samples were collected.
Liver tissue samples were either fixed in 5% formalin or snap-frozen in liquid nitrogen and stored at
− 80
◦C until subsequent analyses.
2.4. Quantitative Real-Time-PCR Analysis
RNA isolation from liver tissues and reverse transcription were performed as described in [21].
Quantitative real-time PCR was performed by applying LightCycler technology (Roche Diagnostics, Mannheim, Germany) while using specific sets of primers, as listed in Table 1. For the detection of the human NTCP, p47phox and TGF-β genes, QuantiTect Primer Assays (Qiagen, Hilden, Germany) were used. For normalization, the amplification of cDNA derived from 18S rRNA was used.
Table 1. Primer sequences for quantitative real-time PCR.
Gene Forward (50-30) Reverse (50-30)
18S TCTGTGATGCCCTTAGATGTCC CCATCCAATCGGTAGTAGCG Human
α-SMA CGTGGCTATTCCTTCGTTAC TGCCAGCAGACTCCATCC
BAX GGCCCACCAGCTCTGAGCAGA GCCACGTGGGCGTCCCAAAGT BCL2 GCGGATTTGAATCTCTTTCTC CACTAAACTGACTCCAGCTG
BSEP TGCCCAGAATGGCCCTACA CCAGCATTGCCCTGAAACCA
COL1A1 CGGCTCCTGCTCCTCTT GGGGCAGTTCTTGGTCTC
CYP7A1 CCATAAGGTGTTGTGCCACGG TCCGTGAGGGAATTCAAGGCA
FHL2 GAAACTCACTGGTGGACAAGC GTGGCAGATGAAGCAGGTCT MMP1 TCACCAAGGTCTCTGAGGGTCAAGC GGATGCCATCAATGTCATCCTGAGC MMP2 GCTGGGAGCATGGCGATGGATACC GGACAGAAGCCGTACTTGCCATCC MMP3 TGCTGTTTTTGAAGAATTTGGGTT CAATTCACAGAGACTTAGGTGAAGA
MMP9 TGCCTTTGGACACGCACG CCTGGTTCAACTCACTCCGGG
MMP10 GGGGGAAGACAGATATGGGT CTGTTCAGTGCAATTCAAAAGC
MMP13 TACCAGACTTCACGATGGCATTGCTG AAAGTGGCTTTTGCCGGTGTAGGTG
MMP14 GGAACCCTGTAGCTTTGTGTCTGTC TCTCTACCCTCAACAAGATTAGATTCC
MRP2 TCACATGTCCATCCACTGTTTCA TGCTCAAAACAAGTGGCAGG Mouse
α-sma CCAGCCATCTTTCATTGGGAT CCCCTGACAGGACGTTGTTA
Col1a1 CTGTTCCAGGCAATCCACGA ATCAGCTGGAGTTTCCGTGC
Fhl2 ACTGCCTGACCTGCTTCTGT TTGCCTGGTTATGAAAGAAAA
Hmox-1 CACGCATATACCCGCTACCT CCAGAGTGTTCATTCGAGCA
Il-1 TGCCACCTTTTGACAGTGATG AAGGTCCACGGGAAAGACAC
Mcp-1 TGCAGGTCCCTGTCATGCTTC TGGACCCATTCCTTCTTGGGG
Mmp1 CTTGGCCACTCCCTAGGTCT AGGGCTGGGTCACACTTCTC
Mmp2 ATGGACAGCCCTGCAAGTTC CAGTGGACATAGCGGTCTCG
Mmp9 GTCCAGACCAAGGGTACAGC CTGTCGGCTGTGGTTCAGTT
Pai-1 ATGGGGCCGTGGAACAAGAA AGGCGTGTCAGCTCGTCTAC
Tgf-β CATTGCTGTCCCGTGCAGAG CAGGCGTATCAGTGGGGGTC
Tnf CCCTCACACTCAGATCATCTTCT GCTACGACGTGGGCTACAG
2.5. Protein Analysis
Protein extraction from liver tissues, protein extraction from cells, and analysis by Western
blotting were performed as described in [17] by applying mouse monoclonal anti-FHL2 (HycultBiotech,
Uden, The Netherlands; HM2136, 1:300), rabbit monoclonal anti-alpha-smooth muscle actin ( α -SMA)
(Abcam, Cambridge, United Kingdom; ab32575, 1:1000), rabbit monoclonal anti-B-cell lymphoma 2
(BCL2) (Epitomics, Burlingame, CA, USA; #1017, 1:1000), rabbit polyclonal anti-metalloproteinase 13
Cells2020,9, 248 4 of 12
(anti-MMP13) (Abcam, Cambridge, United Kingdom; ab39012, 1:1000), rabbit polyclonal anti-MMP14 (Chemicon, Burlington, MA, USA; AB815, 1:1000) and mouse monoclonal anti-actin (ACTB; Merck Millipore, Billerica, MA, USA; MAB1501, 1:10,000) antibodies.
2.6. (Immono)Histological Analysis
For hematoxylin and eosin (HE) staining, Sirius Red/Fast Green staining and immunohistological analysis, formalin-fixed and paraffin-embedded tissue blocks were sectioned at a standard thickness of 5 µm, deparaffinized with xylene, and stained as described previously [22] by applying the following antibodies: rabbit monoclonal anti-α-SMA (Abcam, Cambridge, United Kingdom; ab32575, 1:300) and rabbit polyclonal anti-CD3 (Sigma-Aldrich, St. Louis, MO, USA; C7930, 1:1000). Sirius Red/Fast Green staining was performed as described previously [23]. Microscopical images were taken with an Olympus
TMCKX41 microscope with the ALTRA 20 Soft Imaging System
TMand Cell
Asoftware version 2.6 (Olympus Soft Imaging Solutions GmbH, Münster, Germany). IrfanView
TMsoftware version 4.36 (Irfan Skiljan, Jajce, Bosnia) was used in order to process images.
2.7. Statistical Analysis
Values are presented as mean ± SEM. Student’s unpaired t-test or, when appropriate, a two-way ANOVA test with the Sidak correction were used for comparison between groups, and a p-value
< 0.05 was considered statistically significant. All analyses were performed at least in triplicates.
Calculations were performed by applying the statistical computer package GraphPad Prism version 6.01 for Windows (GraphPad Software, San Diego, CA, USA).
3. Results
3.1. Fhl2 Deficiency Aggravates Hepatocellular Injury and Inflammation in Cholestatic Liver Injury
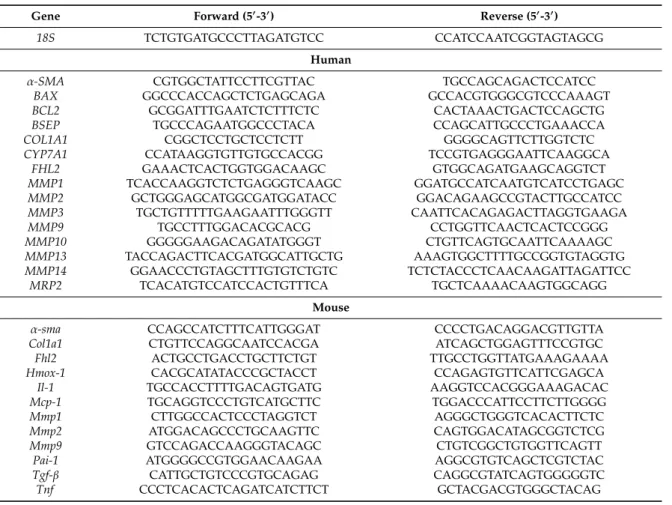
The experimental obstruction of the extrahepatic biliary system initiated a pathological cascade of events that led to cholestasis-induced hepatocellular injury and inflammation, which resulted in a strong fibrogenic reaction. Initially, we analyzed hepatic Fhl2 expression two weeks after the surgical ligation of the common bile duct in mice and observed a markedly increased upregulation as compared to sham-operated control mice (Figure 1A).
Subsequently, we applied this model of bile duct ligation (BDL) to male Fhl2-deficient (Fhl2-ko) and wt littermates. The sham-operated Fhl2-ko and wt mice served as controls. In response to BDL, the wt mice showed some inflammatory infiltration and few distinct necrotic areas (Figure 1B). In contrast, large necrotic areas and pronounced parenchymal inflammation appeared in Fhl2-ko mice with BDL in the histological analysis (Figure 1B). Fitting this, the BDL-induced increase of alanine aminotransferase (ALT) levels was significantly higher in the Fhl2-deficient mice compared to the wt mice (Figure 1C). In contrast, serum bilirubin levels were markedly increased in both the wt and Fhl2-deficient mice and to a similar extent (Figure 1D).
Furthermore, the hepatic expression of heme oxygenase 1 (Hmox-1), a marker of oxidative stress,
was markedly increased in response to BDL (Figure 1E). The BDL-induced Hmox-1 expression levels
tended to be higher in the Fhl2-deficient mice compared to the wt mice, further indicating that there
was more pronounced hepatocellular injury in the Fhl2-deficient mice. The chemokine monocyte
chemotactic protein 1 (Mcp-1) is produced at sites with oxidative stress and attracts inflammatory
cells [24]. Fitting this, the BDL-induced expression levels of Mcp-1 were significantly higher in the
Fhl2-deficient mice compared to the wt mice (Figure 1F), and CD3-immunohistochemical staining
revealed a strong lymphocytic infiltration in the Fhl2-deficient BDL mice but only a few CD3-positive
cells in the liver tissue of the wt-mice with BDL (Figure 1G). Moreover, the BDL-induced expression
levels of the pro-inflammatory cytokines Il-1 and Tnf were significantly higher in the Fhl2-deficient
mice compared to the wt mice (Figure 1H,I).
Cells2020,9, 248 5 of 12
In summary, Fhl2 deficiency in mice promoted hepatocellular injury and inflammation in the BDL model of cholestatic liver injury.
Cells 2020, 9, x FOR PEER REVIEW 5 of 12Figure 1. Fhl2 expression and effect of Fhl2 deficiency on hepatocellular injury and inflammation in the mouse model of bile duct ligation (BDL). Fhl2-deficient (Fhl2-ko) and wild type (wt) mice were either bile duct ligated (BDL) or sham-operated (CTR). (A) Fhl2 mRNA levels in wt BDL and CTR mice analyzed by qRT-PCR. (B) Representative hematoxylin and eosin stainings of liver tissue samples (20× magnification). (C) ALT (alanine aminotransferase) and (D) bilirubin serum levels. (E) Hmox-1 and (F) Mcp-1 mRNA expression levels in liver tissue analyzed by qRT-PCR. (G) Immunohistochemical CD3 staining of liver tissue samples (20× magnification). (H) Il-1 and (I) Tnf mRNA expression levels in liver tissue analyzed by qRT-PCR. (*: p < 0.05).
3.2. Fhl2 Deficiency Aggravates Hepatic Fibrosis in the Mouse Model of Bile Duct Ligation
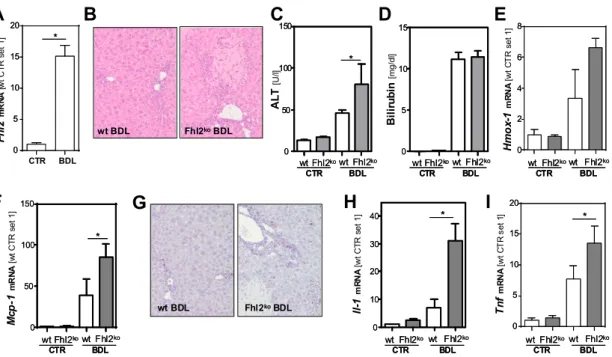
Activated hepatic stellate cells are a major cellular source of MCP-1 in injured livers [15]. In line with this, the expression of α-smooth muscle actin (α-sma), a marker for HSC activation, was upregulated in response to BDL, with significantly higher expression levels in the Fhl2-deficient mice than the wt mice (Figure 2A). An immunohistochemical analysis confirmed strong α-sma staining in the liver tissue of the Fhl2-ko mice with BDL, while the few α-sma positive cells in the wt-mice with BDL were mainly located around the periportal fields (Figure 2B). Furthermore, the expression of transforming growth factor-β (Tgf-β), the most prominent pro-fibrogenic cytokine in liver fibrosis, was significantly higher in the livers of Fhl2-deficient compared to the wt mice that were exposed to BDL (Figure 2C). Fitting this, the Fhl2-ko mice with BDL showed significantly higher expression levels of Collagen type 1 α I (Col1a1) as compared to the wt mice with BDL (Figure 2D). Sirius Red staining confirmed enhanced extracellular matrix deposition in the Fhl2-ko-BDL mice compared to the wt-BDL mice (Figure 2E). Additionally, the expression levels of the matrix metalloproteinases (Mmp) 1 and 2 was markedly increased in response to BDL, with a high variation in expression levels in the Fhl2-deficient and wt animals (Figure 2F,G). In contrast, the expression of Mmp9 was only slightly higher in the wt mice with BDL compared to the sham-operated littermates (Figure 2H).
However, in the Fhl2-ko mice, BDL caused a marked increase of hepatic Mmp9 expression. On the contrary, the expression of plasminogen activator inhibitor 1 (Pai-1) was manifestly increased in both the Fhl2-ko and wt mice with BDL (Figure 2I).
Still and, in summary, these data clearly indicate that mice with Fhl2 deficiency were more prone to hepatic fibrosis in the BDL model.
A B
ALT[U/l] Bilirubin[mg/dl]
0 2 4 6 8
0 2 4 6 8
Hmox-1mRNA[wt CTR set 1]
0 5 10 15 20
0 5 10 15 20
Il-1mRNA[wt CTR set 1] TnfmRNA[wt CTR set 1]
0 50 100 150
0 50 100 150
Mcp-1mRNA[wt CTR set 1]Fhl2mRNA[wt CTR set 1]
CTR BDL
D E
F H I
**
0 10 20 30 40
0 10 20 30 40
0 5 10 15
0 5 10 15
wt Fhl2kowt Fhl2ko
CTR BDL
wt Fhl2kowt Fhl2ko
CTR BDL
wt Fhl2kowt Fhl2ko
CTR BDL
wt Fhl2kowt Fhl2ko
CTR BDL wt Fhl2kowt Fhl2ko
CTR BDL
wt Fhl2kowt Fhl2ko
CTR BDL
0 5 10 15 20
0 5 10 15 20
**
C
0 50 100 150
0 50 100 150
wt Fhl2kowt Fhl2ko
CTR BDL
wt Fhl2kowt Fhl2ko
CTR BDL
**
G
wt BDL Fhl2koBDL
**
wt Fhl2kowt Fhl2ko CTR BDL wt Fhl2kowt Fhl2ko
CTR BDL
wt Fhl2kowt Fhl2ko CTR BDL wt Fhl2kowt Fhl2ko
CTR BDL
**
wt BDL Fhl2koBDL
Figure 1. Fhl2 expression and effect of Fhl2 deficiency on hepatocellular injury and inflammation in the mouse model of bile duct ligation (BDL). Fhl2-deficient (Fhl2-ko) and wild type (wt) mice were either bile duct ligated (BDL) or sham-operated (CTR). (A) Fhl2 mRNA levels in wt BDL and CTR mice analyzed by qRT-PCR. (B) Representative hematoxylin and eosin stainings of liver tissue samples (20 × magnification). (C) ALT (alanine aminotransferase) and (D) bilirubin serum levels. (E) Hmox-1 and (F) Mcp-1 mRNA expression levels in liver tissue analyzed by qRT-PCR. (G) Immunohistochemical CD3 staining of liver tissue samples (20 × magnification). (H) Il-1 and (I) Tnf mRNA expression levels in liver tissue analyzed by qRT-PCR. (*: p < 0.05).
3.2. Fhl2 Deficiency Aggravates Hepatic Fibrosis in the Mouse Model of Bile Duct Ligation
Activated hepatic stellate cells are a major cellular source of MCP-1 in injured livers [15]. In line with this, the expression of α -smooth muscle actin (α-sma), a marker for HSC activation, was upregulated in response to BDL, with significantly higher expression levels in the Fhl2-deficient mice than the wt mice (Figure 2A). An immunohistochemical analysis confirmed strong α-sma staining in the liver tissue of the Fhl2-ko mice with BDL, while the few α -sma positive cells in the wt-mice with BDL were mainly located around the periportal fields (Figure 2B). Furthermore, the expression of transforming growth factor- β (Tgf-β), the most prominent pro-fibrogenic cytokine in liver fibrosis, was significantly higher in the livers of Fhl2-deficient compared to the wt mice that were exposed to BDL (Figure 2C). Fitting this, the Fhl2-ko mice with BDL showed significantly higher expression levels of Collagen type 1 α I (Col1a1) as compared to the wt mice with BDL (Figure 2D). Sirius Red staining confirmed enhanced extracellular matrix deposition in the Fhl2-ko-BDL mice compared to the wt-BDL mice (Figure 2E). Additionally, the expression levels of the matrix metalloproteinases (Mmp) 1 and 2 was markedly increased in response to BDL, with a high variation in expression levels in the Fhl2-deficient and wt animals (Figure 2F,G). In contrast, the expression of Mmp9 was only slightly higher in the wt mice with BDL compared to the sham-operated littermates (Figure 2H). However, in the Fhl2-ko mice, BDL caused a marked increase of hepatic Mmp9 expression. On the contrary, the expression of plasminogen activator inhibitor 1 (Pai-1) was manifestly increased in both the Fhl2-ko and wt mice with BDL (Figure 2I).
Still and, in summary, these data clearly indicate that mice with Fhl2 deficiency were more prone
to hepatic fibrosis in the BDL model.
Cells2020,9, 248 6 of 12
Cells 2020, 9, x FOR PEER REVIEW 6 of 12
Figure 2. Effect of Fhl2 deficiency on hepatic fibrosis in the mouse model of bile duct ligation (BDL).
Fhl2-deficient (Fhl2-ko) and wild type (wt) mice were either subjected to BDL or were sham-operated (CTR). (A) Hepatic α-sma mRNA expression levels. (B) Immunohistochemical α-sma staining of liver tissue sections (20× magnification). Hepatic (C) Tgf-β and (D) Col1a1 mRNA expression levels. (E) Sirius Red/Fast Green staining of liver tissue sections (20× magnification). Hepatic (F) Mmp1, (G) Mmp2, (H) Mmp9, and (I) Pai-1 mRNA expression levels in liver tissue analyzed by qRT-PCR. (*: p < 0.05).
3.3. FHL2 Depletion Promotes Bile Acid-Induced Hepatocellular Injury In Vitro
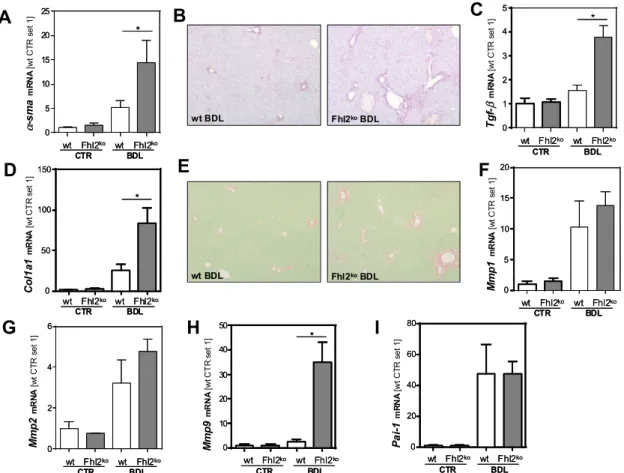
To gain further insight into the mechanism by which FHL2 affects hepatocellular injury in the BDL-induced model of chronic cholestasis, we wanted to analyze whether FHL2 affected the cellular response of hepatocytes to bile acids in vitro. To achieve this, we used the well-established human hepatoma cell line HepG2 and si-pool technology for specific FHL2 suppression (Figure 3A,B).
Subsequently, cells were treated with two different concentrations of deoxycholic acid (DCA) for 24 h. DCA exposition did not affect FHL2 expression levels (Figure 3E). Furthermore, we did not observe cytotoxic effects under these experimental conditions (Figure 3C,D). However and interestingly, the highest dose of DCA induced a marked induction of neutrophil cytosolic factor 1 (p47phox) in the FHL2-depleted cells, while the expression levels did not significantly change in the control transfected cells (Figure 3F). p47phox is a regulatory subunit of nicotinamide adenine dinucleotide phosphate oxidases (NOXs) and a well-known marker of oxidative stress in hepatocytes [25].
Furthermore, it has been shown to be critically involved in bile salt-induced apoptosis [26]. Fitting this, western blot analysis revealed lower expression of B-cell lymphoma 2 (BCL2) in FHL2-depleted cells that further decreased in response to DCA stimulation (Figure 3G). In contrast, the mRNA expression of Bcl2-associated X protein (BAX) increased in DCA-treated cells with FHL2 suppression, while the expression levels of this key factor of intrinsic apoptosis did not change in control cells.
(Figure 3H). These data suggest that FHL2 protected HepG2 cells from bile acid-induced oxidative stress and apoptosis.
0 5 10 15 20 25
0 5 10 15 20 25
wt Fhl2ko wt Fhl2ko
CTR BDL
wt Fhl2ko wt Fhl2ko
CTR BDL
α-smamRNA[wt CTR set 1]
0 1 2 3 4 5
0 1 2 3 4 5
wt Fhl2ko wt Fhl2ko
CTR BDL
wt Fhl2ko wt Fhl2ko
CTR BDL
Tgf-βmRNA [wt CTR set 1]
0 50 100 150
0 50 100 150
wt Fhl2ko wt Fhl2ko
CTR BDL
wt Fhl2ko wt Fhl2ko
CTR BDL
Col1a1mRNA[wt CTR set 1]
0 5 10 15 20
0 5 10 15 20
Mmp1mRNA[wt CTR set 1]
wt Fhl2ko wt Fhl2ko
CTR BDL
wt Fhl2ko wt Fhl2ko
CTR BDL
0 2 4 6
0 2 4 6
Mmp2mRNA[wt CTR set 1]
wt Fhl2ko wt Fhl2ko
CTR BDL
wt Fhl2ko wt Fhl2ko
CTR BDL
0 10 20 30 40 50
0 10 20 30 40 50
Mmp9mRNA[wt CTR set 1]
wt Fhl2ko wt Fhl2ko
CTR BDL
wt Fhl2ko wt Fhl2ko
CTR BDL
0 20 40 60 80
0 20 40 60 80
wt Fhl2ko wt Fhl2ko
CTR BDL
wt Fhl2ko wt Fhl2ko
CTR BDL
Pai-1mRNA[wt CTR set 1]
F
G H I
A C
D
**
**
**
**
B
E
wt BDL Fhl2koBDL
wt BDL Fhl2koBDL
Figure 2. Effect of Fhl2 deficiency on hepatic fibrosis in the mouse model of bile duct ligation (BDL).
Fhl2-deficient (Fhl2-ko) and wild type (wt) mice were either subjected to BDL or were sham-operated (CTR). (A) Hepatic α-sma mRNA expression levels. (B) Immunohistochemical α-sma staining of liver tissue sections (20 × magnification). Hepatic (C) Tgf-β and (D) Col1a1 mRNA expression levels. (E) Sirius Red/Fast Green staining of liver tissue sections (20 × magnification). Hepatic (F) Mmp1, (G) Mmp2, (H) Mmp9, and (I) Pai-1 mRNA expression levels in liver tissue analyzed by qRT-PCR. (*: p < 0.05).
3.3. FHL2 Depletion Promotes Bile Acid-Induced Hepatocellular Injury In Vitro
To gain further insight into the mechanism by which FHL2 affects hepatocellular injury in the BDL-induced model of chronic cholestasis, we wanted to analyze whether FHL2 affected the cellular response of hepatocytes to bile acids in vitro. To achieve this, we used the well-established human hepatoma cell line HepG2 and si-pool technology for specific FHL2 suppression (Figure 3A,B).
Subsequently, cells were treated with two different concentrations of deoxycholic acid (DCA) for 24 h.
DCA exposition did not affect FHL2 expression levels (Figure 3E). Furthermore, we did not observe
cytotoxic effects under these experimental conditions (Figure 3C,D). However and interestingly, the
highest dose of DCA induced a marked induction of neutrophil cytosolic factor 1 (p47phox) in the
FHL2-depleted cells, while the expression levels did not significantly change in the control transfected
cells (Figure 3F). p47phox is a regulatory subunit of nicotinamide adenine dinucleotide phosphate
oxidases (NOXs) and a well-known marker of oxidative stress in hepatocytes [25]. Furthermore, it has
been shown to be critically involved in bile salt-induced apoptosis [26]. Fitting this, western blot analysis
revealed lower expression of B-cell lymphoma 2 (BCL2) in FHL2-depleted cells that further decreased
in response to DCA stimulation (Figure 3G). In contrast, the mRNA expression of Bcl2-associated X
protein (BAX) increased in DCA-treated cells with FHL2 suppression, while the expression levels of
this key factor of intrinsic apoptosis did not change in control cells. (Figure 3H). These data suggest
that FHL2 protected HepG2 cells from bile acid-induced oxidative stress and apoptosis.
Cells2020,9, 248 7 of 12
Cells 2020, 9, x FOR PEER REVIEW 7 of 12
Figure 3. Effect of FHL2 depletion on bile acid-induced hepatocellular injury in vitro. (A,B) FHL2 mRNA and protein expression in HepG2 cells transfected with si-pools against FHL2 (siFHL2) and si-control-pools (siCtr). (C) Representative microscopical images 72 h after transfection (10X magnification). (D) Quantification of lactate dehydrogenase (LDH) release into the supernatant. (E) FHL2, (F) p47phox, and (H) BAX mRNA, and (G) B-cell lymphoma 2 (BCL2) protein expression after treatment with deoxycholic acid (DCA) for 24 h and control cells (CTR). (*: p < 0.05).
3.4. FHL2 Depletion Affects Expression of Key Enzymes of Bile Acid Metabolism
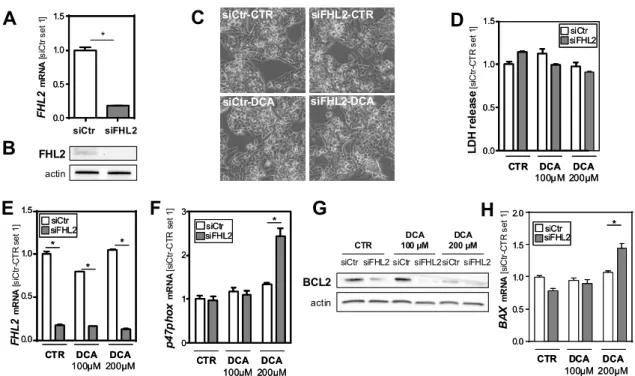
Cytochrome P450 7A1 (CYP7A1) is the key enzyme of bile acid synthesis. Its expression levels were slightly reduced in the DCA-treated control cells, while the FHL2-depleted cells showed increased expression levels in response to the highest DCA dose (Figure 4A). Interestingly, Na
+- taurocholate cotransporting polypeptide (NTCP), the major transporter for bile acid uptake, was already, under basal conditions, significantly higher expressed in FHL2-depleted compared to control cells (Figure 4B). In response to DCA stimulation, NTCP expression levels declined but remained higher in the FHL2-depleted cells (Figure 4B).
Figure 4. Effect of FHL2 depletion on bile acid metabolism. HepG2 cells were transfected with si- pools against FHL2 (siFHL2) and si-control-pools (siCtr). Analysis of (A) CYP7A1, (B) NTCP, (C) BSEP, and (D) MRP2 mRNA expression after treatment with deoxycholic acid (DCA) for 24 h and control cells (CTR). (*: p < 0.05).
In contrast, the expression levels of bile salt export pump (BSEP) and multidrug resistance-associated protein 2 (MRP2) did not differ between the FHL2-depleted and control cells (Figure 4C,D).
siCtr-CTR
FHL2
FHL2mRNA[siCtr set 1]
FHL2mRNA[siCtr-CTR set 1] LDH release[siCtr-CTR set 1]
p47phoxmRNA[siCtr-CTR set 1] BAXmRNA[siCtr-CTR set 1]
A
B
D
E F
C
G H
siFHL2-CTR
siCtr-DCA siFHL2-DCA
*
**
**
**
**
0 1 2 3
0 1 2 3
**
actin DCA
100µM DCA 200µM CTR DCA
100µM DCA 200µM CTR
DCA 100µM DCA
200µM CTR DCA
100µM DCA 200µM
CTR DCA
100µM DCA 200µM CTR DCA
100µM DCA 200µM
CTR DCA
100µM DCA 200µM CTR DCA
100µM DCA 200µM CTR
0.0 0.5 1.0 1.5
0.0 0.5 1.0 1.5
0.0 0.5 1.0 1.5
0.0 0.5 1.0 1.5
siCtr siFHL2
0.0 0.5 1.0 1.5 2.0
0.0 0.5 1.0 1.5 2.0 CTR
DCA 100 µM
BCL2 actin
siCtr siFHL2
DCA 200 µM siCtr siFHL2siCtr siFHL2
0.0 0.5 1.0 1.5
0.0 0.5 1.0 1.5
siFHL2siCtr siFHL2siCtr
siFHL2siCtr siFHL2siCtr
siFHL2siCtr siFHL2siCtr
siFHL2 siCtr siFHL2 siCtr
CYP7A1mRNA[siCtr-CTR set 1] NTCPmRNA[siCtr-CTR set 1] MRP2mRNA[siCtr-CTR set 1]
BSEP mRNA[siCtr-CTR set 1]
DCA 100µM
DCA 200µM CTR DCA
100µM DCA 200µM CTR
A B C D
0 5 10 15
0 5 10 15
0 1 2 3
0 1 2 3
0 1 2 3
0 1 2 3
** **
DCA 100µM
DCA 200µM CTR DCA
100µM DCA 200µM
CTR DCA
100µM DCA 200µM CTR DCA
100µM DCA 200µM
CTR DCA
100µM DCA 200µM CTR DCA
100µM DCA 200µM CTR
**
siFHL2siCtr siFHL2siCtr
0.0 0.5 1.0 1.5
0.0 0.5 1.0 1.5
siFHL2siCtr siFHL2siCtr
siFHL2 siCtr siFHL2 siCtr
siFHL2siCtr siFHL2siCtr
Figure 3. Effect of FHL2 depletion on bile acid-induced hepatocellular injury in vitro. (A,B) FHL2 mRNA and protein expression in HepG2 cells transfected with si-pools against FHL2 (siFHL2) and si-control-pools (siCtr). (C) Representative microscopical images 72 h after transfection (10X magnification). (D) Quantification of lactate dehydrogenase (LDH) release into the supernatant.
(E) FHL2, (F) p47phox, and (H) BAX mRNA, and (G) B-cell lymphoma 2 (BCL2) protein expression after treatment with deoxycholic acid (DCA) for 24 h and control cells (CTR). (*: p < 0.05).
3.4. FHL2 Depletion Affects Expression of Key Enzymes of Bile Acid Metabolism
Cytochrome P450 7A1 (CYP7A1) is the key enzyme of bile acid synthesis. Its expression levels were slightly reduced in the DCA-treated control cells, while the FHL2-depleted cells showed increased expression levels in response to the highest DCA dose (Figure 4A). Interestingly, Na
+-taurocholate cotransporting polypeptide (NTCP), the major transporter for bile acid uptake, was already, under basal conditions, significantly higher expressed in FHL2-depleted compared to control cells (Figure 4B).
In response to DCA stimulation, NTCP expression levels declined but remained higher in the FHL2-depleted cells (Figure 4B).
Cells 2020, 9, x FOR PEER REVIEW 7 of 12
Figure 3. Effect of FHL2 depletion on bile acid-induced hepatocellular injury in vitro. (A,B) FHL2 mRNA and protein expression in HepG2 cells transfected with si-pools against FHL2 (siFHL2) and si-control-pools (siCtr). (C) Representative microscopical images 72 h after transfection (10X magnification). (D) Quantification of lactate dehydrogenase (LDH) release into the supernatant. (E) FHL2, (F) p47phox, and (H) BAX mRNA, and (G) B-cell lymphoma 2 (BCL2) protein expression after treatment with deoxycholic acid (DCA) for 24 h and control cells (CTR). (*: p < 0.05).
3.4. FHL2 Depletion Affects Expression of Key Enzymes of Bile Acid Metabolism
Cytochrome P450 7A1 (CYP7A1) is the key enzyme of bile acid synthesis. Its expression levels were slightly reduced in the DCA-treated control cells, while the FHL2-depleted cells showed increased expression levels in response to the highest DCA dose (Figure 4A). Interestingly, Na
+- taurocholate cotransporting polypeptide (NTCP), the major transporter for bile acid uptake, was already, under basal conditions, significantly higher expressed in FHL2-depleted compared to control cells (Figure 4B). In response to DCA stimulation, NTCP expression levels declined but remained higher in the FHL2-depleted cells (Figure 4B).
Figure 4. Effect of FHL2 depletion on bile acid metabolism. HepG2 cells were transfected with si- pools against FHL2 (siFHL2) and si-control-pools (siCtr). Analysis of (A) CYP7A1, (B) NTCP, (C) BSEP, and (D) MRP2 mRNA expression after treatment with deoxycholic acid (DCA) for 24 h and control cells (CTR). (*: p < 0.05).
In contrast, the expression levels of bile salt export pump (BSEP) and multidrug resistance-associated protein 2 (MRP2) did not differ between the FHL2-depleted and control cells (Figure 4C,D).
siCtr-CTR
FHL2
FHL2mRNA[siCtr set 1]
FHL2mRNA[siCtr-CTR set 1] LDH release[siCtr-CTR set 1]
p47phoxmRNA[siCtr-CTR set 1] BAXmRNA[siCtr-CTR set 1]
A
B
D
E F
C
G H
siFHL2-CTR
siCtr-DCA siFHL2-DCA
*
**
**
**
**
0 1 2 3
0 1 2 3
**
actin DCA
100µM DCA 200µM CTR DCA
100µM DCA 200µM CTR
DCA 100µM DCA
200µM CTR DCA
100µM DCA 200µM
CTR DCA
100µM DCA 200µM CTR DCA
100µM DCA 200µM
CTR DCA
100µM DCA 200µM CTR DCA
100µM DCA 200µM CTR
0.0 0.5 1.0 1.5
0.0 0.5 1.0 1.5
0.0 0.5 1.0 1.5
0.0 0.5 1.0 1.5
siCtr siFHL2
0.0 0.5 1.0 1.5 2.0
0.0 0.5 1.0 1.5 2.0
CTR DCA
100 µM
BCL2 actin
siCtr siFHL2
DCA 200 µM siCtr siFHL2siCtr siFHL2
0.0 0.5 1.0 1.5
0.0 0.5 1.0 1.5
siFHL2siCtr siFHL2siCtr
siFHL2siCtr siFHL2siCtr
siFHL2siCtr siFHL2siCtr
siFHL2 siCtr siFHL2 siCtr
CYP7A1mRNA[siCtr-CTR set 1] NTCPmRNA[siCtr-CTR set 1] MRP2mRNA[siCtr-CTR set 1]
BSEP mRNA[siCtr-CTR set 1]
DCA 100µM
DCA 200µM CTR DCA
100µM DCA 200µM CTR
A B C D
0 5 10 15
0 5 10 15
0 1 2 3
0 1 2 3
0 1 2 3
0 1 2 3
** **
DCA 100µM
DCA 200µM CTR DCA
100µM DCA 200µM
CTR DCA
100µM DCA 200µM CTR DCA
100µM DCA 200µM
CTR DCA
100µM DCA 200µM CTR DCA
100µM DCA 200µM CTR
**
siFHL2siCtr siFHL2siCtr
0.0 0.5 1.0 1.5
0.0 0.5 1.0 1.5
siFHL2siCtr siFHL2siCtr
siFHL2 siCtr siFHL2 siCtr
siFHL2siCtr siFHL2siCtr
Figure 4. Effect of FHL2 depletion on bile acid metabolism. HepG2 cells were transfected with si-pools
against FHL2 (siFHL2) and si-control-pools (siCtr). Analysis of (A) CYP7A1, (B) NTCP, (C) BSEP, and
(D) MRP2 mRNA expression after treatment with deoxycholic acid (DCA) for 24 h and control cells
(CTR). (*: p < 0.05).
Cells2020,9, 248 8 of 12
In contrast, the expression levels of bile salt export pump (BSEP) and multidrug resistance-associated protein 2 (MRP2) did not differ between the FHL2-depleted and control cells (Figure 4C,D).
Moreover, the exposition to DCA caused a marked induction of the expression of these major bile salt export transporters, but this induction was similar in the FHL2-depleted and control cells.
Together, these data indicate that the elevated synthesis and uptake of bile acids in FHL2-depleted cells may be a potential cause for enhanced hepatocellular injury in cholestasis.
3.5. FHL2 Depletion Promotes Pro-Fibrogenic Gene Expression in Hepatic Stellate Cells
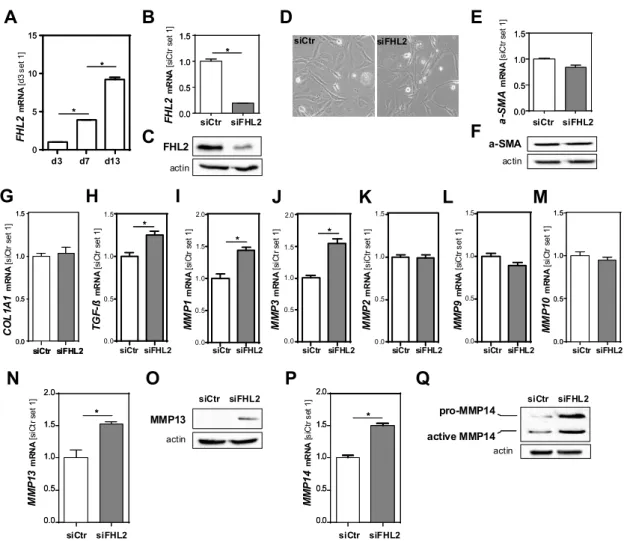
Besides hepatocellular injury and inflammation, enhanced fibrosis was the most prominent pathological feature of the Fhl2-ko mice in the BDL model compared to the wt mice. The activation of hepatic stellate cells (HSCs) is the key event of hepatic fibrosis [2,3]. Here, we found that FHL2 expression was increased in primary human HSCs during in vitro activation (Figure 5A).
Cells 2020, 9, x FOR PEER REVIEW 8 of 12
Moreover, the exposition to DCA caused a marked induction of the expression of these major bile salt export transporters, but this induction was similar in the FHL2-depleted and control cells.
Together, these data indicate that the elevated synthesis and uptake of bile acids in FHL2-depleted cells may be a potential cause for enhanced hepatocellular injury in cholestasis.
3.5. FHL2 Depletion Promotes Pro-Fibrogenic Gene Expression in Hepatic Stellate Cells
Besides hepatocellular injury and inflammation, enhanced fibrosis was the most prominent pathological feature of the Fhl2-ko mice in the BDL model compared to the wt mice. The activation of hepatic stellate cells (HSCs) is the key event of hepatic fibrosis [2,3]. Here, we found that FHL2 expression was increased in primary human HSCs during in vitro activation (Figure 5A).
Figure 5. Effect of FHL2 depletion on pro-fibrogenic gene expression in hepatic stellate cells in vitro.
(A) FHL2 mRNA expression during activation of primary human hepatic stellate cells (HSCs). (B,C) FHL2 mRNA and protein expression in LX-2 cells transfected with si-pools against FHL2 (siFHL2) and si-control-pools (siCtr). (D) Representative microscopical images 72 h after transfection (10×
magnification). (E,F) α-SMA mRNA and protein expression. (G) COL1A1, (H) TGF-β, (I) MMP1, (J) MMP3, (K) MMP2, (L) MMP9 and (M) MMP10 mRNA expression and (N,O) MMP13 and (P,Q) MMP14 mRNA and protein expression 72 h after transfection. (*: p < 0.05).
To further assess whether the pro-fibrogenic effects of FHL2 deficiency in the BDL model were also mediated via direct effects in HSCs, we depleted FHL2 in the human HSC line LX-2 by applying si-pool technology. Control cells were transfected with unspecific control si-pools (Figure 5B,C). A microscopical analysis revealed no differences between the FHL2-depleted and control HSCs (Figure
FHL2mRNA[siCtr set 1]
siCtr siFHL2
A
C
D
G
B
H I
FHL2mRNA[d3 set 1]
d3 d7 d13
**
**
siCtr siFHL2
J K L M
0.0 0.5 1.0 1.5 2.0
COL1A1mRNA[siCtr set 1]
siCtr siFHL2
TGF-ßmRNA[siCtr set 1]
siCtr siFHL2 siCtr siFHL2
MMP1mRNA[siCtr set 1]
siCtr siFHL2 0.0
0.5 1.0 1.5
siCtr siFHL2 0.0
0.5 1.0 1.5
0.0 0.5 1.0 1.5
**
0.0 0.5 1.0 1.5 2.0
MMP3mRNA[siCtr set 1] MMP2mRNA[siCtr set 1]
0 .0 0 .5 1 .0 1 .5
MMP9mRNA[siCtr set 1] MMP10mRNA[siCtr set 1]
0.0 0.5 1.0 1.5
0.0 0.5 1.0 1.5
0.0 0.5 1.0 1.5
siCtr siFHL2 siCtr siFHL2 siCtr siFHL2 FHL2
actin
pro-MMP14
actin a-SMA
actin
MMP13 actin 0
5 10 15
0 5 10 15
0.0 0.5 1.0 1.5
0.0 0.5 1.0 1.5
**
active MMP14
a-SMAmRNA[siCtr set 1]
siCtr siFHL2
MMP13mRNA[siCtr set 1]
siCtr siFHL2
**
F E
N O
MMP14mRNA[siCtr set 1]
siCtr siFHL2
**
P Q
siCtr siFHL2 siCtr siFHL2
0.0 0.5 1.0 1.5 2.0
0.0 0.5 1.0 1.5 2.0
** **
0.0 0.5 1.0 1.5 2.0
0.0 0.5 1.0 1.5 2.0
0.0 0.5 1.0 1.5
0.0 0.5 1.0 1.5
Figure 5. Effect of FHL2 depletion on pro-fibrogenic gene expression in hepatic stellate cells in vitro. (A) FHL2 mRNA expression during activation of primary human hepatic stellate cells (HSCs). (B,C) FHL2 mRNA and protein expression in LX-2 cells transfected with si-pools against FHL2 (siFHL2) and si-control-pools (siCtr). (D) Representative microscopical images 72 h after transfection (10 × magnification). (E,F) α-SMA mRNA and protein expression. (G) COL1A1, (H) TGF-β, (I) MMP1, (J) MMP3, (K) MMP2, (L) MMP9 and (M) MMP10 mRNA expression and (N,O) MMP13 and (P,Q) MMP14 mRNA and protein expression 72 h after transfection. (*: p < 0.05).
To further assess whether the pro-fibrogenic effects of FHL2 deficiency in the BDL model were
also mediated via direct effects in HSCs, we depleted FHL2 in the human HSC line LX-2 by applying
Cells2020,9, 248 9 of 12
si-pool technology. Control cells were transfected with unspecific control si-pools (Figure 5B,C).
A microscopical analysis revealed no differences between the FHL2-depleted and control HSCs (Figure 5D); additionally, α-SMA mRNA and protein levels (Figure 5E,F), as well as COL1A1 mRNA expression, were not affected by FHL2 depletion (Figure 5G).
In contrast, TGF-β levels were slightly but significantly higher in the FHL2-depleted cells compared to the control cells (Figure 5H). Furthermore, the mRNA expression of several metalloproteinases, including MMP1, MMP3, MMP13 and MMP14, was higher in FHL2-depleted cells (Figure 5I–N,P).
A western blot analysis of MMP13 and MMP14 revealed that these differences were even more pronounced on the protein level (Figure 5O,Q). In summary, these data indicate that FHL2 depletion also has direct pro-fibrogenic effects in HSCs in vitro.
4. Discussion
In this study, we aimed to analyze the function of FHL2 in cholestatic liver injury. In murine studies, we used the BDL model, a well-established model to mimic cholestatic liver injury and fibrosis. In this model, the Fhl2-deficient mice revealed a significantly enhanced manifestation of pathological progression. A histological analysis and serum transaminase levels showed significantly enhanced hepatocellular damage. In a previous study, liver histology and serum transaminase levels did not differ between the Fhl2-deficient and wt mice in the model of chronic toxic liver injury with carbon tetrachloride (CCl
4) [19]. This indicates that Fhl2 deficiency does not uniformly enhance the vulnerability of hepatocytes for (toxic) injury. Still, it has to be noted that here, as well as in the previous study that applied the CCl
4model, only male mice have been assessed. A study by Govoni et al. found that the female Fhl2-ko mice revealed a lower bone mineral content and bone mineral density compared to their male littermates [27]. Further studies need to evaluate whether there are also gender-specific differences in regard to Fhl2 and (cholestatic) liver injury.
Despite the effect on bone density, the Fhl2-ko mice have shown no obvious abnormalities, suggesting a high capacity for the fine-tuning adjustment and functional redundancy of Fhl2 under physiological conditions [9]. Additionally, here and as already described in previous studies [19], the Fhl2-ko control or sham-operated mice did not show any hepatologic abnormalities, and after BDL, a macroscopic analysis did not show pathological alterations besides the liver (data not shown). Still, it has to be considered that the complete Fhl2-ko in the mice may have also affected further organs or (patho)physiological mechanisms that contributed to the observed enhanced hepatocellular injury, inflammation and fibrosis in the BDL model.
Bile acids are significantly elevated after BDL and are majorly involved in cholestatic liver injury [28,29]. This prompted us to further assess the role of FHL2 in bile acid metabolism. We found that, under basal conditions, the FHL2-depleted hepatoma cells showed significantly higher NTCP expression levels compared to the control cells; additionally, upon bile acid stimulation, the expression of this major transporter for uptake of bile acids into hepatocytes remained significantly higher in the FHL2-depleted cells. Moreover, the FHL2-depleted cells showed a higher CYP7A1 expression upon bile acid stimulation. CYP7A1 is the rate-limiting enzyme in bile acid synthesis. In combination, these findings indicate enhanced bile acid levels as potential reason for the more pronounced hepatocellular injury of the Fhl2-deficient mice in the BDL model.
To the best of our knowledge, no previous studies have assessed the role of FHL2 in bile acid metabolism. Only one study described the impact of FHL2 on cholesterol metabolism in vascular smooth muscle cells [30]. Kurakula et al. observed that cholesterol synthesis and liver X receptor (LXR) pathways are altered in the absence of FHL2, functionally resulting in an attenuated cholesterol efflux [30].
Next to enhanced hepatocellular injury, FHL2 deficiency caused a markedly enhanced expression
of pro-inflammatory genes, paralleled by enhanced fibrogenesis in the BDL model. These pathological
processes are closely intertwined, and it is difficult to dissect whether the enhanced fibrosis was
Cells2020,9, 248 10 of 12