Systematic Support for Continuous Optimization of Lean-Based Manufacturing Systems
Yilmaz Uygun
TU Dortmund University, Chair of Factory Organization, yilmaz.uygun@tu-dortmund.de
Due to the organizational complexity that goes along with the introduction and application of a lean production system, companies cannot lift the full potential of lean production. Problems, such as specific company conditions, lack of expertise in the implementation and continuous development as well as financial and personnel constraints inhibit the introduction and in particular the use and sustainable development of methods of lean production. As part of the continuous improvement process the constant questioning of existing structures is of particular importance. However, companies are missing tools that support automatically the development of lean production systems so that their full potential can be exploited. Against the background of the described problem, the author developed a tool in the form of an optimization system for lean production systems and validated it in an automotive supplier, which allows a comprehensive analysis of the current state of the application of lean methods and the proposal of relevant suggestions taking into consideration the diverse interrelations in the network of interdependent lean methods. An extensive record of existing basic and method parameters paired with a comprehensive assignment of optimization measures allows a consistent display of improvement proposals which can be applied within the continuous improvement process. The target group of this system is goods manufacturing industry.
Keywords: Lean production, diagnosis, evaluation, improvement, continuous improvement process
Motivation
Even after almost 30 years, the implementation and improvement of lean production
systems are still of interest, as shown in several studies, like Uygun et al. (2009), Uygun
et al. (2010). The change of the production organization towards a waste-free and flow
manufacturing implies major changes in the configuration and coordination of
production systems which is still a big challenge for companies. The once implemented
methods need a continuous development in order to become steadily better. Especially
for this case, companies are lacking support to realize a continuous improvement of the lean production system they once set up. This results in disappointment of lean production systems which normally could generate immense efficiency gains, if they are implemented and developed properly.
For the continuous improvement companies rely more and more on experts, especially consultants, which have implicit knowledge of the complex linkages of a lean production system. Since, the improvement process should be continuously, the support should also be continuously.
So, the challenge is to develop an optimization system which continuously supports companies to question their lean production system. The evaluation system should therefore give automatically company-specific recommendations rather than general recommendations for improving the lean production system.
Existing Concepts
After successfully implementing lean methods of a lean production system, be it within companies (e.g. Kortmann & Uygun 2007, Keßler & Uygun 2007, Uygun & Wagner 2011) or across companies (e.g. Uygun & Straub 2011, 2013), their continuous improvement has to be considered. Such an optimization system has to comprise both an evaluation and recommendation aspect. The former is very present in literature whereas the latter is underrepresented.
There are concepts for the optimal deployment of lean production systems, like the ones by Kosonen and Buhanist (1995), Ahlstrom (1998), Spear and Bowen (1998), Liker and Meier (2006), Sakai et al. (2007), Black (2007), or Wilson (2010).
Additionally, there are also guidelines for specific lean aspects available, like the ones
by Jugulum and Samuel (2008) as well as Thomas et al. (2009) who concentrate on the
implementation of Six Sigma, whereas Mothersell et al. (2008) have a special focus on
hoshin kanri. Apart from that some authors worked on the implementation in specific industries as case studies, like Kojima and Kaplinsky (2004) focusing on automotive suppliers, Kumar et al. (2006) focusing on Indian SME, Lee and Jo (2007) adopting lean principles to a big car manufacturer, Collins and Muthusamy (2007) implementing lean methods to a healthcare provider, Ben-Tovim et al. (2007) deploying lean methods in a hospital similar to Young and Wachter (2009), and Rutledge et al., (2010) applying lean methods in research laboratories. However, all these approaches address an efficient and optimized deployment of lean production systems, but they propose merely implementation guidelines without discussing the continuous development.
Some other authors analyzed the results of the implementation which can be seen as an evaluation of the current state. Bamber and Dale (2000) examined an aerospace manufacturing organization as to weaknesses and differences to motor manufacturing environment in the context of the deployment of lean methods.
Cuatrecasas (2002) evaluated the variability of performance of adopting lean principles to service processes. These approaches purely state the effects of lean production systems without developing a systematic methodology for optimization.
Nevertheless, there are standardized and widely acknowledged evaluation methods, like the Rapid Plant Assessment by Goodson (2002), Operations Excellence Audit Sheet by Alfnes et al. (2008), Framework for a Lean Manufacturing Planning System by Mejabi (2003), Value Stream Mapping by Rother and Shook (1999), and the 20-Keys Methodology by Kobayashi (1995). These approaches offer different perspectives as to company performance and are depicted in the following.
The Rapid Plant Assessment (RPA) by Goodson (2002) is a general lean audit to
check the degree of fulfillment of lean principles based on visual impressions and
interviews during a shop floor tour in a relatively short time with an assessment scheme
and questionnaire. Although the RPA is suitable to assess the realization of maturity of lean principles and methods, the evaluation is strongly subjective and can be seen as rough due to the limited measurement catalog.
Similar to the RPA a further approach by Alfnes et al. (2008) is available which is called the Operations Excellence Audit Sheet for assessing the maturity of the production system. This instrument is also suitable for determining the maturity of implementation of lean principles and methods. However, there is no detailed description of the characteristics of each stage and the documentation needed for operationalization in the form of checklists, making the assignment to the respective grades highly subjective. Although the approach provides an analysis of weaknesses, but does not (automatically) derive improvement measures.
Apart from that, there exist the Framework for a Lean Manufacturing Planning
System by Mejabi (2003) which encompasses an assessment methodology for both the
actual state of the production system and the lean implementation in the form of "Cost
of Waste" to quantify the wastes, "Cost of Lean" and "Lean Savings" to determine the
lean manufacturing cash flow for the analysis of material costs and profits of a lean
implementation and development. A standardized set of lean metrics has been
developed that measures the company performance. In addition, the concept also
includes a lean manufacturing scorecard and a benchmarking module. These assist
companies in the performance measurement and determine the medium-term goals,
which extend to a planning horizon of up to five years. This approach includes
planning, assessment as well as improvement methodology of lean manufacturing and is
well suited to assess the progress of implementation of the principles by assessing the
achievement of objectives and performing an economic efficiency analysis. The main
focus of the approach, however, lays on the medium-term planning horizon and the management level.
As a further general evaluation and optimization instrument the Value Stream Mapping (VSM) by Rother and Shook (1999) can be stated. Based on production data and shop floor visits a current state map with weaknesses is derived which leads to the design of a future state map. This approach takes into account the whole production system and the main material flow on a rough level and gives hints for the general redesign of the production system. A detailed discussion about the effective and efficient deployment of lean methods is not considered. Sullivan et al. (2002) examine an equipment replacement decision problem using this Value Stream Mapping. They develop a roadmap to extract necessary information for analysis of equipment replacement decision problems from VSM.
There exist also the 20 Keys® method by Kobayashi (1995) which is a qualitative benchmarking approach and includes a self-assessment system, which makes it possible to assess the status quo and the implementation stages of the production system and compares them with best-practice companies. In 20 different areas criteria are established, which greatly influence the evaluation of a production system in the company. All keys influence each other, so that a system of mutual interdependence is set up. The 20-Key system is suitable for benchmarking of lean production systems but it focuses rather on the evaluation of lean principles. Although the 20-Key system includes individual methods, the detail level of the checklists is not enough for an in- depth assessment of methods. An automated display of recommendations is not possible. The derivation of improvement actions must be performed manually.
Doolen and Hacker (2005) developed a survey instrument to assess the number
and level of implementation of lean methods in a company. They also conducted an
exploratory study in the electronics industry and found out that many lean methods are deployed but with different levels of implementation which is mainly caused by economic, operational, and organizational factors.
There are also industry and company-specific approaches for efficiency analysis, like the ones by Wang (2008) and Saurin and Ferreira (2009). The approach of Wang (2008) deals with the efficiency analysis of lean methods based on a case study of an optic enterprise with its different factories. The methodology is based on empirical data which make obvious that efficiency is mainly affected by the organizational culture.
This approach is too rough-cut and company specific so that a general analysis can hardly be done. The analysis focuses on weaknesses without giving countermeasures automatically. Saurin and Ferreira (2009) analyzed the impacts of lean manufacturing on working conditions of a harvester assembly line in Brazil based on a qualitative assessment, questionnaire, and feedback meeting of the implementation of lean methods through personal interviews with managers, safety specialists, and workers. The framework for analysis comprises the four aspects work content, work organization, continuous improvement, and health and safety. This framework is company specific and too rough for an in-depth analysis. The proposal of improvement measures is also lacking.
Furthermore, there is the concept of Meade et al. (2006) analyzing the negative
impact of accounting methods on profits while implementing lean methods. This impact
on profit is calculated by common accounting methods. They found out that the
efficiency gains by a lean production system with continuous reduction of inventories
do not lessen that negative impact. They conducted a hybrid multi-period simulation
approach for manufacturing planning and inventory tracking. They use a spreadsheet
program for generating MRP data and a simulation software for the model production
environment in order to examine the magnitude and duration of that negative impact.
This approach has a strong financial focus on the negative impact of accounting methods without considering improvement measures for lean methods.
In addition to the assessment of a lean production system in its entirety, there are also specific audit approaches for individual methods developed by and used in industry, such as group work, standardization, continuous improvement, or 5S, which only focus on one specific method. Therefore these audits are not suitable for the evaluation of a lean production system in its entirety.
Summing up, existing implementation approaches address the optimal deployment but are lacking a continuous development component. The analyzed evaluation systems, on the other hand, come as audits and/or maturity models. Audits are well suited for lean production, however, there is a low grade of detail of the existing approaches and necessary adjustments to these standardized evaluation methods have to be considered. The quality of the results of the evaluation depends highly on the quality of the assessment catalog. There also exist the general disadvantages of audits, such as the restriction to a purely qualitative evaluation and certain subjectivity. Apart from that, there are maturity models which are well suited for lean production, but the applicability of an evaluation catalog must be created in the first instance, which is used to support an audit. Finally it can be concluded that the analyzed methods offer only partial solutions for lean production optimization. There is no single approach that supports automated assessment and display of proposals for improvement.
Methodology and Overall Concept
Based on the findings of the review of existing concepts, a new method has to be
developed so that a continuously consistent and operationalized evaluation of lean
production systems can be guaranteed that involves all levels of lean production and automates the output of recommendations for improvement. 1
As mentioned above, the optimization system has to assist in identifying company-specific improvement measures. So, it is in the first instance necessary to map the current state of the production system and then to evaluate it by identifying weaknesses so as to propose concrete measures.
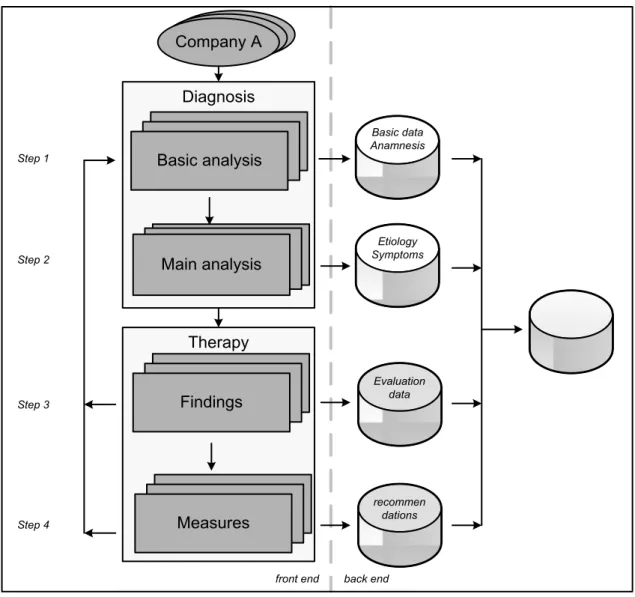
For this, the well-known procedure of mapping the current state, identifying weaknesses, and mapping the future state has to be detailed for the purpose of this paper. As shown in Figure 1, the mapping of the current state is a diagnosis encompassing both basic and main analysis. The former addresses the identification of company characteristics with production-related data. The latter focuses on lean methods by identifying them and evaluating their effectiveness and efficiency within the network of all lean methods. The future state is actually a therapy by displaying a report of existing weaknesses and optimization measures based on both company characteristics and methods in order to provide company-specific measures. On the one hand, the optimization measures derived from the ideal situation will be correlated with the company specifics given in the mapping of the current state. On the other hand, the measures will be associated with the method characteristics.
1 For a more detailed discussion refer to Uygun et al. (2011) and Uygun (2013)
Diagnosis
Therapy Company A
Main analysis
Findings
Measures
front end back end Step 1
Step 2
Step 3
Step 4
Basic analysis
Basic data Anamnesis
Etiology Symptoms
Evaluation data
recommen dations
Figure 1. Overall methodology for the development of the optimization system
The optimization system has to enable the realization of these steps, as shown in
Figure 1. For mapping of the current state, data have to be collected. This will be done
with a questionnaire consisting of questions which have to be derived systematically
and which answer choices have to be assigned to. According to this, all production-
related and methods-related information have to be identified and answer choices have
to be assigned to them. The answers then have to be set in correlation with each other
and with company characteristics in order to give automated improvement suggestions.
Diagnosis
Basic Analysis
In the first stage, the production-relevant company data have to be collected. This step represents a basic investigation, in which the anamnesis is carried out in order to provide information about the history and circumstances of the company. With regard to the diagnosis the interdependencies of this information with the methods play a crucial role. Therefore, in addition to the elaboration of the basic data that of interdependencies also has to be carried out. Here, the influence of each individual basic data on individual methods is determined. It is analyzed in detail whether the individual basic data affects the particular method negatively or positively. The negative influence in this context can mean either that in the presence of this basic data the specific method is not applicable or this basic data has to be adapted if the method should still remain in use.
The positive effect indicates that the basic conditions for the use of the specific method are given. This provision is for the evaluation of great importance. Methods that are inadequate in use, but where a positive effect by the basic data is given, should be optimized.
To record the basic data a structured derivation of lean-related data is required.
Considering relevant production data, a process-oriented approach is expedient. Based
on the process parameters control, content, resources, and structures, various
production-related features can be grouped together. The coding of these data takes
place systematically, with 0 and 3 for decision and with 1, 2, or 3 for evaluation. The
expression of evaluation answers is dependent on the corresponding basic data and may
be different, e.g. low (“1”) to high (“3”) or bad (“1”) to good (“3”).
Main Analysis
Lean Methods
For the main analysis, firstly, the structure of the lean reference model with type and number of elements has to be determined. To this end, relevant collections of lean methods in literature have been considered. For this, a double-track approach by considering published lean methods of both industrial companies and scientists is practical. There are numerous published production systems of companies with collections of lean methods available, like Ford, Mercedes-Benz, Audi, VW, and of course Toyota. These production systems differ either significantly or marginally. Since a lean production system is an interdependent network of methods and tools specific company suitable combination of methods must be found in the implementation and operation of lean production systems which lead to different company-specific lean production systems. This means that the selected company-specific methods must be checked for their mutual influence, whether other individual methods are required or supported (Takeda, 2006).
As to general collections of lean methods, several publications and lean method collections were considered, like Jones et al. (1999), Sullivan et al. (2002), Shah and Ward (2003), Bicheno (2004), Kumar et al. (2006), Liker and Meier (2006), and Towill (2007). Examining these collections, a high number of production organization methods become obvious. So, the major challenge is to sum up the high number of methods to a manageable quantity and to guarantee simultaneously an extensive analysis. For this purpose, these existing collections of lean methods were listed, compared, and common methods were identified and re-named. In the end, 15 so-called basic lean methods 2
2 for a detailed discussion of some of these lean methods refer to Uygun et al. (2015)
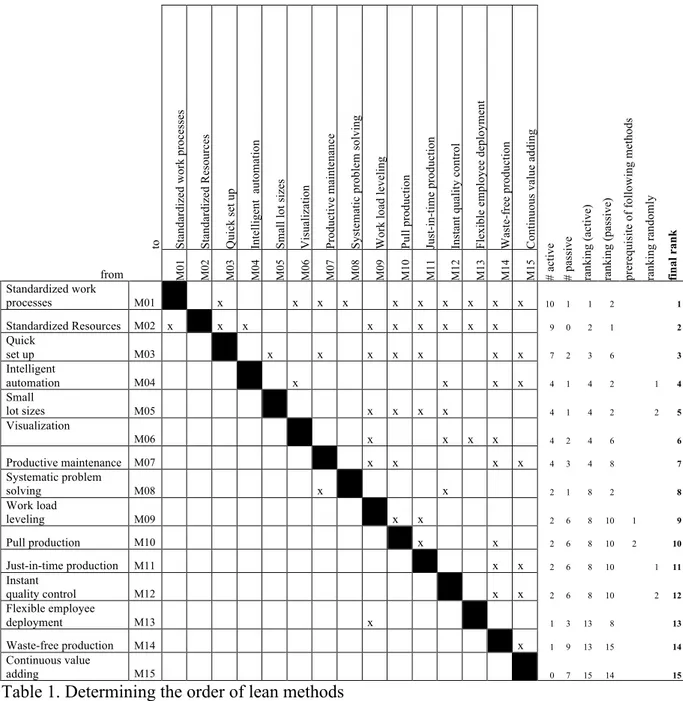
were derived, as listed in Table 1, which then were checked against the existing company-specific production systems so as to check their validity.
to St an da rd iz ed wo rk p ro ce ss es St an da rd iz ed R es ou rc es Qu ic k se t u p In te ll ig en t au to m at io n Sm al l l ot s iz es Vi su al iz at io n Pr od uc ti ve m ai nt en an ce Sy st em at ic p ro bl em s ol vi ng Wo rk lo ad le ve li ng Pu ll p ro du ct io n Ju st -in -tim e p ro du ctio n In st an t q ua li ty c on tro l Fl ex ib le e m pl oy ee de pl oym ent Wa st e- fre e pro du ct io n Co nt in uo us v al ue a dd in g # ac ti ve # pa ss ive ra nk in g (a ct iv e) ra nk in g (p as si ve ) pr er equi si te of f ol low ing m et hods ra nk in g ra nd om ly fi n al r an k from M0 1 M0 2 M0 3 M0 4 M0 5 M0 6 M0 7 M0 8 M0 9 M1 0 M1 1 M1 2 M1 3 M1 4 M1 5
Standardized work
processes M01 x x x x x x x x x x 10 1 1 2 1
Standardized Resources M02 x x x x x x x x x 9 0 2 1 2
Quick
set up M03 x x x x x x x 7 2 3 6 3
Intelligent
automation M04 x x x x 4 1 4 2 1 4
Small
lot sizes M05 x x x x 4 1 4 2 2 5
Visualization
M06 x x x x 4 2 4 6 6
Productive maintenance M07 x x x x 4 3 4 8 7
Systematic problem
solving M08 x x 2 1 8 2 8
Work load
leveling M09 x x 2 6 8 10 1 9
Pull production M10 x x 2 6 8 10 2 10
Just-in-time production M11 x x 2 6 8 10 1 11
Instant
quality control M12 x x 2 6 8 10 2 12
Flexible employee
deployment M13 x 1 3 13 8 13
Waste-free production M14 x 1 9 13 15 14
Continuous value
adding M15 0 7 15 14 15
Table 1. Determining the order of lean methods
After identifying the lean methods, a sequence has to be determined so as to have a procedure for the diagnosis. In determining the order of the methods several consecutive criteria will be applied. The first criterion is the number of active influence.
The method that affects most other methods, receives the highest rank. Here, however,
several methods can have the same number of active influence, such as the methods
M04 – M07 (see Table 1). For such cases, the second criterion comes into force. The
method that is less influenced by others, receives the higher rank. The idea behind this criterion is the assumption that the method that is affected by many other methods has to be placed further downstream, whereby the influence of the preceding methods on this particular method remains. If there is still parity after this criterion, e.g. between method M04 and M05, the third criterion comes to action. Here, an analysis of the prerequisite of methods is carried out whether the equal methods require each other.
This is the case with methods M09 and M10. But this is not the case with the other methods, M04 and M05 as well as M11 and M12, so that the last criterion applies. The sequence is then left to chance.
Evaluation Scheme
Subsequently, as the second stage, the main study will be conducted. This includes the
systematic study of the symptoms and causes of the (wrong or suboptimal) application
of the methods. It is a combined symptom-based and etiological approach. So, for each
method symptoms, causes, and problems are elicited, which then palliative, cause
solving, and problem solving measures are assigned to. In this context, the
interdependencies between these measures have to be taken into account, especially as
certain measures can support, limit, or exclude each other. So, each method is placed in
a larger context of a main problem, cause, effect, and requirement. The focus is on the
main production organization problem with its optimization as the main requirement
which can be satisfied by means of a specific lean method. The main problem has a root
cause, which in turn has a main symptom. For the diagnosis a stepwise execution of
these related aspects is relevant. It should be noted that due to the overall complexity of
control in this context, only the main aspect of each element is considered. A particular
problem may have several causes, and these in turn may show several symptoms.
However, the main aspect is found to be sufficient for the diagnosis, which offers the greatest leverage.
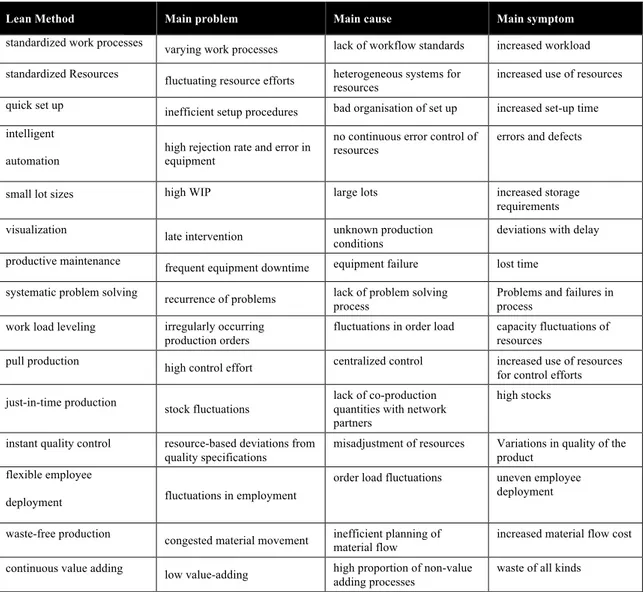
Table 2 summarizes the assignment of the main problems, main causes, and main symptoms for each lean method. For example, the method M01 standardized work processes has the main problem of varying work processes that leads to variations in output results. The main reason or cause is the lack of workflow standards. This is reflected in the main symptom of increased workload.
Lean Method Main problem Main cause Main symptom
standardized work processes varying work processes lack of workflow standards increased workload standardized Resources fluctuating resource efforts heterogeneous systems for
resources
increased use of resources quick set up inefficient setup procedures bad organisation of set up increased set-up time intelligent
automation high rejection rate and error in equipment
no continuous error control of resources
errors and defects
small lot sizes high WIP large lots increased storage
requirements
visualization late intervention unknown production
conditions
deviations with delay productive maintenance frequent equipment downtime equipment failure lost time
systematic problem solving recurrence of problems lack of problem solving process
Problems and failures in process
work load leveling irregularly occurring production orders
fluctuations in order load capacity fluctuations of resources
pull production high control effort centralized control increased use of resources
for control efforts just-in-time production stock fluctuations
lack of co-production quantities with network partners
high stocks
instant quality control resource-based deviations from quality specifications
misadjustment of resources Variations in quality of the product
flexible employee
deployment fluctuations in employment
order load fluctuations uneven employee deployment
waste-free production congested material movement inefficient planning of material flow
increased material flow cost continuous value adding low value-adding high proportion of non-value
adding processes
waste of all kinds
Table 2. Specific main problem, causes, and symptoms of the lean methods
Based on these information a general design method for combining the detailed
problems with the specific measures is needed. For this purpose, the Axiomatic Design
is expedient which is a design methodology aiming at providing a theoretical basis built
on a logical and rational thought process for the design of complex systems. In addition, increased creativity of the designers, reduction of the share of random search process for a solution, minimization of iterative trials, and the transfer to the computer is addressed. This is done through functional requirements (FR) which design parameters (DP) are assigned to. Here, the term axiom is understood as a fundamental truth, functional requirements as a minimal set of independent requirements to cover all functional needs of the object to be designed, and design parameters as physical key variables to fulfill functional requirements. The Axiomatic Design is a decomposition approach, starting with a FR which one unique DP is assigned to. In the next decomposition layer FR derived from the previous DP are identified, which unique DP are assigned to. This decomposition continues till FR-DP combinations are found which cannot be further decomposed. (Suh, 2001)
The structure of the examination and diagnosis follows this Axiomatic Design
principle. It has three decomposition layers, which are linked to the scope of decision
and the target group (see Figure 2). In the highest layer the main requirement stands on
top as the top functional requirement with the associated lean method as design
parameter. The consideration of the main requirement and the introduction of its design
parameter are strategic in nature and relate therefore to top management regarding lean
management responsibility. Depending on size and structure of the company, this can
be either lean managers or production managers. In the middle layer subsequently
palliative, awareness building, cause solving, and problem solving measures are
available as functional requirements associated with their design parameters. The
consideration of these functional requirements of the second layer is tactical in nature
and refers to middle management regarding lean responsibility. Depending on company
this can be Hanchos or foremen. In the lowest layer, specific functional requirements
are summarized addressing operational staff in the first place. Figure 2 summarizes these relationships.
Main requirement
Lean method
Cause-solving measure
Problem- solving measure Awareness-
building measure Palliative
measure
main problem: ___________________________
main cause: ___________________________
main symptom: ___________________________
to p m an ag em en t
target group
m id dl e m an ag em en t lo w er m am ag em en t / em pl oy ee
Level of
maturity level 1 level 2 level 3 level 4
st ra te gi c ta ct ic al op er at io na l scope of decision
Design horizon
Short-term Long-term
Controlling the main problem
Minimizing the main problem
Avoidance of the main problem Understanding
the main problem
Figure 2. Structure of the diagnosis
The diagnosis provides four maturity levels. The remedy of the main symptom
can be realized by palliative or symptom-relieving measures. Through this, the main
problem is merely controlled without making any structural changes. This is also the
lowest level of maturity. To achieve the next higher level of maturity, awareness has to
be achieved for the main problem and the lean method. Here, the fundamentals of the
lean method are conveyed, which is used to fulfill the main requirement that is derived
from the main problem. The third level aims at minimization of the main problem. To
remedy the main cause, a cause-solving measure is proposed. The solving of the main
problem is possible with a problem-solving measure that can prevent the cause. This
represents the highest level of maturity.
Furthermore, the design horizon is linked closely to the maturity levels. The first maturity level measures are rather short-term ones, which can be implemented within a few days, whereas the fourth level measures are likely to be long-term.
Based on this structure the particular questions are derived. The functional requirements are formulated as questions and are made available to the relevant target groups. The design parameters are the appropriate responses or actions. The questions will be provided with standardized answers. Important in this context is the coding of the questions and answers. A four-digit code is used, which for example could be M0133. The "M" indicates that the code refers to the method, in contrast to the basic data, where a "B" is prefixed. The next two digits represent the methods that are numbered in order of sequence (see Table 1). The number 01 represents the first method standardized work processes. Depending on the layer, the following numbers are assigned either zero or more digits. The code M0100 is the question of the functional requirement of the top level. Finally, the third digit stands for the maturity level and the fourth digit for the question of the lowest layer of each maturity level. Thus, the code M0130 is the question for the third maturity level of the functional requirement of the second layer and the code M0133 for the question of the functional requirement of the third maturity level of the third layer.
The systematically derived method answers as design parameters of the corresponding functional requirement (=method question) have on the lowest layer influences on functional requirements of the same maturity level of other methods.
Based on the type of influence it has to be distinguished that the answers and design
parameters of the first maturity level are merely to be considered when analyzing other
functional requirements of the same maturity level of the same layer. The ones of higher
maturity levels actively support other functional requirements of the same maturity level
on the same layer. Thus, influencing design parameters of functional requirements of other methods of the lowest maturity level will simply be listed without a call for implementation. This is due to the fact that the first level is a mere mapping of the current state with widely used emergency measures in industry which have to be replaced by measures of higher levels. The listing of such design parameters gives a first indication of the interdependence of even such emergency measures. In the output of the results of the higher levels, however, the design parameters of the functional requirements of other methods are mentioned as supportive measures for the considered method to be taken into account in the implementation of the design parameter of this considered method in order to exploit the full potential of the functional requirement.
The comprehensive analysis of influence of all design parameters on other functional requirements is done for all basic lean methods.
The functional requirements will be displayed as questions. These can be open, closed or semi-closed. Open questions give no answers, whereas semi-closed questions specify several finite answers. Finally, closed questions include answers which can refer to decision, evaluation, or trend. For the latter a three-step scale has been used which is ordinally scaled (e.g. from unsystematic to systematic). For the diagnosis open questions are omitted, and semi-closed and closed questions will be asked. For a standardized evaluation certain categories of response with well-defined response alternatives are used, e.g. systematic, regular, or frequent. All questions can be answered with at least one answer in each category. The coding of the answer default is done with the values 1, 2, and 3, respectively from negative to positive. For example, the answer defaults of the answer category “systematic” are coded with a "1" for
"unsystematic" and with a "3" for "systematic". These values are of fundamental
importance for the evaluation.
For questions with more than one response category a cumulative coding of answers is necessary, which will be used in the evaluation of the correlation with basic data as well as with other methods. Generally, the cumulative value of answers range between n and 3n, where n is the number of different response categories. So, for each number of different response categories cumulative intermediate values are developed.
The answering and output of results is available target-group dependent. Here, an upward integration is carried out, i.e. that only the higher layers have access to deeper layers. The top management has access to all evaluation data, whereas the middle management can only look into data of the operational staff. The operational staff has only access to its data analysis.
Therapy
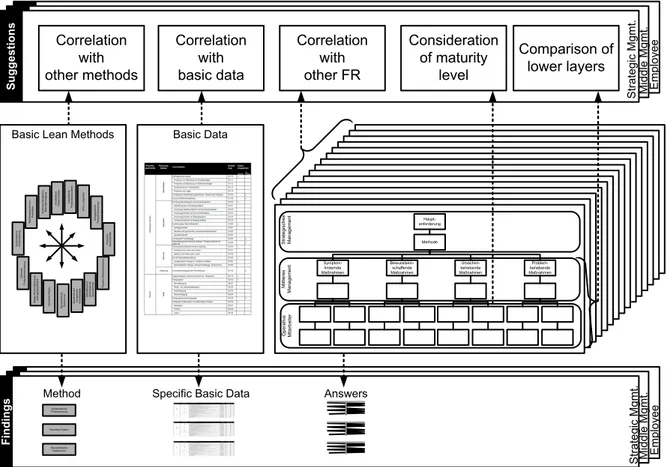
In the third stage, the evaluation of the previous analysis is done. The findings are
displayed that reflect the actual state on the basis of the answered questions. For this, all
answers have to be given structured and clearly, so that individual deviations from the
ideal or problems can quickly be detected. After completing the diagnostic questions,
the results for therapy can be seen. It consists of two components, the findings and
suggestions for improvement (see Figure 3).
V er be ss er un gs - vo rs ch lä ge V er be ss er un gs - vo rs ch lä ge B ef un d B ef un d
Haupt- anforderung
Methode
Ursachen- behebende Maßnahmen
Problem- behebende Maßnahmen Bewusstsein-
schaffende Maßnahmen Symptom-
lindernde Maßnahmen
Systematische Problemlösung
Method Specific Basic Data
F in d in g s Answers
S tr at eg ic M gm t. M id dl e M gm t. E m pl oy ee
Strategisches ManagementMittleres ManagementOperative Mitarbeiter
Correlation with basic data Correlation
with other methods
Correlation with other FR
Consideration of maturity
level
S u g g es ti o n s S tr at eg ic M gm t. M id dl e M gm t. E m pl oy ee
Schnelles Rüsten
Standardisierte Ressourcen
Comparison of lower layers
Basic Lean Methods
Systematische Problemlösung Flexibler MitarbeitereinsatzProduktive Betriebsmittel Verschwendungsarme Materialbewegung
Ziehende Produktionssteuerung Nachfragesynchrone Produktion UnmittelbareFehlerkontrolle Kleine Losgrößen Visualisierte Produktionszustände AusgeglicheneRessourcennutzung
Selbststeuernd automatisierte Betriebsmittel Normierte und transparenteArbeitsabläufe StandardisierteRessourcen
Schnelles Rüsten
Stetige Wertschöpfung ab Auftragsspezifikation