Twenty-Year Trends in Diagnosed Attention-Deficit/Hyperactivity Disorder Among US Children and Adolescents, 1997-2016
Guifeng Xu, MD; Lane Strathearn, MBBS, FRACP, PhD; Buyun Liu, MD, PhD; Binrang Yang, MD, PhD; Wei Bao, MD, PhD
Abstract
IMPORTANCEAttention-deficit/hyperactivity disorder (ADHD) is common in US children and adolescents. It is important to understand the most recent prevalence of ADHD and its long-term trends over the past decades.
OBJECTIVETo estimate the prevalence of diagnosed ADHD and 20-year trends from 1997 to 2016 among US children and adolescents using nationally representative data.
DESIGN, SETTING, AND PARTICIPANTS In this population-based, cross-sectional survey study (National Health Interview Survey), surveys were conducted annually from 1997 to 2016. A total of 186 457 children and adolescents aged 4 to 17 years from 1997 to 2016 were included in this analysis.
Data were collected through in-person household interviews with a parent or guardian. The data analysis was performed in January 2018.
MAIN OUTCOMES AND MEASURESAttention-deficit/hyperactivity disorder diagnosed by a physician or other health care professional.
RESULTSAmong the included 186 457 children and adolescents (96 017 boys [51.5%], 51 350 Hispanic [27.5%], 91 374 non-Hispanic white [49.0%], 28 808 non-Hispanic black [15.5%], 14 925 non-Hispanic other race [8.0%]), 14 704 children and adolescents (7.9%; 10 536 boys [71.7%], 2497 Hispanic [17.0%], 9010 non-Hispanic white [61.3%], 2328 non-Hispanic black [15.8%], and 869 non-Hispanic other race [5.9%]) were reported to have ever been diagnosed with ADHD. The weighted prevalence of diagnosed ADHD was 10.2% (95% CI, 9.6%-10.8%) in 2015-2016. There were significant sex and racial/ethnic disparities in the prevalence of diagnosed ADHD. The prevalence was 14.0% (95% CI, 13.1%-15.0%) in boys and 6.3% (95% CI, 5.6%-7.0%) in girls, 6.1% (95% CI,
5.2%-7.0%) in Hispanic individuals, 12.0% (95% CI, 11.1%-12.9%) in non-Hispanic white individuals, and 12.8% (95% CI, 11.0%-14.5%) in non-Hispanic black individuals. Over the 20-year period, the estimated prevalence of diagnosed ADHD in US children and adolescents increased from 6.1% in 1997-1998 to 10.2% in 2015-2016 (Pfor trend <.001). All subgroups by age, sex, race/ethnicity, family income, and geographic regions showed a significant increase in the prevalence from 1997-1998 to 2015-2016.
CONCLUSIONS AND RELEVANCE This study’s findings suggest that among US children and adolescents, the estimated prevalence of diagnosed ADHD increased significantly between 1997- 1998 and 2015-2016. This study suggests that additional research is needed to better understand the cause of this apparent rise in prevalence.
JAMA Network Open.2018;1(4):e181471. doi:10.1001/jamanetworkopen.2018.1471
Key Points
QuestionWhat are the long-term trends in prevalence of attention- deficit/hyperactivity disorder among US children and adolescents over the past 2 decades?
FindingsIn this study of data from 186 457 children and adolescents aged 4 to 17 years from the National Health Interview Survey, a nationwide, population-based, cross-sectional survey conducted annually from 1997 to 2016, the estimated prevalence of diagnosed attention-deficit/
hyperactivity disorder in US children and adolescents increased from 6.1% in 1997-1998 to 10.2% in 2015-2016.
MeaningAmong US children and adolescents, the estimated prevalence of diagnosed attention-deficit/
hyperactivity disorder increased significantly between 1997 and 2016.
+
Invited CommentaryAuthor affiliations and article information are listed at the end of this article.
Open Access.This is an open access article distributed under the terms of the CC-BY License.
Introduction
Attention-deficit/hyperactivity disorder (ADHD) is a childhood-onset neuropsychiatric disorder characterized by persistent and impairing inattention, hyperactivity, and impulsivity.1,2The symptoms of ADHD often persist into adulthood. Early comorbidities concurrent with ADHD may include tic disorder, anxiety disorder, autism spectrum disorder, communication and specific learning or motor disorders (eg, reading disability, developmental coordination disorder), and intellectual disability.1Long-term follow-up studies from childhood to adulthood found that children with ADHD, compared with those without ADHD, were more impaired in psychosocial, educational, and neuropsychological functioning3and had higher risks for antisocial disorders, major depression, and anxiety disorders as adults.4
The American Psychiatric Association states in theDiagnostic and Statistical Manual of Mental Disorders, Fifth Editionthat 5% of children have ADHD, based on previous worldwide estimates in earlier years.5,6The prevalence of ADHD varies across different countries, with a significantly higher prevalence in the United States than in European countries.7Moreover, the prevalence of ADHD has changed over time. Several previous studies in the United States have shown an increase in ADHD prevalence over the past years.8-19For example, an analysis of the National Health Interview Survey (NHIS) reported a 33% increase in ADHD prevalence from 1997-1999 (5.7%) to 2006-2008 (7.6%) among children and adolescents aged 3 to 17 years.8Similarly, the National Survey of Children’s Health showed a 42% increase between 2003 and 2011 in the prevalence of diagnosed ADHD among children and adolescents aged 4 to 17 years.9
Information about the current prevalence of ADHD and its long-term trends over the past decades is needed to inform future research, clinical care, and policy decision making on ADHD.
Therefore, we analyzed nationally representative data to estimate the most recent prevalence of ADHD diagnosis among US children and adolescents and the 20-year trends from 1997 to 2016.
Methods
Study Population
The NHIS is a leading national health survey in the United States.20It is conducted annually by the National Center for Health Statistics at the Centers for Disease Control and Prevention. The NHIS is composed of a series of nationally representative cross-sectional surveys. With a large sample size and a relatively high response rate, the NHIS has become the principal source of information on the health of the civilian, noninstitutionalized household population of the United States.21The NHIS survey methodologic reporting is consistent with the reporting standards by the American Association for Public Opinion Research.22Annual sample size of the NHIS is about 35 000 households containing approximately 87 500 persons. In NHIS 1997-2016, the total household response rate ranged from 67.9% to 91.8% and conditional response rate for the sample child component ranged from 85.6% to 93.3%. The NHIS survey was approved by the National Center for Health Statistics Research Ethics Review Board. All respondents provided informed informed verbal consent prior to participation. The University of Iowa Institutional Review Board determined the present study was exempt from approval given the use of deidentified data. This study followed the American Association for Public Opinion Research (AAPOR) reporting guideline.
Data Collection
The NHIS collected data on a variety of health topics through in-person household interviews. For each interviewed family in the household, 1 sample child, if any, was randomly selected by a computer program.20Information about the sample child was collected by interviewing an adult, usually a parent, who was knowledgeable about the child's health.
From 1997 to 2016, respondents were asked, “Has a doctor or health professional ever told you that [the sample child] had attention-deficit/hyperactivity disorder (ADHD) or attention-deficit
disorder (ADD)?” Approximately 99.8% of the participants responded to this question. The respondents in the 2016 survey were further asked, “Does [the sample child] currently have attention-deficit/hyperactivity disorder (ADHD) or attention-deficit disorder (ADD)?” Demographic data, such as age, sex, race/ethnicity, family income, and geographic region, were collected using a standardized questionnaire during the interview. Race and Hispanic ethnicity were self-reported and classified based on the 1997 Office of Management and Budget Standards. Family income levels were classified according to the ratio of family income to federal poverty level lower than 1.0, 1.0 to 1.9, 2.0 to 3.9, and 4.0 or higher. Data analysis was performed in January 2018.
Statistical Analysis
All eligible children and adolescents aged 4 to 17 years who participated in the NHIS were included in the present study. Only 0.2% of participants had missing information on ADHD diagnosis and were therefore excluded. We restricted the age range to 4 to 17 years because the clinical guidelines of the American Academy of Pediatrics recommended to initiate an evaluation for ADHD in children aged 4 years or older.23
We estimated the prevalence estimates with survey weights to account for unequal
probabilities of selection, oversampling, and nonresponse in the survey. We also used survey design variables about strata and primary sampling units for each survey cycle. In this study, we combined each 2-year period (eg, 1997 and 1998) as 1 survey cycle (eg, cycle 1997-1998).Pvalues for overall differences across strata were calculated using χ2tests. Trends in the prevalence over time were tested using a weighted logistic regression model, which included survey cycle as a continuous variable and adjusted for age, sex, and race/ethnicity. To determine whether the secular trends differ across strata, interaction analyses were performed by including multiplicative terms of each strata variable with survey cycle in the aforementioned logistic regression models. All analyses were conducted using survey procedures in SAS, version 9.4 (SAS Institute). Two-sidedP< .05 was considered statistically significant.
Results
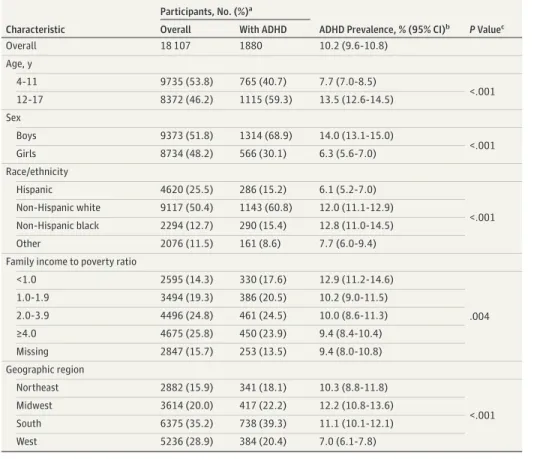
Prevalence of Diagnosed ADHD Among US Children and Adolescents in 2015-2016 Among the included 18 107 children and adolescents aged 4 to 17 years (9373 boys [51.8%], 4620 Hispanic [25.5%], 9117 non-Hispanic white [50.4%], 2294 non-Hispanic black [12.7%], and 2076 non-Hispanic other race [11.5%]) in 2015-2016, 1880 children and adolescents (1314 boys [69.9%], 286 Hispanic [15.2%], 1143 non-Hispanic white [60.8%], 290 non-Hispanic black [15.4%], and 161 non-Hispanic other race [8.6%]) were reported to have ever been diagnosed with ADHD. The weighted prevalence of ADHD diagnosis was 10.2% (95% CI, 9.6%-10.8%) in 2015-2016 (Table 1).
There were significant differences in the prevalence according to age, sex, race/ethnicity, family income, and geographic region. The prevalence was 7.7% (95% CI, 7.0%-8.5%) in children aged 4 to 11 years, 13.5% (95% CI, 12.6%-14.5%) in adolescents aged 12 to 17 years, 14.0% (95% CI,
13.1%-15.0%) in boys, 6.3% (95% CI, 5.6%-7.0%) in girls, 6.1% (95% CI, 5.2%-7.0%) in Hispanic individuals, 12.0% (95% CI, 11.1%-12.9%) in non-Hispanic white individuals, 12.8% (95% CI, 11.0%-14.5%) in non-Hispanic black individuals, 10.3% (95% CI, 8.8%-11.8%) in those living in the Northeast, 12.2% (95% CI, 10.8%-13.6%) of those in the Midwest, 11.1% (95% CI, 10.1%-12.1%) of respondents in the South, and 7.0% (95% CI, 6.1%-7.8%) of those in the West (Table 1).
Trends in Diagnosed ADHD in US Children and Adolescents From 1997 to 2016 To estimate the 20-year trends in diagnosed ADHD from 1997 to 2016, we included 186 457 children and adolescents aged 4 to 17 years (96 017 boys [51.5%], 51 350 Hispanic [27.5%], 91 374
non-Hispanic white [49.0%], 28 808 non-Hispanic black [15.5%], and 14 925 non-Hispanic other race [8.0%]). Among them, 14 704 children and adolescents (7.9%; 10 536 boys [71.7%], 2497
Hispanic [17.0%], 9010 non-Hispanic white [61.3%], 2328 non-Hispanic black [15.8%], and 869 non-Hispanic other race [5.9%]) were reported to have ever been diagnosed with ADHD.
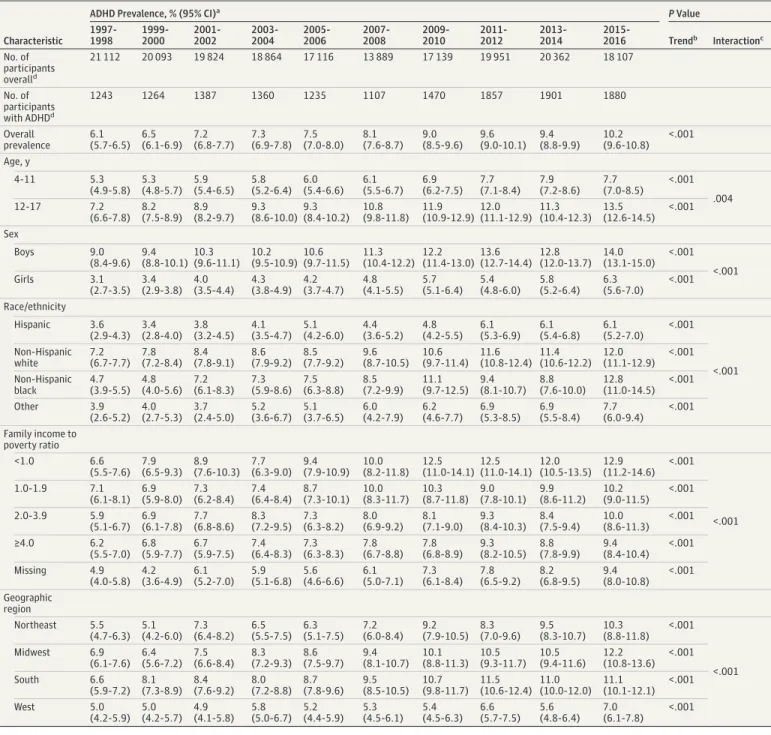
The mean age of the participants over the period was almost identical, ranging from 10.6 to 10.9 years. The estimated prevalence of diagnosed ADHD increased from 6.1% in 1997-1998 to 10.2% in 2015-2016 (Pfor trend <.001) (Figure). All subgroups evaluated showed a significant increase in the prevalence from 1997-1998 to 2015-2016 (Table 2).
Table 1. Prevalence of Diagnosed ADHD in US Children and Adolescents Aged 4 to 17 Years, 2015-2016
Characteristic
Participants, No. (%)a
ADHD Prevalence, % (95% CI)b PValuec Overall With ADHD
Overall 18 107 1880 10.2 (9.6-10.8)
Age, y
4-11 9735 (53.8) 765 (40.7) 7.7 (7.0-8.5)
<.001
12-17 8372 (46.2) 1115 (59.3) 13.5 (12.6-14.5)
Sex
Boys 9373 (51.8) 1314 (68.9) 14.0 (13.1-15.0)
<.001
Girls 8734 (48.2) 566 (30.1) 6.3 (5.6-7.0)
Race/ethnicity
Hispanic 4620 (25.5) 286 (15.2) 6.1 (5.2-7.0)
<.001 Non-Hispanic white 9117 (50.4) 1143 (60.8) 12.0 (11.1-12.9)
Non-Hispanic black 2294 (12.7) 290 (15.4) 12.8 (11.0-14.5)
Other 2076 (11.5) 161 (8.6) 7.7 (6.0-9.4)
Family income to poverty ratio
<1.0 2595 (14.3) 330 (17.6) 12.9 (11.2-14.6)
.004
1.0-1.9 3494 (19.3) 386 (20.5) 10.2 (9.0-11.5)
2.0-3.9 4496 (24.8) 461 (24.5) 10.0 (8.6-11.3)
≥4.0 4675 (25.8) 450 (23.9) 9.4 (8.4-10.4)
Missing 2847 (15.7) 253 (13.5) 9.4 (8.0-10.8)
Geographic region
Northeast 2882 (15.9) 341 (18.1) 10.3 (8.8-11.8)
<.001
Midwest 3614 (20.0) 417 (22.2) 12.2 (10.8-13.6)
South 6375 (35.2) 738 (39.3) 11.1 (10.1-12.1)
West 5236 (28.9) 384 (20.4) 7.0 (6.1-7.8)
Abbreviation: ADHD, attention-deficit/hyperactivity disorder.
aThe numbers of participants overall and with ADHD were unweighted.
bPrevalence estimates were weighted.
cPvalues for overall differences in prevalence by stratum.
Figure. Prevalence of Diagnosed Attention-Deficit/Hyperactivity Disorder (ADHD) in US Children and Adolescents, 1997-2016
0
1999-2000
20 093
2001-2002
19 824
2003-2004
18 864
2005-2006
17 116
2007-2008
13 889
2009-2010
17 139
2011-2012
19 951
2013-2014
20 362
2015-2016
18 107 12
8 10
Prevalence of ADHD, %
Year 6
4
2
1997-1998
21 112 No. of participants
Prevalence estimates with 95% CIs (error bars) were weighted.P< .001 for trend was calculated using a weighted logistic regression model, which included survey cycle as a continuous variable and adjusted for age, sex, and race/ethnicity.
Discussion
In a nationally representative population, we estimated that the prevalence of diagnosed ADHD among US children and adolescents was 10.2% in 2016. The prevalence differed significantly by age, sex, race/ethnicity, family income, and geographic region. Similar to our findings, several previous studies also reported sex8-14,19and racial/ethnic differences15,24-26in the prevalence of ADHD.
Table 2. Trends in the Prevalence of Diagnosed ADHD in US Children and Adolescents Aged 4 to 17 Years, 1997-2016
Characteristic
ADHD Prevalence, % (95% CI)a PValue
1997- 1998
1999- 2000
2001- 2002
2003- 2004
2005- 2006
2007- 2008
2009- 2010
2011- 2012
2013- 2014
2015-
2016 Trendb Interactionc No. of
participants overalld
21 112 20 093 19 824 18 864 17 116 13 889 17 139 19 951 20 362 18 107
No. of participants with ADHDd
1243 1264 1387 1360 1235 1107 1470 1857 1901 1880
Overall prevalence
6.1 (5.7-6.5)
6.5 (6.1-6.9)
7.2 (6.8-7.7)
7.3 (6.9-7.8)
7.5 (7.0-8.0)
8.1 (7.6-8.7)
9.0 (8.5-9.6)
9.6 (9.0-10.1)
9.4 (8.8-9.9)
10.2 (9.6-10.8)
<.001 Age, y
4-11 5.3
(4.9-5.8) 5.3 (4.8-5.7)
5.9 (5.4-6.5)
5.8 (5.2-6.4)
6.0 (5.4-6.6)
6.1 (5.5-6.7)
6.9 (6.2-7.5)
7.7 (7.1-8.4)
7.9 (7.2-8.6)
7.7 (7.0-8.5)
<.001 12-17 7.2 .004
(6.6-7.8) 8.2 (7.5-8.9)
8.9 (8.2-9.7)
9.3 (8.6-10.0)
9.3 (8.4-10.2)
10.8 (9.8-11.8)
11.9 (10.9-12.9)
12.0 (11.1-12.9)
11.3 (10.4-12.3)
13.5 (12.6-14.5)
<.001 Sex
Boys 9.0
(8.4-9.6) 9.4 (8.8-10.1)
10.3 (9.6-11.1)
10.2 (9.5-10.9)
10.6 (9.7-11.5)
11.3 (10.4-12.2)
12.2 (11.4-13.0)
13.6 (12.7-14.4)
12.8 (12.0-13.7)
14.0 (13.1-15.0)
<.001
<.001
Girls 3.1
(2.7-3.5) 3.4 (2.9-3.8)
4.0 (3.5-4.4)
4.3 (3.8-4.9)
4.2 (3.7-4.7)
4.8 (4.1-5.5)
5.7 (5.1-6.4)
5.4 (4.8-6.0)
5.8 (5.2-6.4)
6.3 (5.6-7.0)
<.001 Race/ethnicity
Hispanic 3.6
(2.9-4.3) 3.4 (2.8-4.0)
3.8 (3.2-4.5)
4.1 (3.5-4.7)
5.1 (4.2-6.0)
4.4 (3.6-5.2)
4.8 (4.2-5.5)
6.1 (5.3-6.9)
6.1 (5.4-6.8)
6.1 (5.2-7.0)
<.001
<.001 Non-Hispanic
white
7.2 (6.7-7.7)
7.8 (7.2-8.4)
8.4 (7.8-9.1)
8.6 (7.9-9.2)
8.5 (7.7-9.2)
9.6 (8.7-10.5)
10.6 (9.7-11.4)
11.6 (10.8-12.4)
11.4 (10.6-12.2)
12.0 (11.1-12.9)
<.001 Non-Hispanic
black
4.7 (3.9-5.5)
4.8 (4.0-5.6)
7.2 (6.1-8.3)
7.3 (5.9-8.6)
7.5 (6.3-8.8)
8.5 (7.2-9.9)
11.1 (9.7-12.5)
9.4 (8.1-10.7)
8.8 (7.6-10.0)
12.8 (11.0-14.5)
<.001
Other 3.9
(2.6-5.2) 4.0 (2.7-5.3)
3.7 (2.4-5.0)
5.2 (3.6-6.7)
5.1 (3.7-6.5)
6.0 (4.2-7.9)
6.2 (4.6-7.7)
6.9 (5.3-8.5)
6.9 (5.5-8.4)
7.7 (6.0-9.4)
<.001 Family income to
poverty ratio
<1.0 6.6
(5.5-7.6) 7.9 (6.5-9.3)
8.9 (7.6-10.3)
7.7 (6.3-9.0)
9.4 (7.9-10.9)
10.0 (8.2-11.8)
12.5 (11.0-14.1)
12.5 (11.0-14.1)
12.0 (10.5-13.5)
12.9 (11.2-14.6)
<.001
<.001
1.0-1.9 7.1
(6.1-8.1) 6.9 (5.9-8.0)
7.3 (6.2-8.4)
7.4 (6.4-8.4)
8.7 (7.3-10.1)
10.0 (8.3-11.7)
10.3 (8.7-11.8)
9.0 (7.8-10.1)
9.9 (8.6-11.2)
10.2 (9.0-11.5)
<.001
2.0-3.9 5.9
(5.1-6.7) 6.9 (6.1-7.8)
7.7 (6.8-8.6)
8.3 (7.2-9.5)
7.3 (6.3-8.2)
8.0 (6.9-9.2)
8.1 (7.1-9.0)
9.3 (8.4-10.3)
8.4 (7.5-9.4)
10.0 (8.6-11.3)
<.001
≥4.0 6.2
(5.5-7.0) 6.8 (5.9-7.7)
6.7 (5.9-7.5)
7.4 (6.4-8.3)
7.3 (6.3-8.3)
7.8 (6.7-8.8)
7.8 (6.8-8.9)
9.3 (8.2-10.5)
8.8 (7.8-9.9)
9.4 (8.4-10.4)
<.001
Missing 4.9
(4.0-5.8) 4.2 (3.6-4.9)
6.1 (5.2-7.0)
5.9 (5.1-6.8)
5.6 (4.6-6.6)
6.1 (5.0-7.1)
7.3 (6.1-8.4)
7.8 (6.5-9.2)
8.2 (6.8-9.5)
9.4 (8.0-10.8)
<.001 Geographic
region
Northeast 5.5 (4.7-6.3)
5.1 (4.2-6.0)
7.3 (6.4-8.2)
6.5 (5.5-7.5)
6.3 (5.1-7.5)
7.2 (6.0-8.4)
9.2 (7.9-10.5)
8.3 (7.0-9.6)
9.5 (8.3-10.7)
10.3 (8.8-11.8)
<.001
<.001
Midwest 6.9
(6.1-7.6) 6.4 (5.6-7.2)
7.5 (6.6-8.4)
8.3 (7.2-9.3)
8.6 (7.5-9.7)
9.4 (8.1-10.7)
10.1 (8.8-11.3)
10.5 (9.3-11.7)
10.5 (9.4-11.6)
12.2 (10.8-13.6)
<.001
South 6.6
(5.9-7.2) 8.1 (7.3-8.9)
8.4 (7.6-9.2)
8.0 (7.2-8.8)
8.7 (7.8-9.6)
9.5 (8.5-10.5)
10.7 (9.8-11.7)
11.5 (10.6-12.4)
11.0 (10.0-12.0)
11.1 (10.1-12.1)
<.001
West 5.0
(4.2-5.9) 5.0 (4.2-5.7)
4.9 (4.1-5.8)
5.8 (5.0-6.7)
5.2 (4.4-5.9)
5.3 (4.5-6.1)
5.4 (4.5-6.3)
6.6 (5.7-7.5)
5.6 (4.8-6.4)
7.0 (6.1-7.8)
<.001
Abbreviation: ADHD, attention-deficit/hyperactivity disorder.
aPrevalence estimates were weighted.
bPvalues for trends were calculated using weighted logistic regression models, which included survey cycle as a continuous variable and adjusted for age, sex, and race/
ethnicity.
cPvalues for interaction were calculated by including multiplicative terms of each stratum variable with survey cycle in the aforementioned logistic regression models.
dThe numbers of participants overall and with ADHD were unweighted.
Over the 20-year period from 1997 to 2016, we found a significant increase in the prevalence of diagnosed ADHD from 1997-1998 to 2015-2016. We found a consistent upward trend across subgroups by age, sex, race/ethnicity, family income, and geographic regions. The temporal trends in this study were consistent with previously reported trends in ADHD prevalence among US children and adolescents during earlier years.8-15Taken together, these findings indicate a continuous increase in the prevalence of diagnosed ADHD among US children and adolescents. Previous studies conducted in the United Kingdom have also observed a significant increase in ADHD prevalence, although the prevalence estimates were substantially lower than those in the United States.2
Nonetiologic factors may partly explain the apparent increase in the prevalence of diagnosed ADHD in this study. Over the past 20 years, there have been expanded continuing medical education efforts about ADHD that enhanced physicians’ sensitivity to the diagnosis of ADHD. Changes in diagnostic criteria may also contribute to the increased number of children being diagnosed with ADHD.7In particular, changes in theDiagnostic and Statistical Manual of Mental Disorderscriteria that established the predominately inattentive presentation of ADHD led to significantly increased diagnosis in girls, who often fail to demonstrate classic hyperactive symptoms. In addition, increased public awareness, improved access to health services, and improved referral from primary care and communities to specialty mental health services may increase the likelihood of ADHD being identified on screening and diagnosis.9Increased rates of diagnosed ADHD among black and Hispanic youths might reflect increased access to care and decreased stigma in those communities for receiving an ADHD diagnosis. The execution of the Affordable Care Act may also have increased access to care in lower socioeconomic status and minority groups. There is a common perception that ADHD is overdiagnosed in the United States, but this perception was not supported by scientific evidence based on review of prevalence studies and research on the diagnostic process.27
It remains to be understood how much of the observed apparent increase in diagnosed ADHD was attributed to etiologic factors; ADHD has a genetic component with an estimated heritability of 70% to 80%.21In addition to genetic risk factors, environmental risk factors are believed to contribute to the development of ADHD.1,28Prenatal and perinatal risk factors, including preterm birth, low birth weight, maternal cigarette smoking, and maternal use of certain medications or illicit substances during pregnancy, have been associated with ADHD risk.29-31Attachment-related factors in early infancy have also been associated with ADHD in childhood.32-34Environmental
contamination, such as lead, organophosphate pesticides, and polychlorinated biphenyls exposure, during prenatal and/or postnatal periods is a possible risk factor for ADHD.30In addition, nutritional deficiencies (eg, zinc, magnesium, and polyunsaturated fatty acids) may also be implicated in the development of ADHD.1The contributions of these nongenetic and genetic risk factors to the etiologic source of ADHD, both separately and jointly, warrant further investigation.
Strengths and Limitations
This study has several strengths. First, this study was based on a nationally representative sample of the US population, which facilitates the generalization of the findings to a broader population.
Second, a large sample size with a multi-racial/ethnic diverse population was available, allowing us to assess disparities in ADHD prevalence according to population characteristics. Third, with a series of nationwide population-based cross-sectional surveys, we were able to evaluate the secular trends in ADHD prevalence over a period of observations as long as 20 years.
This study has some limitations. First, ADHD was ascertained by parent-reported physicians’
diagnosis, which may be subject to misreporting and recall bias. Second, we did not know whether the children and adolescents with a diagnosis of ADHD still had ADHD at the time of the survey across the survey years except in NHIS 2016. Previous studies have shown that the core symptoms of ADHD tend to decline with age, but inattentive features of ADHD are more likely to persist.1In NHIS 2016, we found that 85% of children and adolescents with a history of ADHD diagnosis were reported as currently having ADHD, which was similar to the number reported in a previous study.9
Conclusions
Among US children and adolescents aged 4 to 17 years, the estimated prevalence of diagnosed ADHD was 10.2% in 2015-2016, representing a significant increase in prevalence from 1997-1998. This continued upward trend in diagnosed ADHD among children and adolescents points to the need to better understand potentially modifiable environmental risk factors, as well as provide adequate resources for the diagnosis and treatment of affected individuals in the future.
ARTICLE INFORMATION
Accepted for Publication:June 4, 2018.
Published:August 31, 2018. doi:10.1001/jamanetworkopen.2018.1471
Open Access:This is an open access article distributed under the terms of theCC-BY License. © 2018 Xu G et al.
JAMA Network Open.
Corresponding Author:Wei Bao, MD, PhD, Department of Epidemiology, College of Public Health, University of Iowa, 145 N Riverside Dr, Room S431 CPHB, Iowa City, IA 52242 (wei-bao@uiowa.edu).
Author Affiliations:Center for Disabilities and Development, University of Iowa Stead Family Children’s Hospital, Iowa City (Xu, Strathearn, Yang); Department of Epidemiology, College of Public Health, University of Iowa, Iowa City (Xu, Liu, Bao); Division of Developmental and Behavioral Pediatrics, Stead Family Department of Pediatrics, University of Iowa Carver College of Medicine, Iowa City (Strathearn); Department of Developmental and Behavioral Pediatrics, Shenzhen Children’s Hospital, Shenzhen, Guangdong, China (Yang).
Author Contributions:Dr Bao had full access to all of the data in the study and takes responsibility for the integrity of the data and the accuracy of the data analysis.
Concept and design:Bao.
Acquisition, analysis, or interpretation of data:All authors.
Drafting of the manuscript:Xu.
Critical revision of the manuscript for important intellectual content:Strathearn, Liu, Yang, Bao.
Statistical analysis:Xu.
Administrative, technical, or material support:Bao.
Supervision:Strathearn, Bao.
Conflict of Interest Disclosures:None reported.
REFERENCES
1. Thapar A, Cooper M. Attention deficit hyperactivity disorder.Lancet. 2016;387(10024):1240-1250. doi:10.1016/
S0140-6736(15)00238-X
2. Verkuijl N, Perkins M, Fazel M. Childhood attention-deficit/hyperactivity disorder.BMJ. 2015;350:h2168. doi:
10.1136/bmj.h2168
3. Biederman J, Petty CR, Woodworth KY, Lomedico A, Hyder LL, Faraone SV. Adult outcome of attention-deficit/
hyperactivity disorder: a controlled 16-year follow-up study.J Clin Psychiatry. 2012;73(7):941-950. doi:10.4088/
JCP.11m07529
4. Biederman J, Petty CR, Monuteaux MC, et al. Adult psychiatric outcomes of girls with attention deficit hyperactivity disorder: 11-year follow-up in a longitudinal case-control study.Am J Psychiatry. 2010;167(4):
409-417. doi:10.1176/appi.ajp.2009.09050736
5. American Psychiatric Association.Diagnostic and Statistical Manual of Mental Disorders. 5th ed. Washington DC:
American Psychiatric Association; 2013.
6. Polanczyk G, de Lima MS, Horta BL, Biederman J, Rohde LA. The worldwide prevalence of ADHD: a systematic review and metaregression analysis.Am J Psychiatry. 2007;164(6):942-948. doi:10.1176/ajp.2007.164.6.942 7. Thomas R, Sanders S, Doust J, Beller E, Glasziou P. Prevalence of attention-deficit/hyperactivity disorder:
a systematic review and meta-analysis.Pediatrics. 2015;135(4):e994-e1001. doi:10.1542/peds.2014-3482 8. Boyle CA, Boulet S, Schieve LA, et al. Trends in the prevalence of developmental disabilities in US children, 1997- 2008.Pediatrics. 2011;127(6):1034-1042. doi:10.1542/peds.2010-2989
9. Visser SN, Danielson ML, Bitsko RH, et al. Trends in the parent-report of health care provider–diagnosed and medicated attention-deficit/hyperactivity disorder: United States, 2003-2011.J Am Acad Child Adolesc Psychiatry.
2014;53(1):34-46. doi:10.1016/j.jaac.2013.09.001
10. Froehlich TE, Lanphear BP, Epstein JN, Barbaresi WJ, Katusic SK, Kahn RS. Prevalence, recognition, and treatment of attention-deficit/hyperactivity disorder in a national sample of US children.Arch Pediatr Adolesc Med. 2007;161(9):857-864. doi:10.1001/archpedi.161.9.857
11. Getahun D, Jacobsen SJ, Fassett MJ, Chen W, Demissie K, Rhoads GG. Recent trends in childhood attention- deficit/hyperactivity disorder.JAMA Pediatr. 2013;167(3):282-288. doi:10.1001/2013.jamapediatrics.401 12. Akinbami LJ, Liu X, Pastor PN, Reuben CA. Attention deficit hyperactivity disorder among children aged 5-17 years in the United States, 1998-2009.NCHS Data Brief. 2011;(70):1-8.
13. Pastor PN, Reuben CA. Diagnosed attention deficit hyperactivity disorder and learning disability: United States, 2004-2006.Vital Health Stat 10. 2008;(237):1-14.
14. Pastor P, Reuben C, Duran C, Hawkins L. Association between diagnosed ADHD and selected characteristics among children aged 4-17 years: United States, 2011-2013.NCHS Data Brief. 2015;(201):201.
15. Pastor P, Duran C, Reuben C. QuickStats: percentage of children and adolescents aged 5-17 years with diagnosed attention-deficit/hyperactivity disorder (ADHD), by race and Hispanic ethnicity—National Health Interview Survey, United States, 1997-2014.MMWR Morb Mortal Wkly Rep. 2015;64(33):925. doi:10.15585/mmwr.
mm6433a11
16. Centers for Disease Control and Prevention. Increasing prevalence of parent-reported attention-deficit/
hyperactivity disorder among children—United States, 2003 and 2007.MMWR Morb Mortal Wkly Rep. 2010;59 (44):1439-1443.
17. Danielson ML, Visser SN, Gleason MM, Peacock G, Claussen AH, Blumberg SJ. A national profile of attention- deficit hyperactivity disorder diagnosis and treatment among US children aged 2 to 5 years.J Dev Behav Pediatr.
2017;38(7):455-464. doi:10.1097/DBP.0000000000000477
18. Visser SN, Danielson ML, Wolraich ML, et al. Vital signs: national and state-specific patterns of attention deficit/hyperactivity disorder treatment among insured children aged 2-5 years—United States, 2008-2014.
MMWR Morb Mortal Wkly Rep. 2016;65(17):443-450. doi:10.15585/mmwr.mm6517e1
19. Duran C. QuickStats: percentage of children and teens aged 4-17 years ever diagnosed with attention-deficit/
hyperactivity disorder (ADHD), by sex and urbanization of county of residence—National Health Interview Survey, 2013-2015.MMWR Morb Mortal Wkly Rep. 2017;66(23):625. doi:10.15585/mmwr.mm6623a7
20. Parsons VL, Moriarity C, Jonas K, Moore TF, Davis KE, Tompkins L. Design and estimation for the National Health Interview Survey, 2006-2015.Vital Health Stat 2. 2014;(165):1-53.
21. Adams PF, Kirzinger WK, Martinez M. Summary health statistics for the US population: National Health Interview Survey, 2012.Vital Health Stat 10. 2013;(259):1-95.
22. American Association for Public Opinion Research. AAPOR Standard Definitions.https://www.aapor.org/
Publications-Media/AAPOR-Journals/Standard-Definitions.aspx. Accessed May 10th, 2018.
23. Wolraich M, Brown L, Brown RT, et al; Subcommittee on Attention-Deficit/Hyperactivity Disorder; Steering Committee on Quality Improvement and Management. ADHD: clinical practice guideline for the diagnosis, evaluation, and treatment of attention-deficit/hyperactivity disorder in children and adolescents.Pediatrics. 2011;
128(5):1007-1022. doi:10.1542/peds.2011-2654
24. Collins KP, Cleary SD. Racial and ethnic disparities in parent-reported diagnosis of ADHD: National Survey of Children’s Health (2003, 2007, and 2011).J Clin Psychiatry. 2016;77(1):52-59. doi:10.4088/JCP.14m09364 25. Morgan PL, Staff J, Hillemeier MM, Farkas G, Maczuga S. Racial and ethnic disparities in ADHD diagnosis from kindergarten to eighth grade.Pediatrics. 2013;132(1):85-93. doi:10.1542/peds.2012-2390
26. Morgan PL, Hillemeier MM, Farkas G, Maczuga S. Racial/ethnic disparities in ADHD diagnosis by kindergarten entry.J Child Psychol Psychiatry. 2014;55(8):905-913. doi:10.1111/jcpp.12204
27. Sciutto MJ, Eisenberg M. Evaluating the evidence for and against the overdiagnosis of ADHD.J Atten Disord.
2007;11(2):106-113. doi:10.1177/1087054707300094
28. Faraone SV, Asherson P, Banaschewski T, et al. Attention-deficit/hyperactivity disorder.Nat Rev Dis Primers.
2015;1:15020. doi:10.1038/nrdp.2015.20
29. Thapar A, Cooper M, Jefferies R, Stergiakouli E. What causes attention deficit hyperactivity disorder?Arch Dis Child. 2012;97(3):260-265. doi:10.1136/archdischild-2011-300482
30. Thapar A, Cooper M, Eyre O, Langley K. What have we learnt about the causes of ADHD?J Child Psychol Psychiatry. 2013;54(1):3-16. doi:10.1111/j.1469-7610.2012.02611.x
31. Sciberras E, Mulraney M, Silva D, Coghill D. Prenatal risk factors and the etiology of ADHD—review of existing evidence.Curr Psychiatry Rep. 2017;19(1):1. doi:10.1007/s11920-017-0753-2
32. Fearon RM, Belsky J. Attachment and attention: protection in relation to gender and cumulative social- contextual adversity.Child Dev. 2004;75(6):1677-1693. doi:10.1111/j.1467-8624.2004.00809.x
33. Scholtens S, Rydell AM, Bohlin G, Thorell LB. ADHD symptoms and attachment representations: considering the role of conduct problems, cognitive deficits and narrative responses in non-attachment-related story stems.
J Abnorm Child Psychol. 2014;42(6):1033-1042. doi:10.1007/s10802-014-9854-0
34. Kissgen R, Franke S. An attachment research perspective on ADHD.Neuropsychiatr. 2016;30(2):63-68. doi:
10.1007/s40211-016-0182-1