Roland GUNESCH, Landau
Understanding Mathematical Chaos: Impressions from an Experimental Attractor Competition
Abstract and overview
We have observed very complex mathematics, namely attractors of com- plex Dynamical Systems, being approached experimentally.
German universities are working towards an increased mathematics aware- ness among schools and the general public. Particularly effective is the or- ganization of a yearly Mathematics Day (“Tag der Mathematik”) at univer- sities where classes of high school students participate in mathematics competitions and enjoy various other mathematical exhibitions. At the University of Hamburg such Mathematics Days have been held during the years 2008 through 2010, and each time the author was involved with or- ganizing an “experimental attractor competition”. This is a hands-on explo- ration opportunity where school students (as well as the interested public) can experiment with mathematics, in particular Dynamical Systems, attrac- tors and their graphical representations. The participants included practical- ly all ages, but most of them were between 7 and 20 years old due to the school-focused nature of the events.
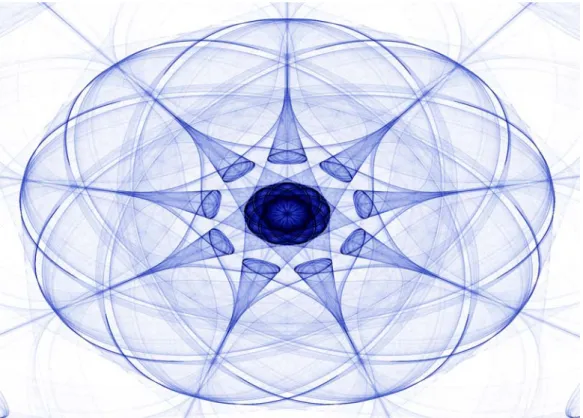
Illustration 1: Attractor with symmetry (chosen by Suzanne Linder)
Dynamical Systems, orbits, and computer images of chaotic attractors We (Martin Kunkel, Reiner Lauterbach and the author) have created soft- ware that plots the orbit of certain mappings in the complex plane. The formula of the mapping itself is not actually the object to be studied. It is a fairly simple quotient of two complex-valued polynomials with the degree of the denominator large enough so that the trajectory of any point near the origin stays “on the computer screen”. There is no need for the users (henceforth “participants”) to know the formula, and it would be mislead- ing since high school students may associate polynomials with the need to
“solve them” (find zeroes) whereas here we have something entirely differ- ent in mind. What is visible to users of this software are various parameters of the mapping. What we want to investigate are orbits of the mapping: If z is a point in the complex plane (“on the computer screen”) and the mapping is called f, then the so-called trajectory or orbit of the point z under f is the sequence of points
z, f(z), f(f(z)), f(f(f(z))), …
This is an infinite sequence, but a (sufficiently long) part at the beginning will show its geometric structure. It is easy to understand f and to compute f(z) for one single point z, but the whole trajectory of z is very complicated.
The image above shows how it can be very convoluted and intricate. This is the image of an attractor. (Mathematically speaking, the trajectory is on- ly an approximation of the actual attractor, usually “similarly looking”.) Such a mapping, a Dynamical System, can be (and in this case is) chaotic, meaning that the orbit and hence the shape of the attractor is difficult to predict theoretically (but easy to compute). Most of the resulting images have never before been seen by any human being in the world. This makes the exploration particularly exciting. The rest of this article can be unders- tood without the preceding mathematical explanation.
To increase the visual appeal of the resulting attractors, we constructed the mapping so that the resulting images are symmetric. The participant can choose between several rotational symmetries, e.g. by 1/3 of a full rotation.
The mapping f depends on several parameters which change the shape and appearance of the attractor. The participants control these parameters.
We had set up many computers (PCs, monitor, mouse, keyboard) in a pub- lic space, each running our software where participants control several pa- rameters by simply clicking on appropriate control buttons, and our soft- ware would automatically create an image of the resulting attractor.
Observations during the experimental phase of attractor exploration We then left the participants to explore and experiment on their own and in the process create images of different attractors, motivated solely by their own curiosity. We did also announce that people who would create the
“most interesting” or “most beautiful” images would at the end of the day win a prize, and created an awards ceremony for this. Watching the partici- pants explore these attractors offered some, possibly very interesting, in- sights into mathematics teaching and learning.
As already explained, the resulting images can be very beautiful, yet cannot really be predicted without the help of a computer because the underlying mathematics is too difficult. The usual procedures and algorithms that school students have learned and practiced will not work: There is no
“standard path” to take to find out what the attractors will look like; how- ever, experiment and exploration work very well in this case.
Note that the whole event focuses on mathematical exploration, and we tried to maximize student involvement, as opposed to merely creating a less appealing test where we could measure more precisely.
This study observed what particular procedures the participants used to create interesting attractor images, the length of their attention span while exploring, how the participants reacted to surprising new discoveries, how
“prolific” the participants were, whether the resulting images would show a particular “personal style” of the creator (which actually turned out to be the case), and how the participants organized themselves as teams or sole explorers. The observational findings are as follows:
Procedures: Most participants used the easiest-to-reach controls in the graphical user interface of our software, which were sliders and arrow but- tons that can be clicked with the mouse. There are also buttons for prede- fined values. Some participants were more meticulous, carefully writing down particularly interesting parameter values by hand. Some bypassed the graphical user interface completely and used the keyboard to manually type interesting parameter values, either values which were obtained from other participants on a nearby computer, or promising modifications of values presently in use. Hence some of the participants went beyond merely using a simple user interface and managed to focus their attention more on the underlying mathematics.
Length of attention span: Most participants spent a few minutes at the dis- play, which is already noticeably longer than the time people usually take to look at a single piece of art in a museum, or the time to look at a non- interactive mathematical exhibit. So the user-interactive methods of explor-
ing mathematical content apparently generated more interest and longer at- tention span than passive presentations typically do. Moreover, some par- ticipants returned to the attractor exploration several times. A few also stayed for an extended period of time: In one instance a girl of age 7 tire- lessly worked for more than an hour, producing a prolific output of images, systematically exploring wide ranges of parameters and even finding very rare images where the symmetry of the attractor disappears from the com- puted version.
Reaction to new discoveries: Most participants reacted visibly to some of the attractor shapes, expressing surprise and sometimes open happiness, even though the attractor shapes are completely abstract.
Assessment of “productivity” and development of personal styles: The se- tup included a color laser printer where participants could print for free as many of their works of art as they wished. These works also entered the prize competition automatically. Most participants produced one single piece of artwork, some produced a small number, and very few participants produced a substantial number of works of art, in some cases more than 20.
Observing these latter participants showed (surprisingly) that each “artist”
clearly has their own style which is optically evident in the resulting works.
Our software encouraged individual styles by giving users some choices (e.g. what color the attractor is drawn in) which were not mathematically relevant but seemed to enhance participants' interest.
Solitary exploration and the organization of teams: Most participants ex- plored alone, each one on a separate PC, and this was in fact what we orig- inally had in mind. However, some teams formed, with participants com- paring parameter values and appraising each other's attractors. The effect of the team size could be investigated in further studies.
Conclusions
High school students have graphically explored attractors of chaotic Dy- namical Systems, hence are capable of dealing with mathematical content substantially more sophisticated than they have encountered at school. We also observed discovery style, endurance, productivity, artistic styles and teamwork.
References
Hasselblatt, B., Katok, A. (2003): A first course in dynamics with a panorama of recent developments. Cambridge University Press.