Income Inequality, Inequality of Opportunity and Redistributive Policies
Inauguraldissertation zur
Erlangung des Doktorgrades der
Wirtschafts- und Sozialwissenschaftlichen Fakultät der
Universität zu Köln
2011 vorgelegt
von
Dipl.-Volksw. Judith Niehues
aus Münster (Westf.)
Korreferent: Prof. David A. Jaeger, Ph.D.
Tag der Promotion: 16. Dezember 2011
Acknowledgements
I would like to thank the SOCLIFE Research Training Group at the University of Cologne, funded by Deutsche Forschungsgemeinschaft DFG, for …nancial sup- port and for the encouraging and supportive research climate among the doctoral students. Furthermore I greatly appreciated the stimulating research environment at the Institute for the Study of Labor (IZA) in Bonn, which I could enjoy as a part-time research assistant and research a¢ liate in the last two years of my disser- tation. My work there and especially the constant support, trust and motivation of Dr. Andreas Peichl were of invaluable help in continuing and …nishing my disser- tation project. Of course, I also want to thank my supervisors, Prof. Dr. Clemens Fuest and Prof. David A. Jaeger, PhD, without whom the completion of my dis- sertation thesis would not have been possible. Finally I am absolutely grateful for the encouragement, patience and understanding of my personal environment.
Cologne, December 2011
Contents
List of Figures iii
List of Tables iv
1 Introduction 1
1.1 Motivation and key questions . . . . 1
1.2 Conceptual foundations . . . . 3
1.2.1 Economic inequality . . . . 3
1.2.2 Redistribution . . . . 5
1.2.3 Equality of outcomes versus equality of opportunity . . . . . 7
1.3 The agenda . . . . 9
1.3.1 Chapter 2: Redistributive tax bene…t systems . . . . 9
1.3.2 Chapter 3: The development of …scal redistribution . . . . . 10
1.3.3 Chapter 4: Social spending and income inequality . . . . 11
1.3.4 Chapter 5: Inequality of opportunity . . . . 12
2 Redistributive tax bene…t systems 13 2.1 Introduction . . . . 13
2.2 Data and methodology . . . . 15
2.2.1 Data . . . . 15
2.2.2 Sequential accounting approach . . . . 18
2.2.3 Factor source decomposition approach . . . . 19
2.3 Descriptive evidence . . . . 20
2.3.1 Income distribution and redistribution . . . . 20
2.3.2 Composition of household income . . . . 22
2.4 Inequality contribution of tax bene…t instruments . . . . 24
2.4.1 Sequential accounting approach . . . . 25
2.4.2 Decomposition approach . . . . 27
2.4.3 Discussion of the results . . . . 30
i
ii CONTENTS
2.5 Conclusion . . . . 33
2.6 Appendix . . . . 36
3 The development of …scal redistribution 37 3.1 Introduction . . . . 37
3.2 Theory . . . . 39
3.2.1 E¢ ciency thesis and tax competition . . . . 40
3.2.2 Compensation theory . . . . 41
3.2.3 Tax mix argument: Fiscal policies and redistribution . . . . 43
3.2.4 Development of the …scal structure . . . . 44
3.3 Methodology . . . . 45
3.3.1 Conceptualization of redistribution and progressivity . . . . 46
3.3.2 De…nitions and measurement . . . . 49
3.4 Data . . . . 53
3.4.1 Data and indirect tax imputation . . . . 53
3.4.2 Income concepts . . . . 55
3.5 Results . . . . 57
3.5.1 Baseline estimations . . . . 57
3.5.2 Robustness checks . . . . 63
3.6 Conclusion . . . . 67
3.7 Appendix . . . . 71
4 Social spending and income inequality 75 4.1 Introduction . . . . 75
4.2 Theoretical framework . . . . 77
4.3 Data and methods . . . . 82
4.3.1 Data and conepts . . . . 82
4.3.2 Estimation strategy . . . . 85
4.4 Results . . . . 88
4.4.1 Post-government income inequality . . . . 88
4.4.2 Pre-government income inequality . . . . 91
4.5 Conclusion . . . . 94
4.6 Appendix . . . . 96
5 Inequality of opportunity 98 5.1 Introduction . . . . 98
5.2 Conceptual framework and methodology . . . 102
5.2.1 Measuring IOp: a simple model . . . 102
5.2.2 Empirical strategy to estimate IOp . . . 104
5.3 Data . . . 109
5.4 Empirical results . . . 111
5.4.1 Estimation of earnings equations . . . 111
5.4.2 Lower and upper bounds of IOp . . . 112
5.5 Discussion of results . . . 116
5.5.1 ’Explaining’the results . . . 116
5.5.2 Robustness checks . . . 118
5.5.3 The role of luck . . . 119
5.6 Conclusion . . . 122
5.7 Appendix . . . 124
6 Concluding remarks 130
Bibliography 134
List of Figures
1.1.1 Gini coe¢ cients of income inequality in the mid-1980s and late 2000s 2
1.2.1 Graphical representation of the Gini coe¢ cient . . . . 5
2.2.1 Income inequality in EU countries and regions . . . . 16
2.3.1 Gini income inequality and absolute redistribution . . . . 20
2.3.2 Factor shares of tax bene…t instruments . . . . 23
2.4.1 Relative inequality contribution of tax bene…t instruments . . . . . 28
3.5.1 Development of taxes and social expenditures - some macro evidence 58 3.5.2 Development of progressivity of separate …scal instruments . . . . . 59
3.5.3 Development of redistribution of separate …scal instruments . . . . 62
3.5.4 Development of pre- and post-government inequality . . . . 64
3.5.5 The transplant-and-compare Reynolds-Smolensky index for Germany 68 3.5.6 The transplant-and-compare Reynolds-Smolensky index for the UK 69 3.7.1 Development of overall redistribution . . . . 74
3.7.2 Development of average tax rates of separate …scal instruments . . . 74
4.2.1 Social spending policies and income inequality . . . . 79
5.4.1 Upper and lower bound indices of IOp . . . 114
5.4.2 IOp shares in outcome inequality . . . 115
5.5.1 IOp shares in outcome inequality for di¤erent inequality measures . 119 5.5.2 Upper and lower bounds of IOp when accounting for luck . . . 121
5.7.1 Attitudes towards inequality and redistribution . . . 124
iv
List of Tables
2.4.1 GE(2) inequality measures and redistributive instruments . . . . 29
2.4.2 Factor shares and factor correlations . . . . 32
3.4.1 VAT rates in Germany and the UK . . . . 54
3.7.1 OLS coe¢ cients of indirect tax imputation . . . . 71
3.7.2 Actual and simulated VAT revenues in billions of Euro . . . . 72
3.7.3 Bivariate OLS estimations of location and scale parameters . . . . . 73
4.3.1 Descriptive statistics . . . . 83
4.4.1 Social spending generosity and post-government income inequality . 89 4.4.2 Income inequality and di¤erent bene…t functions . . . . 91
4.4.3 Social spending and pre-government income inequality . . . . 93
4.6.1 Data robustness checks . . . . 96
4.6.2 OLS and FE speci…cations . . . . 97
5.5.1 Sensitivity analysis . . . 120
5.7.1 Descriptive statistics –circumstance variables (cross-sectional data) 125 5.7.2 Descriptive statistics –e¤ort variables (longitudinal data) . . . 126
5.7.3 Bootstrapped con…dence intervals . . . 127
5.7.4 OLS reduced-form regressions –lower bound of IOp . . . 128
5.7.5 FE earnings regressions –deriving the unit-e¤ect . . . 129
v
Chapter 1 Introduction
1.1 Motivation and key questions
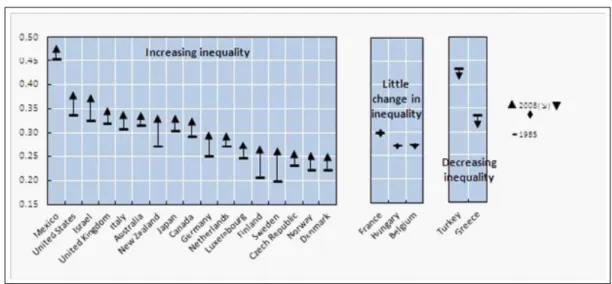
Although periods of sustained economic growth are generally associated with re- ductions in absolute poverty, such reductions do not necessarily bring about an equitable distribution of incomes. For example, in Germany, average real incomes have increased by around 10 percent over the last 25 years. However, while only a slight income increase occurred at the bottom of the income distribution, incomes of the richest 10 percent of the population have increased considerably.
1This phe- nomenon of an increasing dispersion of incomes is not unique to Germany. A recent OECD (2011) report shows that income inequality has increased in most developed countries over the last two decades (see Figure 1.1.1). In fact, according to the International Social Survey Programme (IISP) 2009, the majority of respondents in European countries agree that “di¤erences in income are too large” and “it is the responsibility of the government to reduce the di¤erences in income between people with high incomes and those with low incomes.” Therefore, economic and social cohesion are high on the political agenda of most developed welfare states, and most people agree that public policies can play a key role in redistributing income. However, as the considerable variations in inequality levels illustrated in Figure 1.1.1 show, welfare states di¤er dramatically in terms of the extent to which they reach this goal. Therefore, understanding …scal and social policy design and the corresponding distributive outcomes is of crucial importance not only to public economics but also for well-designed redistributive policymaking.
In this book, we examine redistributive policies and income inequality and
1Source: SOEP micro data. Real income for the poorest (richest) 10 percent of the population in 1983 was less thane11,549 (more thane48,976) and less thane12,001 (more thane55,788) in 2008 (in 2005 prices).
1
Figure 1.1.1: Gini coe¢ cients of income inequality in the mid-1980s and late 2000s
Source: OECD (2011). Note: For the Czech Republic and Hungary, instead of data for the mid-1980s, data for the early 1990s are used.
their interdependencies from a cross-national perspective. The book will contrib- ute to the debate about the distribution and redistribution of income in various ways. First, we analyze the size and structure of e¤ective redistribution in a broad sample of European welfare states. Besides answering the question of how di¤er- ent components of the tax and transfer system contribute to disposable income inequality, we also investigate whether the …ndings are sensitive to the underly- ing measurement method. In the second chapter, we extend this analysis by also considering indirect taxes and investigating the development of redistributive ef- fects over time. Based on two detailed case studies of Germany and the United Kingdom, we theoretically and empirically evaluate whether the structure of …scal policies has changed over the last two decades. The analysis provides a compre- hensive dynamic analysis of e¤ective progressivity and redistribution by including all major …scal elements: direct taxation, pay roll taxes, indirect taxes, and social bene…ts.
The …rst two chapters focus only on the …rst-order e¤ects of redistributive policies, ignoring the possible subsequent behavioral e¤ects of these policies. In the third chapter, we try to identify the causal e¤ect of redistributive spending policies on income inequality and discuss possible second-order e¤ects. In contrast to previous analyses, for the cross-country analysis in the last chapter, we investigate the concept of unequal opportunities rather than outcome inequalities. While the
…rst chapters of this book only rely on cases from the European Union (EU), here
we compare Germany and the United States because of the distinct di¤erences
1.2. CONCEPTUAL FOUNDATIONS 3 between Europeans and Americans in attitudes toward inequality, social mobility, and redistribution (Alesina and Glaeser (2004), Alesina and Angeletos (2005)).
We present and discuss a new approach for measuring equality of opportunity (EOp) and analyze the impact of tax bene…t systems on opportunities instead of outcomes.
In the remainder of the introduction, we will proceed as follows. In Section 1.2, we will brie‡y describe inequality, redistribution, and inequality of opportunity (IOp) and their interdependencies. Then, in Section 1.3, we will contextualize the di¤erent chapters and summarize their main results.
1.2 Conceptual foundations
In this section, we introduce general conceptual issues related to the distribution and redistribution of income. More precisely, we de…ne the three major concepts with which the book is concerned: economic inequality, redistribution, and EOp.
1.2.1 Economic inequality
» ...with the hope that when they grow up they will …nd less of it no matter how they decide to measure it « Amartya Sen (1973, dedication to his children)
With the seminal publications of Atkinson (1970, 1975) and Sen (1973), the is- sue of economic inequality became part of the economic research agenda. By now, a substantial body of research has been accumulated on the measurement, causes, and consequences of inequality. Especially with the availability of comparable na- tional micro datasets with representative household income data, researchers have made great progress in empirical studies focusing on economic inequality and in the concepts, methods, and models used.
2Especially when measuring economic inequality in an international context or over time, several conceptual issues have to be taken into account. “Ideally income would be measured on a post-tax and transfer basis consistent with the Haig-Simons income concept of real consumption plus (or minus) change in net worth. Income would include both cash and non- cash components, would be adjusted for economies of scale in consumption using an appropriate equivalence scale, and would cover the period over which famil- ies can smooth consumption by lending or borrowing ”(Gottschalk and Smeeding,
2See Jenkins and Micklewright (2007) for a broad overview over the historical development of studies on the issue of economic inequality.
1997: 637).
3In general, this benchmark income concept can only be approximated in empirical inequality research. Nevertheless, this benchmark operationalization hints at three major issues that have to be considered when assessing economic in- equality: the economic variable of interest, the time period, and the demographic reference unit.
In the following, we delineate on which conceptual de…nitions of economic in- equality the subsequent analyses are based. As in almost all other studies, we fall short of Haig-Simons’s comprehensive de…nition and apply income as the only resource variable of interest. Our choice of income as a measure of well-being is primarily justi…ed by the better availability of comparable micro data on incomes, as compared to data on consumption and total assets. In contrast to Haig-Simons’s de…nition, we do not attempt to capture lifetime utility but we generally restrict our reference period to one year. Thus, as an important limitation, we cannot take into account the lifetime distribution of resources and can only provide an- nual snapshots of the distribution of incomes. This annual view, however, is also suggested by the Expert Group on Household Income Statistics (2001) because it is the natural accounting period for the majority of income sources. Our reference unit will be the household (or individuals within households), and in order to ac- count for possible economies of scales within households, household incomes are adjusted by equivalence scales.
4Beside these conceptual issues, we must point out that one can aggregate the distribution of incomes into a measure of inequality in numerous ways. Here we only introduce the most popular and most frequently used inequality measure, the Gini coe¢ cient (Gini (1914)). We also rely on this inequality measure in the majority of subsequent analyses.
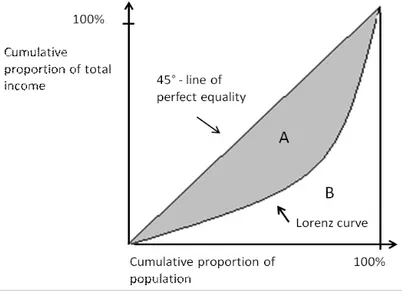
5The Gini coe¢ cient is derived with the help of the Lorenz curve, which orders the population by magnitude of income (starting with the lowest). Then, the cumulative proportion of total income received by income units is plotted against the cumulative proportion of the population. The Gini coe¢ cient then measures the area between the Lorenz curve and the 45 line as a fraction of the total area under the the 45 line: G =
A+BA(see Figure 1.2.1).
3Gottschalk and Smeeding (1997) refer to the income concepts developed by Haig (1921) and Simons (1938).
4Throughout the book, we will rely on di¤erent equivalence scales, which are explained at the relevant places. For more information on equivalence scales, see Buhmann et al. (1988).
5In the remainder of the book, further inequality measures are formally introduced. See e.g.
Jenkins (1991), Cowell (2000), Jenkins and Van Kerm (2009), and Ochmann and Peichl (2006) for comprehensive overviews on the measurement of economic inequality.
1.2. CONCEPTUAL FOUNDATIONS 5
Figure 1.2.1: Graphical representation of the Gini coe¢ cient
Source: Lambert (2001).
The Gini coe¢ cient is one in the case of maximum inequality and zero when all incomes are equal (45 line). With regard to the sensitivity of the distribution scale, the Gini coe¢ cient attaches most weight to the income of the middle classes.
The Gini coe¢ cient has the disadvantage that it might indicate the same value of inequality for two distinct distributions in the case of intersecting Lorenz curves.
When comparing income distributions across countries and over time, another major concern is the underlying data sources. Atkinson and Brandolini (2001: 772) comment on the pitfalls of using secondary inequality data: “Gini coe¢ cients of income inequality may be published for a range of countries, but there is no agreed basis of de…nition. [. . . ] We cannot therefore be sure whether results of comparative or econometric analyses obtained using such data are genuine or a product of data di¤erences.”Therefore, all subsequent distributional measures are computed from micro data to ensure the comparability of their conceptualization.
1.2.2 Redistribution
» Because it taxes and it spends, the welfare state is by de…nition redistributive, but the degree to which this is associated with more equal- ity is an open empirical question « Esping-Andersen and Myles (2009:
639)
In order to assess the distributional impact of public policies, we must …rst
clarify what is meant by redistribution and how it is measured. At …rst glance,
redistribution seems to be an easy, rather concrete term. As Lambert (2001:
37) states, “Transferring income from rich to poor is an act of redistribution, in anyone´ s language.” Although this is obviously true, redistribution can still encompass di¤erent things and there is no uncontroversial way to measure it. We will start by narrowing down what we mean when we speak of redistribution and develop a general de…nition of redistribution that is relevant for our research.
This book is particularly concerned with the distributional impact of …scal policies. Thus, we will focus only on redistribution by the government, more speci…cally redistribution induced by the tax and transfer systems. Accordingly, private transfers are not taken into account. Another important restriction of our de…nition will be the one-dimensionality of redistribution because we will only consider monetary redistribution. Due to data constraints, the redistributive ef- fects of the public provision of services, such as education and health care, are not taken into account, despite the fact that those are important components of social policies in many a- uent countries (Huber and Stephens (2001)).
Finally and most importantly, policies re‡ect di¤erent objectives, and di¤erent types of redistribution are achieved. Besides the redistribution from rich to poor, social policies seek to provide income maintenance or insurance in the face of adverse risks (e.g., unemployment, sickness, and disability) or redistribution across the life cycle (e.g., retirement pensions). As outlined above, the view we take is static in the sense that we cannot take into account lifetime redistribution.
6Thus, we focus exclusively on the annual actual amount of redistribution, meaning how much reduction in income inequality is achieved in a country per year. Therefore, we are most interested in the redistribution from rich to poor – although, as will become clear throughout the subsequent chapters, we will not be able to fully disentangle redistributive e¤ects from lifetime redistribution. Summing up, in the remainder of the book, when we speak of redistribution, we refer to the (annual) reduction in income inequality achieved by the national design of tax bene…t systems.
The standard approach of measuring (e¤ective) redistribution is the comparison of inequality measures before and after government intervention (or before and after a single tax bene…t instrument).
7This approach, however, can be problematic because the pre-government distribution of incomes is not independent of changes
6In a related paper on the distributional outcomes of welfare states, we discuss and empirically assess the lifetime redistribution achieved by public pensions. See Kammer et al. (2011).
7Further approaches to empirically assess redistribution (and progressivity) and studies that apply these di¤erent methods are introduced in Chapters 2 and 3.
1.2. CONCEPTUAL FOUNDATIONS 7 in tax bene…t systems. Notwithstanding this problem, there is strong political interest in the redistributive e¤ects of the …scal system, and empiricists try to measure them. This book is part of this research program and seeks to contribute to the understanding and measurement of the redistribution achieved by di¤erent tax bene…t instruments. In particular, Chapter 4 discusses possible second-order e¤ects of redistributive policies on the pre-government distribution of incomes.
1.2.3 Equality of outcomes versus equality of opportunity
» We know that equality of individual ability has never existed and never will, but we do insist that equality of opportunity still must be sought. « Franklin D. Roosevelt (1936)
While in recent decades most economists have observed an increase in income inequality in the bulk of developed countries, fewer agree about whether govern- ments should do something about it. One argument for why the government should care about inequality rests on the philosophical doctrine of utilitarianism, whose main idea lies in the maximization of the total utility of a society.
8Together with the (intuitive) assumption that income has diminishing marginal utility and the (restrictive) assumption that everyone has the same utility function, it follows that any transfer from rich to poor would increase social welfare. Given these assump- tions, an equal distribution of incomes would maximize total utility. However, this immediately evokes the main counterargument against promoting perfect equality.
The utilitarian distribution principle o¤ers people no incentive to work. The main idea of the incentive argument is that without redistributive government interven- tion, total income would be larger, and in the end, everybody would be better o¤
(trickle-down-e¤ect ).
9Martin Feldstein restates this idea as follows: "According to o¢ cial statistics, the distribution of income [in the United States] has become increasingly unequal during the past two decades. A common reaction in the popular press, in political debate, and in academic discussions is to regard the increased inequality as a prob- lem that demands new redistributive policies. I disagree. I believe that inequality as such is not a problem and that it would be wrong to design policies to reduce it. What policy should address is not inequality but poverty " (Feldstein, 1999:
8See Bentham (1789).
9Further arguments against inequality derive from pure self-interest considerations and relate to the possible negative consequences of inequality (e.g., crime and the instability of political institutions). However, robust evidence on inequality as the driving force behind these outcomes is still missing.
33). This is compatible with the Rawlsian view about distributive justice, which, in contrast to the utilitarian distribution principle, requires that any distributive principle should maximize the income of the least well-o¤ (Rawls (1971)). This begs the question of whether we should actually worry about an unequal distri- bution of income or if it is enough to provide a social safety net for the poor.
Rawls derives his conclusion by ruling out envy as a legitimate motivation for thinking about distributive issues. However, Milanovic (2007) argues that envy might simply represent people’s impression that di¤erences in income are to a large part undeserved because incomes are mainly determined by luck and external cir- cumstances. If we ignore the negative connotation of envy, we might also view this as a sense of justice.
10Thus, regarding income inequality, of major concern are fairness considerations, which are related to the origins of income di¤erences.
Indeed, the evidence shows that individuals are more willing to accept income di¤erences that are due to individual e¤ort (or laziness) rather than exogenous circumstances. Also, preferences for redistribution are systematically correlated with beliefs about the relative importance of e¤ort and luck in the determination of outcomes.
11This is in line with most modern theories of distributive justice, which distinguish between ethically acceptable inequalities (e.g., due to di¤erences in e¤ort) and unfair inequalities (e.g., due to endowed characteristics and luck).
By now, many philosophers see EOp as the appropriate currency of egalitarian justice.
12While the traditional notion of equality of outcomes refers to an equal dis- tribution of economic outcomes (e.g., well-being and income), the EOp theory, in contrast, distinguishes between circumstances and e¤ort as determinants of outcomes. Starting with seminal works by Roemer (1993, 1998), Van de gaer (1993), and Fleurbaey (1995), economists have become increasingly interested in this normatively appealing concept. By now, a vast number of researchers have conceptualized EOp and tried to measure it.
13Since EOp theory only defends com- pensation for inequalities due to circumstances, EOp policy aims at leveling the playing …eld by compensating individuals for any de…cits due to circumstances and ensuring that only e¤ort a¤ects achievement. Thus, the empirical assessment of questions such as whether redistributive policies are actually e¤ective in promoting
10See Kenworthy (2008) for a more detailed discussion of these issues.
11See Fong (2001), Konow (2003), Alesina and Giuliano (2011), and Gaertner and Schokkaert (2011).
12See Sen (1980, 1985, 1992), Dworkin (1981a,b), Arneson (1989), Cohen (1989), Roemer (1993, 1998, 2002), and Fleurbaey (2008).
13See Chapter 5 for a broad overview of the EOp literature.
1.3. THE AGENDA 9 EOp and whether improvements in terms of outcome equality are also associated with advances regarding EOp are of particular interest. Indeed, in a related work on a broad set of European countries, we found that the equalizing impacts of the tax bene…t system on IOp di¤er substantially from those observed in the tra- ditional notion of inequality of outcomes (see Dunnzla¤ et al. (2011)). The last part of the book builds on this earlier work and contributes to the EOp literature in two major ways: First, we introduce a new approach of empirically measuring EOp, and second, we analyze the e¤ect of public policies on these measures.
1.3 The agenda
In the following, we will summarize the content and main contribution of the following four chapters. For each chapter, we will sketch the methods used and outline the main results. Chapter 6 will brie‡y draw conclusions.
1.3.1 Chapter 2: Redistributive tax bene…t systems
In this chapter, we provide a comprehensive descriptive analysis of the equalizing e¤ects of di¤erent taxes and bene…ts based on two approaches. We derive and compare redistributive e¤ects based on both the standard sequential accounting approach, which is brie‡y mentioned in Section 1.2.2, and the factor source decom- position approach suggested by Shorrocks (1982, 1983). Thus, we investigate not only the redistributive importance of tax bene…t instruments across countries but also whether our …ndings are sensitive to the measurement method used. Since the analysis is based on the EU-25, it is also interesting to see how the new member states, mostly from Central and Eastern Europe, compare to the well-established welfare states of Western Europe.
The results suggest that tax and transfer systems substantially reduce income
inequality in all EU member states. However, the two measurement approaches
yield very di¤erent, partly contradictory, results. Inequality analysis based on
the sequential accounting approach suggests that bene…ts are the most import-
ant source of inequality reduction in most European tax and transfer systems,
whereas the factor source decomposition approach suggests that bene…ts play a
negligible role and sometimes even contribute slightly positively to inequality. On
the contrary, here taxes and social contributions are by far the most important
contributors to income inequality reduction. The di¤ering results can be attrib-
uted to the di¤erent normative focus of the two approaches. While the Shorrocks
approach provides a unique decomposition rule for any inequality measure, the ap- proach violates the normatively intuitive axiom that equally distributed transfers reduce aggregate inequality.
With respect to country di¤erences, we …nd that the new EU member states do not di¤er greatly from traditional Western European welfare states. Instead, the majority of Central Eastern European countries naturally group together with traditional Continental Western European welfare states. The Baltic ‡at tax coun- tries, however, emerge as a distinct group characterized by very small welfare states, as compared to other European countries.
1.3.2 Chapter 3: The development of …scal redistribution
While the previous chapter takes a purely cross-sectional perspective, this chapter focuses on the structural changes in the composition of national …scal systems from the mid-1980s to today. However, it draws on …ndings from the previous analysis and applies the standard approach to measure the redistributive e¤ects of taxes and bene…ts. Besides the dynamic perspective, one important contribution is the inclusion of indirect taxes in the analysis of the redistributive e¤ects of welfare states.
The analysis begins with a detailed review of established political economic theories on the development of …scal redistribution. The political economy liter- ature frequently argues that increasing international integration and competitive pressures also a¤ect welfare policies. The consequences are re‡ected in a cut back of tax progressivity. However, there is no consistent evidence of a retrenchment of welfare states. Grounding our analysis in compensation theory as well as tax com- petition and tax mix arguments, we deduce our guiding substitution hypothesis, which predicts that redistributive capacities shift from taxation to spending, mean- ing that the redistributive e¤ects of taxes and bene…ts are empirical substitutes.
To empirically test the substitution hypothesis, we conduct a micro-data based analysis of e¤ective progressivity and redistribution by including all major …scal elements: direct taxation, pay roll taxes, indirect taxes, and bene…ts. In addition to the standard approach of measuring redistribution, we also apply a transplant- and-compare procedure to account for the impact of changing pre-government incomes. Since indirect tax payments are not available for a broad set of countries, our analysis is restricted to the two cases of Germany and the United Kingdom.
For Germany, we use an imputation procedure to approximate the distribution of
indirect tax payments across households for di¤erent years.
1.3. THE AGENDA 11 This analysis reveals two important results. First, we …nd that the regressive structure of indirect taxation (and social insurance contributions) absorbs the re- distributive e¤ects from progressive income taxation in both countries. Second, we
…nd some evidence for the substitution hypothesis in Germany. Here, increasingly regressive tax systems are indeed accompanied by more redistributive bene…ts. We do not observe this shift in the United Kingdom.
1.3.3 Chapter 4: Social spending and income inequality
In the previous chapters, we generally abstracted from behavioral e¤ects induced by redistributive policies. In this chapter, we relax this restrictive assumption.
Using a dynamic panel approach based on European countries and the period 1993-2007, we investigate whether a more generous welfare state is indeed causally related to more equality in the distribution of incomes or whether the …rst-order equalizing e¤ects we found in the previous (cumulative) cross-sectional analyses are o¤set by reverse behavioral e¤ects in the long run. Besides the overall e¤ect of social spending, we also investigate which kind of bene…ts are most e¤ective in reducing income inequality by examining the speci…c structure and characteristics of bene…ts.
The chapter starts with a theoretical part in which we elaborate on possible behavioral second-order responses induced by redistributive social policies, which might o¤set inequality reducing …rst-order e¤ects. In this context, the di¤erent objectives of social spending policies are also discussed. Regarding the estimation strategy, we apply the System GMM dynamic panel estimator and the presumably random incidence of certain diseases to account for the inherent endogeneity of social policies with regard to inequality levels.
The regression results unambiguously suggest that more social spending e¤ect-
ively reduces inequality levels. The result is robust with respect to the instru-
ment count and di¤erent data restrictions. Looking at the structure of bene…ts,
unemployment bene…ts and public pensions in particular are responsible for the
inequality-reducing impact. More targeted bene…ts, however, do not signi…cantly
reduce income inequality. Rather, their positive e¤ect on pre-government income
inequality hints at substantial disincentive e¤ects.
1.3.4 Chapter 5: Inequality of opportunity
So far, the empirical analyses were all based on the traditional inequality of out- comes approach. However, individuals might be more willing to accept income di¤erences that are due to individual e¤ort rather than exogenous circumstances.
Therefore, in this chapter, we introduce the concept of EOp and analyze the equal- izing impact of public policies on opportunities rather than outcomes.
Previous estimates of unfair IOp are only lower bounds because of the unob- servability of the full set of relevant circumstances. In the conceptual framework at the beginning of the chapter, we develop a new estimator based on a …xed e¤ects panel model, which also allows for the identi…cation of an upper bound for IOp. The empirical application of the new estimator is based on Germany and the United States, two countries that di¤er considerably in their attitudes to- ward inequality and redistribution and which provide appropriate panel data with su¢ cient information on parental background and other external circumstances.
We …nd signi…cant and robust di¤erences between lower and upper bound IOp
estimates for both countries. Therefore the analysis suggests that existing lower
bound estimates for IOp might demand for too little redistribution in order to
equalize unfair inequalities. When using periodical incomes, IOp shares in the
United States are signi…cantly lower than in Germany. Hence, EOp is indeed higher
in the “land of opportunity.”Interestingly, we …nd no signi…cant di¤erence between
IOp shares in gross and net earnings in the two countries. This indicates that there
is no di¤erential e¤ect of the tax bene…t system on unequal opportunities in our
sample (i.e., no tagging on circumstances). However, we identify public policies as
a useful tool to change IOp: A policy simulation reveals that the abolishment of
joint taxation in favor of individual taxation signi…cantly reduces IOp.
Chapter 2
Redistributive tax bene…t systems
In this chapter we analyze the redistributive e¤ects of tax bene…t systems in the enlarged European Union. The analysis reveals that di¤erent approaches of meas- uring redistribution might lead to very di¤erent results regarding the equalizing e¤ects of di¤erent tax bene…t instruments.
142.1 Introduction
Inequality is usually measured in terms of disposable income, which is determined by i) the pre-tax income distribution and ii) various redistributive policies. From a policy perspective, it is important to understand to what extent the di¤erences in inequality levels between countries are driven by di¤erences in the market income distribution and to what extent they are driven by di¤erent designs of the welfare state. Although one of the main objectives of the European Union (EU) is to enhance economic and social cohesion, there are still sizeable di¤erences across member states in the levels of within country income inequality. This is true especially since the enlargements of the EU in 2004 and 2007, when in total twelve additional countries, mostly from Eastern Europe, joined the EU. With respect to the recent EU enlargement it is particularly interesting to see how the new member states compare to the well-established welfare states of Western Europe.
The purpose of this chapter is to investigate the impact of taxes and bene…ts on disposable income inequality and to compare the contribution of these two components across twenty-four EU member states. Our results suggest that the measured contributions of taxes and bene…ts on overall inequality strongly depend on the measurement concept used. These di¤erences in results can be explained
14This chapter is based on Fuest et al. (2010).
13
by di¤erent normative concepts underlying the two approaches.
The analysis of income inequality, the design of the welfare state, and the size of redistribution have a long tradition in economic and social science literature.
Especially regarding the analysis of the development of income inequality across countries and time, a large number of empirical studies exists (see Anand and Segal (2008) for a recent overview). Due to data limitations, the development of redistribution across countries and time is not as extensively analyzed as inequality.
However, since the availability of comparable micro data sets there has been much progress in analyzing redistributive e¤ects in cross-country comparisons.
When assessing the overall distributional impact of di¤erent tax bene…t in- struments, one can generally distinguish between two di¤erent approaches in the literature. The majority of micro studies measures e¤ective redistribution of the tax bene…t system by taking either the relative or absolute change of inequality measures of the pre-government and post-government income distribution (e.g., Mitchell (1991), Immervoll et al. (2005), Mahler and Jesuit (2006), Whiteford (2008)). Based on a certain income accounting framework, this approach sequen- tially applies di¤erent tax bene…t instruments and compares the status-quo with the counterfactual distribution without the instrument in question. In the follow- ing, we will refer to this approach as the sequential approach of measuring e¤ective redistribution.
Another means of assessing the impact of di¤erent income components such as taxes and transfers on income inequality is the factor source decomposition ap- proach, suggested by Shorrocks (1982, 1983). As total disposable income can be exhaustively decomposed into di¤erent pre-tax income sources as well as taxes, social insurance contributions and bene…ts, it is possible to calculate the contribu- tion (equalizing or disequalizing e¤ect) of each factor to overall inequality in the status quo. Here the inequality contribution of each factor component is determ- ined simultaneously. With this decomposition approach it is not only possible to determine the impact of taxes and transfers but also the inequality contribution of self-employment and capital income to total income (e.g., Jenkins (1995), Jäntti (1997), Frässdorf et al. (2011)).
Obviously, di¤erent approaches can lead to di¤erent results, which in turn
would imply di¤erent policy implications. Therefore, we use EU-SILC (Statist-
ics on Income and Living Conditions) micro data of 2007 to compare the two
approaches with regard to the redistributive e¤ects of tax bene…t systems. The
2007 wave is the …rst to provide information on both gross and net incomes for all
twenty-…ve EU member states (except Malta). Thus, not only do we investigate
2.2. DATA AND METHODOLOGY 15 the redistributive importance of tax bene…t instruments across countries, but we also investigate whether our …ndings are sensitive to the measurement method em- ployed. Particularly, we identify the relative positions of the new member states in the inequality ordering of EU countries.
Our results suggest that tax and transfer systems substantially reduce income inequality in all EU member states. But the two measurement approaches de- scribed above yield very di¤erent, partly contradictory results, especially concern- ing the relative importance of di¤erent tax bene…t instruments. Inequality analysis based on the sequential accounting approach suggests that bene…ts are the most important factor reducing inequality in the majority of countries. The factor source decomposition approach, however, suggests that bene…ts play a negligible role and sometimes even slightly increase inequality. According to this methodology, taxes and social insurance contributions are by far the most important contributors to reducing income inequality. We explain these partly contradictory results by the di¤erent normative focuses of the two approaches and show that many bene…ts seem to have objectives other than reducing disposable income inequality.
The remainder of the chapter is organized as follows: Section 2.2 describes the data and methodologies employed in this study. In Section 2.3, we provide some descriptive statistics about inequality levels in EU countries and household income composition. Section 2.4 presents the results of the redistributive e¤ects of tax bene…t instruments based on both, the sequential and the decomposition approach and di¤erences in the …ndings are discussed. Section 2.5 concludes.
2.2 Data and methodology
2.2.1 Data
The EU-SILC micro data set provides harmonized and comparable multidimen- sional micro data of households and individuals in European countries.
15Since 2005, the dataset covers the EU-twenty-…ve member states (except Malta) and it is the largest comparative survey of European income and living conditions. Our analysis is based on the 2007 EU-SILC wave which is the …rst to include gross income information for all countries. The sample size varies from 3,505 households in Cyprus to 20,982 households in Italy. The survey is representative for the whole
15For more information on the EU-SILC methodologies, de…nitions, coverage as well as the national questionnaires see http://forum.europa.eu.int/Public/irc/dsis/eusilc/library.
population in each country due to the construction of population weights.
In the remainder, we refer to our total sample of countries as the "EU-24" or simply the "EU". To the …fteen old EU member states before the EU enlargement in 2004 we refer to as "EU-15"
16and to the nine New Member States shortly as "NMS"
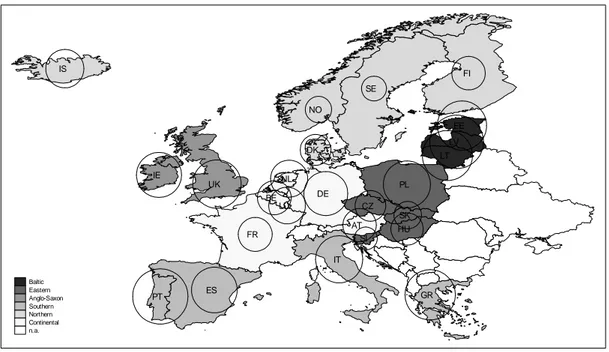
17. Furthermore, we categorize countries according to their geograph- ical position into Continental (AT, BE, DE, FR, LU, NL), Northern (DK, FI, SE), Southern (CY, ES, GR, IT, PT), Anglo-Saxon (IE, UK), Central Eastern (CZ, HU, PL, SI, SK) and Baltic (EE, LT, LV) countries, as illustrated in Fig- ure 2.2.1. The geographical clustering of the EU-15 countries nicely corresponds to the famous welfare state typology of the political and social science literature (Esping-Andersen 1990, later modi…ed by Ferrera 1996), which we will refer to later on. The subgroups of Central Eastern and Baltic countries add up to the group of Eastern European countries.
AT BE
CZ DK
EE FI
FR
DE
GR HU IS
IE
IT
LV LT
LU NL
NO
PL
PT
SK SI
ES
SE
UK
Baltic Eastern Anglo-Saxon Southern Northern Continental n.a.
Figure 2.2.1: Income inequality in EU countries and regions
Source: Own calculations based on EU-SILC. The size of the circles represents the level of inequality in DPI in the corresponding country.
In our application, total equivalent disposable household income (DPI) is ex- haustively decomposed into its household equivalent components: factor income (wages and salaries, income from self-employment and capital incomes), personal
16Austria (AT), Belgium (BE), Denmark (DK), Germany (DE), Greece (GR), Spain (ES), Fin- land (FI), France (FR), Ireland (IE), Italy (IT), Luxembourg (LU), Netherlands (NL), Portugal (PT), Sweden (SE), United Kingdom (UK).
17Cyprus (CY), Czech Republic (CZ), Estonia (EE), Hungary (HU), Lithuania (LT), Lativa (LV), Poland (PL), Slovenia (SI), Slovakia (SK).
2.2. DATA AND METHODOLOGY 17 income taxes (PIT), social insurance contributions, social bene…ts and public pen- sions, based on the following identity:
DP I = (f actor income + SIC employer)
| {z }
expanded f actor income
P IT SIC+benef its+public pensions (2.2.1) We use household equivalent incomes to compensate for di¤erent household structures and possible economies of scales within households.
18In the remainder of the chapter we always refer to the equivalent measures of household income com- ponents unless explicitly noted otherwise. To make incomes comparable across countries, we adjust national income amounts by the multilateral current pur- chasing power parities provided by Eurostat database. Note that our concept of expanded factor income (EFI) includes social insurance contributions paid by the employer as they can be very di¤erent across countries.
19For the sake of sim- plicity we refer to the total amount of social insurance contributions paid by the employee and the employer simply as "SIC". We consider the role of public pen- sions separately because one can argue that public pensions are not really part of the redistributive system but should rather be seen as deferred earnings or the result of compulsory savings.
20This function of public pensions is particularly true for countries which apply insurance-based systems. Furthermore, the analysis only allocates those taxes and bene…ts that can be reasonably attributed to households.
Therefore, corporate taxes as well as some types of government expenditures such as expenditures on defense are not considered. Due to data limitations, indirect taxes and in-kind bene…ts cannot be taken into account, either. Thus, in the re- mainder, we merely advert to cash bene…ts when speaking of social bene…ts and to personal income taxes in the cases of taxes. We provide further information on the exact de…nition and computation of all income components in the data appendix.
18For each person, the equivalent (per-capita) DPI is its household DPI divided by the equivalent household size according to the modi…ed OECD scale, which assigns a weight of 1.0 to the head of household, 0.5 to every household member aged fourteen or older and 0.3 to each child aged less than fourteen. Summing up the individual weights gives the household speci…c equivalence factor.
19Ankrom (1993) also follows this approach. He argues that ignoring employers’social insurance contributions would implicitly assume that the wage elasticity of labour supply is in…nite.
However, empirical analyses rather suggest the opposite and therefore this can signi…cantly bias the results of the e¤ectiveness of tax and transfer systems.
20Pensions in EU-SILC generally follow the ESSPROS classi…cation of Eurostat which includes all mandatory pension programmes and does not distinguish between pre-funded and pay-as- you-go systems. Further information on this interpretation of the function of pensions may be found in the ESSPROS Manual (Eurostat (1996)).
2.2.2 Sequential accounting approach
Consider a population of n persons (or households), i = 1; :::n, with x
ias the income of individual i, x is the average income and a population weight w
i(N = P
ni=1
w
i).The generalized entropy (GE) class of inequality indices (Shorrocks (1980)) is given by the following expression:
I = 1
( 1) Z
10
x
ix
h x
ix 1 i
dF (2.2.2)
where F is the CDF of income and is a parameter indicating the sensitivity toward social concern for a particular part of the income distribution.
21To determine the e¤ective distributional impact of di¤erent tax bene…t instru- ments, we …rst use what we call the sequential approach to analyzing the distribu- tional impact of di¤erent policy instruments. For this approach we have to de…ne di¤erent income concepts at di¤erent stages of redistribution. Following Mitchell (1991) and Whiteford (2008), among others, we apply an accounting framework for household income, where di¤erent income components are added sequentially. Ac- cordingly, the sum of wages and salaries, self-employment income, capital income and in our case also employers’ social insurance contributions equal "expanded factor income (EFI)" and "market income (MI)" is the EFI and public pensions.
MI plus all di¤erent types of social bene…ts is "gross income (GI)", subtracting personal income taxes is "post-tax income" and …nally subtracting employees’and employers’ social insurance contributions (SIC) is "DPI". With this accounting framework, a number of measures of the redistributive impact of the tax bene…t system can be constructed by comparing inequality measures at di¤erent stages of household income. For instance, the relative redistribution achieved by social be- ne…ts equals the percentage change in the inequality of MI relative to the inequality of GI:
GE( )
M IGE( )
GIGE( )
M I(2.2.3)
The impact of personal income taxes is evaluated by comparing the inequality of the distribution of GI and post-tax income and so on.
However, this framework is static and linear which results in a number of lim- itations. For example, there are no interactions between the di¤erent stages of redistribution. In reality, however, in some countries bene…ts are also taxable.
21See, e.g., Cowell and Kuga (1981). The more positive (negative) is, the more sensitive is to changes at the top (bottom) of the income distribution.
2.2. DATA AND METHODOLOGY 19 As a result, the order in which di¤erent components are accounted in‡uences the measurement of their relative contribution to redistribution. For example, by …rst adding bene…ts to factor income, we necessarily overestimate the redistributive ef- fects of bene…ts in countries in which such bene…ts are taxable (Ferrarini and Nel- son (2003); Mahler and Jesuit (2006)). Due to this sensitivity of the redistributive measures with regard to the de…nition of pre-instrument income, Immervoll et al.
(2005) follow a slightly di¤erent approach which we also apply as a robustness check of our results. For each tax or bene…t they start from the hypothetical situ- ation without the instrument in question (DPI - instrument) and ask by how much inequality is reduced by introducing it.
2.2.3 Factor source decomposition approach
As total (disposable) income is generally composed of several sources of income, it is useful to express total inequality in DPI as the sum of these factors’contri- butions (Shorrocks 1982, 1983). The exact decomposition procedure depends on the measure of inequality used, but whichever measure is used must naturally be decomposable and it must be de…ned for zero incomes. In practice, the easiest measure to implement with these properties is GE(2) which can also be expressed as half the squared coe¢ cient of variation CV:
GE(2) = 1 2
X
ni=1
w
iN
x
ix
2
1
!
= 1 2
p V ar(x) x
!
2= 1 2
V ar(x) x
2= 1
2 (CV )
2(2.2.4) Suppose DPI x can be written as the sum of f = 1; :::; K di¤erent sources of income x
f: x =
P
K f=1x
f;
fis the correlation between x and x
f; and
f=
xxfis f
0s factor share.
I
2= GE(2) = X
Kf=1 f f
q
GE
2GE
2f= X
Kf=1
s
fI
2= X
Kf=1
S
f(2.2.5)
where GE
2fdenotes the inequality in factor source f and S
fthe (absolute) contribution of factor f to total (DPI) inequality. Note that income source f provides a disequalizing e¤ect if S
f> 0, and an equalizing e¤ect if S
f< 0.
s
f= S
f=I
2is the relative contribution of f to total inequality and indicates the
importance of f:
2.3 Descriptive evidence
2.3.1 Income distribution and redistribution
To illustrate the variation in inequality among EU member states we compute a number of distributional measures. Note, that here we use the Gini coe¢ cient as our measure of inequality because of its readily intuitive interpretation and its use in comparable micro studies. When …rst looking at the former EU-15 countries as one single economic unit, irrespective in which country the individuals live, we …nd an overall inequality level in EFI of 0.51 and of 0.31 in DPI. Adding the nine additional EU member states yields inequality levels of 0.53 and 0.34, respectively. This highlights a notable increase in overall inequality as a result of the enlargement of the EU. The substantial variation in inequality, particularly since the recent enlargement, is also con…rmed when looking at the inequality levels in EFI, MI and DPI within the di¤erent member states, which are illustrated in Figure 2.3.1.
0 .2 .4 .6
EU-15 NMS .
SE DK
BE AT
FI FR
NL LU
DE IE
ES IT
UK GR
PT SI
SK CZ
HU CY
PL EE
LT LV
EU
DPI Market
EFI
Figure 2.3.1: Gini income inequality and absolute redistribution
Source: Own calculations based on EU-SILC. Countries are sorted in ascending order of the inequality in DPIs.
The distance between the inequality in EFI and the inequality in DPIs shows
the very di¤erent extent of redistribution schemes across EU member states, here
illustrated by the absolute di¤erence in Gini coe¢ cients. Overall redistribution is
particularly high in the Nordic countries, some Continental countries as well as
2.3. DESCRIPTIVE EVIDENCE 21 in Hungary and Slovenia. These countries achieve substantially better equality rankings in DPI as opposed to EFI. On the contrary, e¤ective redistribution is rather low in Cyprus and in the Baltic States.
Looking at the inequality of EFI, huge disparities among the European coun- tries emerge, with Gini coe¢ cients ranging from 0.31 in the Slovak Republic to 0.54 in Portugal. EFI inequality is comparatively high in the Anglo-Saxon countries as well as in Lithuania, Germany, Greece, Portugal and Hungary, with Gini coe¢ - cients larger than 0.50. Rather low inequality levels can be found in Cyprus, the Slovak Republic and Slovenia. Particularly within the group of Eastern European countries there are substantial di¤erences in EFI inequality levels. The group en- compasses countries with very high EFI inequality such as Hungary and Poland but also countries with comparatively low EFI inequality such as the Slovak Republic and Slovenia. The di¤erences among the Gini coe¢ cients of EFI and the Gini coef-
…cients of MI demonstrates the di¤erent strength of the redistributive character of public pensions across European countries. It emerges that public pensions have huge redistributive power in the Continental countries such as France, Germany and Austria, who now achieve a substantially higher rank in terms of DPI equal- ity. This is also true for Poland and the Czech Republic. On the other hand, the inclusion of public pensions leads to a signi…cantly lower equality ranking for the Baltic states and Denmark.
22Looking at the inequality of DPI, it should be noted that DPI inequality is signi…cantly lower than the EFI inequality, indicating a substantial degree of redistribution in all countries. Also, the ranking of countries according to EFI inequaltiy as opposed to DPI inequalitly changes substantially.
Here the group of Nordic countries can be identi…ed as having very low DPI in- equality (around 0.25), and the Central Eastern European countries Slovenia, the Slovak and the Czech Republic also display low DPI inequality. On the other hand, the distribution of post-government income is comparatively unequal in the Baltic, Southern and Anglo-Saxon countries (>0.30).
These …ndings reveal that with regard to DPI inequality, the importance of public pension schemes and overall redistribution, the EU-15 countries can almost perfectly grouped according to their geographical region and the welfare state ty- pology of the political and social science literature. This is also re‡ected in the similar size of circles in Figure 2.2.1 across regions, which represent the level of DPI inequality in the respective country. In contrast, EFI inequality levels yield a
22As in most of the countries the largest part of SIC serves as …nancing source of public pensions, it could be argued that taking into account the …nancing side of public pensions, however, quali…es the importance of public pensions in reducing income inequality.
very heterogeneous country clustering of EU-15 countries. Interestingly, the East- ern European member states do not really form a homogeneous group of countries.
There appear to be three distinct groups. First, there are the Baltic States which are characterized by high EFI inequality, low redistribution and high inequality in DPIs. In this regard, they are similiar to the Southern European countries, still, their level of redistribution is substantially lower than in the Southern European countries. Second, Hungary and Poland show high EFI inequalities, more extens- ive redistribution schemes and therefore comparatively lower inequality in DPIs.
Third, Slovenia, the Slovak and Czech Republics represent low inequality in EFI, above-average redistribution and very low inequality in DPIs. Therefore, with re- gard to inequality and overall redistribution levels, they are similar to the Nordic and Continental countries.
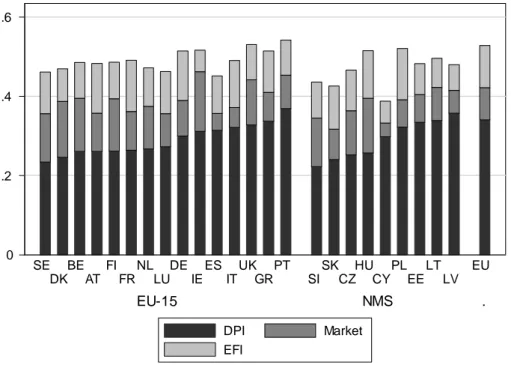
2.3.2 Composition of household income
As a next step we investigate in how far the importance of di¤erent components of the redistributive system varies across European countries. Figure 2.3.2 illustrates the composition of total DPI in terms of factor income, personal income taxes, SIC, social bene…ts and public pensions. Here, we also show the importance of employers’ social insurance contributions in DPI separately in order to visualize our concept of EFI. It should be noted that this perspective does not allow us to identify government budget de…cits or surpluses because major parts of government spending and …nancing are not considered. According to Immervoll et al. (2005), results as in Figure 2.3.2 can be interpreted as showing how much factor income is necessary to achieve a certain level of DPI and how much is deducted by taxes and contributions and added by bene…ts. If the share of factor income is around 100%, then the state approximately ‘gives’the same amount of bene…ts as he ’takes’in form of contributions and personal income taxes.
23If we look at unadjusted factor income without the social insurance contribu- tions of the employer, the majority of countries reveals shares in factor income close to 100%. The share of unadjusted factor income is signi…cantly larger than 105% only in Denmark and the Netherlands, which means that in these countries the sum of deductions outweighs the sum of bene…ts. In Cyprus, France, Hungary and the Slovak Republic the share is less than 95%, therefore on average people receive more bene…ts than they pay as contributions and taxes. If we consider
23Note that indirect taxes are not taken into account here. This explains why it is possible for the share of factor income in total income to be less than 100%.
2.3. DESCRIPTIVE EVIDENCE 23
-.5 0 .5
1 1.5
EU-15 NMS .
AT BE
DE DK
ES FI
FR GR
IE IT
LU NL
PT SE
UK CY
CZ EE
HU LT
LV PL
SI SK
EU
Factor SIC employer Taxes
Total SIC Benefits Pensions
Figure 2.3.2: Factor shares of tax bene…t instruments
Source: Own calculations based on EU-SILC. Note: here we consider the social insurance contributions by
employers and original income separately whereas in the factor shares f in Table 2.4.2 these two are included
in "factor income".