AUS DEM LEHRSTUHL
FÜR DERMATOLOGIE UND VENEROLOGIE PROF. DR. MARK BERNEBURG
DER FAKULTÄT FÜR MEDIZIN DER UNIVERSITÄT REGENSBURG
EXPRESSION OF PROTON-SENSING G-PROTEIN-COUPLED RECEPTORS IN SELECTED SKIN TUMORS
Inaugural – Dissertation zur Erlangung des Doktorgrades
der Medizin der
Fakultät für Medizin der Universität Regensburg
vorgelegt von Anaïs Nassios
2020
Dekan: Prof. Dr. Dirk Hellwig 1. Berichterstatter: Prof. Dr. Stephan Schreml 2. Berichterstatter: PD Dr. Achim Benditz Tag der mündlichen Prüfung: 18.06.2020
Inhaltsverzeichnis
1 Einleitung 1
2 Material und Methoden 3
a Immunhistochemie 3
b Immunfluoreszenz 4
3 Ergebnisse 5
a GPR4 (GPR19) 5
b TDAG8 (GPR65) 5
c OGR1 (GPR68) 6
d G2A (GPR132) 6
4 Zusammenfassung 7
5 Literaturverzeichnis 9
6 Anhang 11
7 Publikation 16
8 Danksagung 22
1 Einleitung
Im Rahmen einer experimentellen Studie wurde mithilfe immunhistochemischer und -fluoreszierender Nachweise das Expressionsprofil membranständiger Protonen- sensitiver G-Protein-gekoppelter Rezeptoren (pH - GPCR) in ausgewählten Hauttumoren untersucht.
Alle pH - GPCRs setzen sich aus einer aus 7 α-Helices bestehenden, in der Zellmembran verankerten Grundstruktur zusammen.1,2 Jeder pH - GPCR wiederum besitzt eine individuelle Selektivität für G-Proteine, die nach Aktivierung ihres zuständigen Rezeptors eine intrazelluläre Kaskade triggern.
Mehr als 300 aller pH - GPCRs sind nicht-olfaktorische Rezeptoren und Angriffspunkt von mehr als 50 % aller aktuell auf dem Markt verfügbaren Medikamente, die direkt oder indirekt mit pH - GPCRs interagieren.3,4
200 von diesen (ungefähr 350) nicht-olfaktorischen pH - GPCRs konnten spezifische Liganden zugeordnet werden, die restlichen 150 pH - GPCRs werden als “verwaiste”
pH - GPCRs bezeichnet, deren natürliche Liganden bislang noch nicht identifiziert werden konnten.4
Beim Menschen sind vier pH - GPCRs bekannt: GPR4 (GPR19), TDAG8 (GPR65, T- cell death-associated gene 8), OGR1 (GPR68, ovarian cancer GPCR1) und G2A (GPR132, G2 accumulation protein).
Von diesen pH - GPCRs weiß man, dass sie daran beteiligt sind, Änderungen extrazellulärer Protonenkonzentrationen in Tumoren zu detektieren und diese nach intrazellulär weiterzuleiten.1,3 Des Weiteren sind sie an Tumorzellproliferation, Apoptose, Metastasierung, Angiogenese, Immunzellfunktion sowie Entzündungsreaktionen beteiligt.3,5-14
Das Wachstum solider Tumoren ist nicht nur durch eine unkontrollierte Proliferation der Tumorzellen charakterisiert, sondern auch durch spezifische Veränderungen im Mikromilieu der Tumoren. So weisen Tumoren beispielsweise einen erhöhten Glucosestoffwechsel auf, dessen Effizienz der ATP-Generierung jedoch maßgeblich von einer adäquaten Sauerstoffversorgung der Tumoren abhängig ist.15 Eine inadäquate Sauerstoffversorgung bei alterierender Vaskularisierung eines Tumors führt dementsprechend zu Hypoxie und die Tumorzellen müssen ATP vorwiegend über die anaerobe Glykolyse bereitstellen (Waarburg-Effekt), was wiederum zur
Akkumulation von saurem Laktat führt.15,16 Mithilfe verschiedener Transporter können Tumorzellen diese anfallenden sauren Substanzen eliminieren. Dazu zählen der Monocarboxylat-Transporter (MCT 1+4), der Na+/ H+-Austauscher 1 (NHE1), die Carboanhydrasen II, IX und XII sowie eine Vakuolen-ATPase (V-ATPase).15,17 Diese Elimination saurer Metabolite führt wiederum dazu, dass Tumorzellen einen höheren intrazellulären pH (7.2 - 7.7) und einen niedrigeren extrazellulären pH (6.2 - 7.0) im Vergleich zu normalen Zellen (pHe 7.2 - 7.4, pHi 6.9 - 7.2) aufweisen. Dies wird auch als umgekehrter oder “inside-out” pH-Gradient (pHe < pHi) bezeichnet.3,15,17,18
Ein vermehrter Glucosemetabolismus in Kombination mit Hypoxie führt in Tumorzellen also über einen Laktatanstieg zu einer Ansäuerung des Extrazellulärraums. Diese Charakteristika scheinen nach aktuellem Stand der Forschung Tumorzellen einen Überlebensvorteil gegenüber normalen Zellen zu verschaffen, da sie mithilfe o.g. Mechanismen den pHi innerhalb des physiologischen Bereiches aufrechterhalten und so einer säurebedingten Apoptose entgehen können.15,19
Dies zeigt, dass Änderungen des pHe in der Mikroumgebung eines Tumors für dessen Wachstum und die Metastasierung essentielle Prozesse sind.3,15,17,18,20
Wie bereits erwähnt, haben die vier pH - GPCRs GPR4, TDAG8, OGR1 und G2A die Fähigkeit, pH-Änderungen in der Mikroumgebung zu detektieren.
Zunächst als Rezeptoren für Lysolipide identifiziert, fand eine Forschergruppe heraus, dass die pH - GPCRs den pHe jedoch über Histidinreste auf ihrer Oberfläche wahrnehmen und durch einen Abfall des pHe aktiviert werden.5
Es ist bekannt, dass die pH - GPCRs an Tumorzellproliferation, Metastasierung, Gefäßneubildungen, Apoptose, Immunzellfunktion und Entzündungsreaktionen beteiligt sind.3,5-14 Noch immer herrscht jedoch Unklarheit über die Expression von GPCRs auf Tumoren und die exakten Mechanismen, mit welchen Krebszellen den pH detektieren und auf ein azidotisches Mikromilieu reagieren.
Obwohl pH - GPCRs in den verschiedensten Geweben exprimiert werden, ist nur wenig über ihre Expression in der Haut und auf verschiedenen Hautkrebsformen bekannt.
Unser Ziel war es, das Vorhandensein der pH - GPCRs GPR4, TDAG8, OGR1 und G2A mithilfe von Immunhistochemie und -fluoreszenz auf folgenden Hauttumoren zu untersuchen:
Merkelzellkarzinom (MCC), pleomorphes dermales Sarkom (PDS), Dermatofibrosarcoma protuberans (DFSP) und atypisches Fibroxanthom (AFX).
Diese Untersuchungen könnten in Zukunft dazu beitragen, mehr Einblick in die Rolle der pH - GPCRs und extrazellulärer Protonen bei Proliferation und Migration o.g.
Tumoren zu erlangen. Basierend auf diesen neuen Erkenntnissen könnten neue, die pH - GPCRs als Target nutzende Therapiemöglichkeiten zur Eindämmung des Tumorwachstums entwickelt werden.
2 Material und Methoden
Für unsere Testungen wurden in Paraffin eingebettete Gewebeproben der o.g.
Tumoren (n = 4, Ausnahmen: PDS GPR4/GPR65 n = 5, AFX GPR132 n = 3) des dermatopathologischen Routinelabors der Klinik und Poliklinik für Dermatologie, Universitätsklinikum Regensburg, benutzt.
a Immunhistochemie
In Paraffin eingebettete und fixierte Gewebeproben sowie Positiv- und Negativkontrollen wurden geschnitten und auf Objektträger aufgebracht. Zudem wurde jeder Objektträger mit Hämatoxylin und Eosin gefärbt. Dieser und alle weiteren Schritte wurden bei Raumtemperatur durchgeführt.
Es folgte die Inkubation der Proben für 30 Minuten bei 72 °C und eine Behandlung mit einer absteigenden Alkoholkonzentration wie folgt:
2 x Xylol für 5 Minuten, 2 x 100 % Ethanol für 5 Minuten, 2 x 96 % Ethanol für 5 Minuten, 2 x 70 % Ethanol für 5 Minuten. Die endogene Peroxidase wurde anschließend mit 3 % H2O2 für 10 Minuten geblockt. Zeitgleich wurde ein saurer Citratpuffer mit pH 6 für 30 Minuten gekocht. Die Proben wurden nun in destilliertem Wasser gewaschen, für 20 Minuten im bereits vorgekochten Citratpuffer gekocht, für 20 Minuten auf Eis gekühlt und zuletzt für 10 Minuten in PBS eingelegt. Danach wurden die Proben in Coverslides eingespannt und ein weiteres Mal mit PBS
gewaschen. Zur Vermeidung unspezifischer Antikörperbindungen wurden die Proteine für 10 Minuten mit einer Blocking-Lösung geblockt. Weiterhin wurden die Gewebeproben mit den primären polyklonalen Antikörpern “rabbit anti-human”
GPR4, GPR65, GPR68 und GPR132 bei 4 °C über Nacht inkubiert.
Am nächsten Tag wurden die Proben dreimal mit PBS gespült. Danach erfolgte die Inkubation mit dem sekundären biotinylierten Antikörper für 30 Minuten, ein erneutes dreimaliges Spülen mit PBS, die Inkubation mit Streptavidin-HRP-Konjugat für 20 Minuten und nochmalig dreimaliges Spülen mit PBS.
Die Positivkontrollen wurden bis zum Eintreten der gewünschten Farbintensität mit AEC plus gefärbt. Die Reaktion wurde mit destilliertem Wasser gestoppt und die Positiv-Kontrollen mit Mayer’s Haemalm gegengefärbt. Analog wurde mit den Gewebeproben und den Negativkontrollen verfahren.
b Immunfluoreszenz
In Paraffin eingebettete und fixierte Gewebeproben wurden geschnitten und auf Objektträger aufgebracht. Dieser und alle weiteren Schritte wurden bei Raumtemperatur durchgeführt. Es folgte die Inkubation der Gewebeproben für 20 Minuten bei 70 °C und eine Behandlung mit einer absteigenden Alkoholkonzentration wie folgt:
2 x Xylol für 5 Minuten, 2 x 100 % Ethanol für 5 Minuten, 2 x 96 % Ethanol für 5 Minuten, 2 x 70 % Ethanol für 5 Minuten.
Danach wurden die Proben mit PBS gewaschen und in Citrat-Tris-EDTA- Pufferlösung überführt, nochmals für 25 Minuten gekocht und zum Abkühlen für 25 Minuten auf Eis gestellt. Die Gewebeproben wurden nun für 10 Minuten in PBS gewaschen und für 15 Minuten in Tris-Glycin-Puffer (Trishydroxymethylaminomethan) zur Vermeidung von Autofluoreszenzen inkubiert.
Danach erfolgte ein erneutes Waschen der Proben in PBS für 10 Minuten.
Zum Blocken unspezifischer Proteine wurden die Proben in 5 % BSA in TBST für 60 Minuten inkubiert. Es folgte die Verdünnung der Primärantikörper in 1% PBST und das Aufbringen auf die Objektträger in folgender Verdünnung: GPR4 1:100, GPR65 1:300, GPR68 1:250, GPR132 1:60.
Nach einer Inkubation der Gewebeproben bei 4 °C über Nacht wurden diese erneut für 15 Minuten mit PBS gewaschen.
Die nachfolgenden Schritte wurden in abgedunkelter Umgebung durchgeführt: Der fluoreszierende Sekundärantikörper (Alexa Fluor 594 goat anti rabbit) wurde mit 1 % BSA in PBST verdünnt und auf die Objektträger aufgebracht. Nach Inkubation für 30 Minuten erfolgte ein erneutes Waschen der Proben mit PBS für 15 Minuten und die Einbettung in DAPI.
3 Ergebnisse
Die Epidermis diente als Referenzstruktur für die Beurteilung der einzelnen Gewebeproben. Peritumorös gelegene Lymphozyten sowie das Epithel der Talgdrüsen, Schweißdrüsen und Gefäße zeigten sich in jeder Färbereihe positiv.
Eine Übersicht der Ergebnisse ist in Tabelle 1, beispielhafte Ergebnisse der Immunhistochemie und -fluoreszenz in Abbildung 1-4 dargestellt.
a GPR4 (GPR19)
Das Merkelzellkarzinom wies keine Expression von GPR4 (GPR19) auf. 50 % der Proben des DFSP waren schwach oder partiell positiv für GPR4, die anderen 50 % der Proben von DFSP zeigten keine Expression von GPR4. 75 % des AFX zeigten eine stark positive, 25 % eine schwach positive Expression von GPR4 auf den Oberflächen der Tumorzellen. 50 % des PDS exprimierten GPR4 stark positiv, 50 % schwach positiv: die Gewebeproben wiesen hier sowohl Tumorzellen auf, die GPR4 exprimierten, wie auch Tumorzellen, die GPR4 nicht exprimierten.
b TDAG8 (GPR65)
Die Auswertung der Expressionsprofile von TDAG8 (GPR65) ergab, dass weder MCC noch DFSP TDAG8 auf der Tumoroberfläche exprimierten. 25 % der AFX wiesen eine stark positive Expression von TDAG8 auf, 25 % der Zellen waren schwach positiv und 50 % negativ für TDAG8. Die mehrkernigen AFX-Riesenzellen zeigten eine stärker positive Expression von TDAG8 als die übrigen AFX-Zellen.
25 % der PDS-Zellen waren stark positiv für TDAG8 auf der Oberfläche, 25 % schwach positiv und 50 % zeigten keinerlei Expression von TDAG8.
c OGR1 (GPR68)
Vorab soll erwähnt sein, dass beide Färbungen (Immunhistochemie und Immunfluoreszenz) von OGR1 (GPR68) äußerst gefleckt erschienen. In Bezug auf das Expressionsprofil von OGR1 wirkten die Ergebnisse der verschiedenen Hauttumoren inhomogen. 25 % der MCC-Zellen zeigten eine stark positive Expression von OGR1, 50 % schienen OGR1 schwächer oder nur partiell zu exprimieren. Die restlichen 25 % zeigten überhaupt keine Expression von OGR1.
50 % der DFSP-Zellen exprimierten OGR1 nur partiell, die übrigen 50 % zeigten keine Expression von OGR1. 50 % der AFX-Zellen zeigten eine positive Expression von OGR1 mit einer stark positiven Expression von OGR1 auf der Oberfläche der mehrkernigen AFX-Riesenzellen. Die übrigen 50 % der AFX-Proben exprimierten OGR1 nicht, jedoch zeigten sich einige positive Zellen innerhalb des Gewebes, bei denen es sich um peritumorös gelegene Lymphozyten handelte. 25 % der PDS exprimierten OGR1 kräftig, 75 % zeigten eine vollständig negative OGR1- Expression.
d G2A (GPR132)
25 % der MCC wiesen eine stark positive Expression von G2A (GPR132) auf. Die übrigen 75 % exprimierten G2A schwach positiv. 50 % der DFSP-Proben zeigten eine positive Expression von G2A, 25 % erschienen schwach oder partiell positiv für G2A und 25 % zeigten keine Expression von G2A auf ihrer Oberfläche. 66,6 % der AFX wiesen eine stark positive Expression auf und 33,3 % eine schwach positive Expression von G2A mit einer insgesamt stärker positiven Expression von G2A auf mehrkernigen AFX-Riesenzellen. Alle PDS-Gewebeproben waren stark positiv für die Expression von G2A auf der Oberfläche der Tumorzellen.
4 Zusammenfassung
In dieser Studie wurden die Expressionsprofile der pH - GPCRs GPR4 (GPR19), TDAG8 (GPR65), OGR1 (GPR68) und G2A (GPR132) auf verschiedenen Hauttumoren untersucht.
Während TDAG8 weder auf dem MCC noch auf dem DFSP exprimiert wurde, zeigte die Hälfte aller untersuchten PDS wie auch AFX eine stark oder zumindest schwach positive Expression von TDAG8, 50 % waren dementsprechend negativ für TDAG8.
Eine klare Aussage über die Expressionsmuster kann lediglich für folgende vier Expressionsprofile getroffen werden: (1) GPR4 wird von allen AFX und PDS exprimiert, (2) G2A ist deutlich exprimiert auf MCC, DFSP, AFX und PDS, (3) GPR4 und TDAG8 werden nicht von MCC exprimiert, und (4) TDAG8 ist nicht exprimiert auf DFSP. Bezüglich AFX und PDS, welche verwandte Pathologien darstellen, zeigten die Ergebnisse ähnliche Expressionsprofile für GPR4, TDAG8, OGR1 und G2A auf AFX und PDS. Jede weitere Kombination von Rezeptor und Hauterkrankung ergab inhomogene Ergebnisse.
Diese durchaus inhomogenen Expressionsprofile könnten nach derzeitigem Wissensstand hinsichtlich der gegensätzlichen Aufgaben der vier pH - GPCRs - auch innerhalb des gleichen Tumors - erklärt werden.3
Es ist bekannt, dass die pH - GPCRs GPR4 (GPR19), TDAG8 (GPR65), OGR1 (GPR68) und G2A (GPR132) durch Protonierung aktiviert werden5 und dass sie an Tumorzellproliferation, Metastasierung, Angiogenese, Apoptose, Immunzellfunktion und Inflammation beteiligt sind - einige in Form der Förderung, einige in Form der Inhibition des Tumorwachstums.3,5-14
Während ein gesteigerter GPR4-Signalweg eine umfangreiche Entzündungsreaktion in menschlichen Gefäßendothelzellen hervorruft3,14, beeinträchtigt ein Mangel an GPR4 das Wachstum muriner Tumorallotransplantate.3,10 Die Überexpression von TDAG8 (GPR65) fördert das Tumorwachstum der Zellen des Lewis Lungenkarzinoms3,21, verhindert jedoch eine Glucocorticoid-induzierte Apoptose in Lymphomzellen von Mäusen.3,22 Die Expression von OGR1 (GPR68) in Zellen des menschlichen Ovarialkarzinoms fördert die Anheftung an extrazelluläre Matrix, verhindert jedoch die Zellproliferation und -migration.3,13 G2A (GPR132) zeigt anti- tumoröse Eigenschaften, indem der Rezeptor den Zellzyklus in der G2/M-Phase stoppt.3,23
Jedoch ist nach aktuellem Stand der Forschung nicht bekannt, welche Umstände und Bedingungen vorliegen müssen, damit ein pH - GPCR tumorfördernd oder tumorhemmend aktiv wird.
Unter Einbeziehung aller Faktoren muss die Rolle von pH - GPCRs in den Hauttumoren MCC, PDS, DFSP und AFX und bei Tumoren im Allgemeinen noch genauer untersucht werden, um eine exaktere Vorstellung über die Wirkung extrazellulärer Protonen als Vermittler von Proliferation und Migration zu erlangen.
Basierend auf der Hypothese, dass die Expression von pH - GPCRs abhängig von Patientengut, Tumorentität wie auch der Mikro- und Makroumgebung des Tumors ist, müssen unsere Ergebnisse mittels einer größeren Stichprobe und verschiedenen Patientenkollektiven verifiziert und die Signaltransduktionskaskaden aufgeklärt werden, um die Rolle der pH - GPCRs genauer zu erforschen. Außerdem könnte die Rolle der einzelnen pH - GPCR mittels CRISPR / Cas9 - basierter Versuche weiter geklärt werden. Das erlangte Wissen kann dann jedoch dazu beitragen, Medikamente zu entwickeln, die agonistisch (tumorunterdrückende pH - GPCRs - Aktivität) oder antagonistisch (tumorfördernde pH - GPCRs - Aktivität) zu den pH - GPCRs agieren, z.B. eine immunmodulatorische Antikörpertherapie.
Unsere Ergebnisse könnten helfen, neue pH - GPCRs - basierte und pH- modifizierende Strategien für innovative Therapien zu entwickeln, um Patienten mit fortgeschrittenen Hauttumoren zu behandeln.
5 Literaturverzeichnis
1. Weiss KT, Fante M, Kohl G, et al. Proton-sensing G protein-coupled receptors as regulators of cell proliferation and migration during tumor growth and
wound healing. Exp Dermatol. 2017;26(2):127-132.
2. Alexander SPH, Mathie A, Peters JA. G Protein-Coupled Receptors. British Journal of Pharmacology. 2011;164(1):5-113.
3. Moraes F, Goes A. A decade of human genome project conclusion: Scientific diffusion about our genome knowledge. Biochem Mol Biol Educ.
2016;44(3):215-223.
4. Im D-S. Orphan G Protein Coupled Receptors and Beyond.pdf.
JpnJPharmacol. 2002;90:101-106.
5. Ludwig MG, Vanek M, Guerini D, et al. Proton-sensing G-protein-coupled receptors. Nature. 2003;425(6953):93-98.
6. Yang LV, Radu CG, Roy M, et al. Vascular abnormalities in mice deficient for the G protein-coupled receptor GPR4 that functions as a pH sensor. Mol Cell Biol. 2007;27(4):1334-1347.
7. Mogi C, Tobo M, Tomura H, et al. Involvement of proton-sensing TDAG8 in extracellular acidification-induced inhibition of proinflammatory cytokine production in peritoneal macrophages. J Immunol. 2009;182(5):3243-3251.
8. Castellone RD, Leffler NR, Dong L, Yang LV. Inhibition of tumor cell migration and metastasis by the proton-sensing GPR4 receptor. Cancer Lett.
2011;312(2):197-208.
9. Chen A, Dong L, Leffler NR, Asch AS, Witte ON, Yang LV. Activation of GPR4 by acidosis increases endothelial cell adhesion through the cAMP/Epac
pathway. PLoS One. 2011;6(11):e27586.
10. Wyder L, Suply T, Ricoux B, et al. Reduced pathological angiogenesis and tumor growth in mice lacking GPR4, a proton sensing receptor. Angiogenesis.
2011;14(4):533-544.
11. Singh LS, Berk M, Oates R, et al. Ovarian cancer G protein-coupled receptor 1, a new metastasis suppressor gene in prostate cancer. J Natl Cancer Inst.
2007;99(17):1313-1327.
12. He XD, Tobo M, Mogi C, et al. Involvement of proton-sensing receptor TDAG8 in the anti-inflammatory actions of dexamethasone in peritoneal macrophages.
Biochem Biophys Res Commun. 2011;415(4):627-631.
13. Ren J, Zhang, L. . Effects of ovarian cancer G protein coupled receptor 1 on the proliferation, migration and adhesion of human ovarian cancer cells. Chin Med J (Engl). 2011;124:1327-1332.
14. Dong L, Li Z, Leffler NR, Asch AS, Chi JT, Yang LV. Acidosis activation of the proton-sensing GPR4 receptor stimulates vascular endothelial cell
inflammatory responses revealed by transcriptome analysis. PLoS One.
2013;8(4):e61991.
15. Neri D, Supuran CT. Interfering with pH regulation in tumours as a therapeutic strategy. Nat Rev Drug Discov. 2011;10(10):767-777.
16. Tomura H, Mogi C, Sato K, Okajima F. Proton-sensing and lysolipid-sensitive G-protein-coupled receptors: a novel type of multi-functional receptors. Cell Signal. 2005;17(12):1466-1476.
17. Webb BA, Chimenti M, Jacobson MP, Barber DL. Dysregulated pH: a perfect storm for cancer progression. Nat Rev Cancer. 2011;11(9):671-677.
18. Cardone RA, Casavola V, Reshkin SJ. The role of disturbed pH dynamics and the Na+/H+ exchanger in metastasis. Nat Rev Cancer. 2005;5(10):786-795.
19. Damaghi M, Wojtkowiak JW, Gillies RJ. pH sensing and regulation in cancer.
Front Physiol. 2013;4:370.
20. Pavlova NN, Thompson CB. The Emerging Hallmarks of Cancer Metabolism.
Cell Metab. 2016;23(1):27-47.
21. Ihara Y, Kihara Y, Hamano F, et al. The G protein-coupled receptor T-cell death-associated gene 8 (TDAG8) facilitates tumor development by serving as an extracellular pH sensor. Proc Natl Acad Sci U S A. 2010;107(40):17309- 17314.
22. Malone MH, Wang Z, Distelhorst CW. The glucocorticoid-induced gene tdag8 encodes a pro-apoptotic G protein-coupled receptor whose activation
promotes glucocorticoid-induced apoptosis. J Biol Chem.
2004;279(51):52850-52859.
23. Weng Z, Fluckiger AC, Nisitani S, et al. A DNA damage and stress inducible G protein-coupled receptor blocks cells in G2/M. Proc Natl Acad Sci USA.
1998;95:12334-12339.
6 Anhang
MCC DFSP AFX PDS
GPR4
(GPR19) 100% - (4/4) 50% + (2/4) 50% - (2/4)
75% ++ (3/4) 25% + (1/4)
60% ++ (3/5) 40% + (2/5) TDAG8
(GPR65) 100% - (4/4) 100% - (4/4)
25% ++ (1/4) 25% + (1/4)
50% - (2/4)
40% ++ (2/5) 20% + (1/5)
40% - (2/5) OGR1
(GPR68)
25% ++ (1/4) 50% + (2/4)
25% - (1/4)
50% + (2/4) 50% - (2/4)
50% + (2/4) 50% - (2/4)
25% ++ (1/4) 75% - (3/4) G2A
(GPR132)
25% ++ (1/4) 75% + (3/4)
50% ++ (2/4) 25% + (1/4)
25% - (1/4)
66,6% ++ (2/3)
33,3% + (1/3) 100% ++ (4/4) Tabelle 1: Zusammenfassung der Ergebnisse für Immunhistochemie und Immunfluoreszenz von Protonen-sensitiven GPCRs auf ausgewählten Hauttumoren:
Ergebnisse der immunhistochemischen und immunfluoreszenten Färbungen für GPR4 (GPR19), TDAG8 (GPR65), OGR1 (GPR68) und G2A (GPR132) auf MCC, DFSP, AFX und PDS. ++: stark positive/ positive Reaktion; +: schwach positive/ partiell positive Reaktion;
-: negative Reaktion; grüne Felder: insgesamt positive Reaktionen; rote Felder: insgesamt negative Reaktionen; weiße Felder: uneinheitliche Reaktionen.
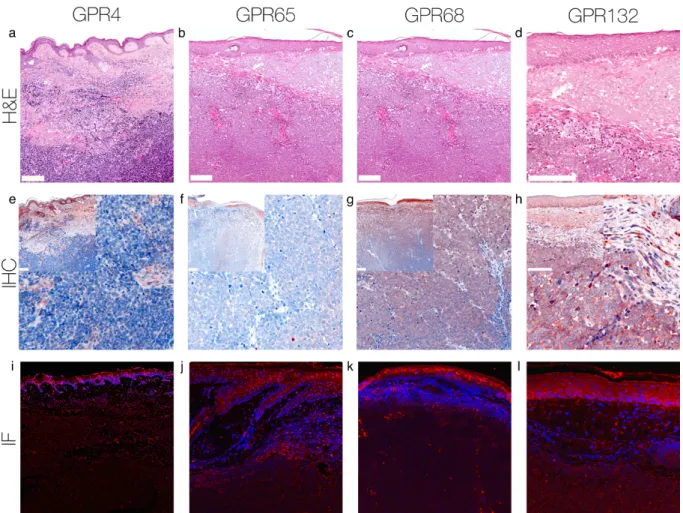
Abbildung 1: Immunhistochemie und Immunfluoreszenz MCC.
Immunhistochemische und immunfluoreszente Färbungen für GPR4, GPR65, GPR68 und GPR132 auf Zellen des MCC. Dieses MCC zeigt keine Expression von GPR4 und GPR65, jedoch erscheinen einzelne peritumorös gelegene Lymphozyten positiv. Die Expression von GPR68 auf den Tumorzellen ist signifikant erhöht - unterhalb der Epidermis stark positiv und innerhalb des Tumors partiell positiv. GPR132 wird von diesem MCC stark exprimiert.
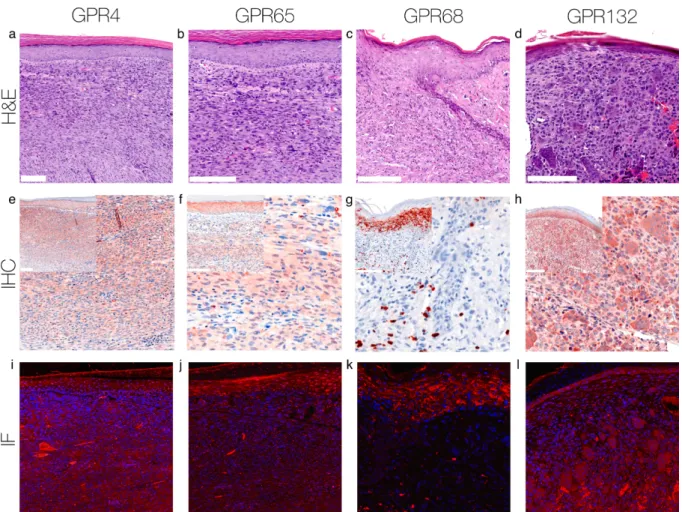
Abbildung 2: Immunhistochemie und Immunfluoreszenz DFSP.
Immunhistochemische und immunfluoreszente Färbung für GPR4, GPR65, GPR68 und GPR132 auf Zellen des DFSP. Dieses DFSP zeigt keine Expression von GPR4 und GPR65, einzig Zellen des Kapillarendothels erscheinen positiv. Die Expression von GPR68 erscheint partiell positiv und die Expression von GPR132 stark positiv.
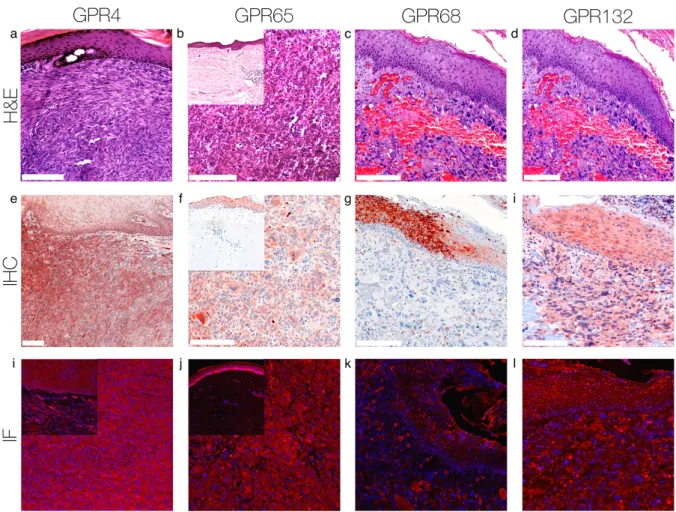
Abbildung 3: Immunhistochemie und Immunfluoreszenz AFX.
Immunhistochemische und immunfluoreszente Färbung für GPR4, GPR65, GPR68 und GPR132 auf Zellen des AFX. Dieses AFX zeigt eine signifikant gesteigerte Expression von GPR4, GPR65 und GPR132 mit einer stark positiven Expression auf mehrkernigen AFX- Riesenzellen. Dieses AFX weist keine Expression von GPR68 auf.
Abbildung 4: Immunhistochemie und Immunfluoreszenz PDS.
Immunhistochemische und immunfluoreszente Färbung für GPR4, GPR65, GPR68 und GPR132 auf Zellen des PDS. Dieses PDS weist eine signifikant gesteigerte Expression von GPR4, GPR65 und GPR132 auf der Oberfläche der Tumorzellen auf. Es zeigt keine
Expression von GPR68.
1 | INTRODUC TION
In 2003, the Human Genome Project has identified 800 receptors with a structure of seven transmembrane α- helices.[1,2]
These heptahelical transmembrane regions are the structural feature of all G-protein- coupled receptors (GPCRs).[2,3] Each GPCR shows a selectivity to G-proteins that trigger an intracellular path- way after the receptor’s activation.[4] More than 300 of the GPCRs Received: 12 June 2018 | Revised: 7 September 2018 | Accepted: 11 October 2018
DOI: 10.1111/exd.13809
P A T T E R N S O F E X P R E S S I O N
Expression of proton- sensing G- protein- coupled receptors in selected skin tumors
Anaïs Nassios1 | Susanne Wallner1 | Sebastian Haferkamp1 | Christoph Klingelhöffer2 | Christoph Brochhausen3 | Stephan Schreml1
1Department of Dermatology, University Medical Center Regensburg, Regensburg, Germany
2Department of Maxillofacial Surgery, University Medical Center Regensburg, Regensburg, Germany
3Institute of Pathology, University Medical Center Regensburg, Regensburg, Germany Correspondence
Stephan Schreml, Department of Dermatology, University Medical Center Regensburg, Regensburg, Germany.
Email: stephan@schreml.de Funding information
The study was supported by a German Research Foundation Grant (SCHR 1288/6- 1).
Abstract
Background: In humans, there are four known proton- sensing G- Protein- coupled re- ceptors (pH- GPCRs): GPR4 (GPR19), TDAG8 (GPR65, T- cell death- associated gene 8), OGR1 (GPR68, ovarian cancer GPCR1) and G2A (GPR132, G2 accumulation protein).
They are known to be involved in sensing changes of extracellular proton concentra- tions in the acidic microenvironment of tumors, which leads to altered cell prolifera- tion, migration, metastasis, immune cell function and inflammation. However, little is known about the expression of pH- GPCRs in the skin and especially skin cancers.
Aim: We studied the expression of pH- GPCRs in selected skin cancers, that is Merkel cell carcinoma (MCC), dermatofibrosarcoma protuberans (DFSP), atypical fibroxan- thoma (AFX) and pleomorphic dermal sarcoma (PDS).
Methods: We did immunohistochemistry and immunofluorescence to analyse the expression of GPR4, TDAG8, OGR1 and G2A using paraffin- embedded tissue sam- ples (n = 4, exceptions: PDS GPR4/GPR65 n = 5, AFX GPR132 n = 3) from patients suffering from MCC, DFSP, AFX and PDS.
Results: (a) GPR4 was expressed on all AFX and PDS specimens. All AFX and MCC showed a positive expression of G2A. All PDS exhibited a strong positive expression of G2A. (b) MCCs neither expressed GPR4 nor TDAG8. All DFSP showed no expres- sion of TDAG8. (c) For any other combination of GPCR and skin disease, we found positive/negative mixed results.
Conclusions: These are the first results on pH- GPCRs in selected skin cancers. We provide evidence that these GPCRs are differentially expressed on the various types of skin cancers and that they can potentially be addressed as a therapeutic target in extensive disease.
K E Y W O R D S
atypical fibroxanthoma, dermatofibrosarcoma protuberans, merkel cell carcinoma, pleomorphic dermal sarcoma
16
| 67
NASSIOS etAl.
are non- olfactory receptors and the target for more than 50% of the drugs currently on the market that act directly or indirectly on GPCRs.[3,5] Among these (approximately 350) non- olfactory GPCRs, 200 GPCRs were matched with ligands whereas the other 150 GPCRs are orphan GPCRs whose natural ligands still remain to be identified.[5]
In humans, there are four known proton- sensing GPCRs: GPR4 (GPR19), TDAG8 (GPR65, T- cell death- associated gene 8), OGR1 (GPR68, ovarian cancer GPCR1) and G2A (GPR132, G2 accumula- tion protein).
These GPCRs are known to be involved in sensing changes of extracellular proton concentrations in tumors.[3]
The tumor microenvironment shows a more acidic extracellular pH (pHe) than normal tissue (pH dysregulation, inside- out pH gradi- ent), in part due to the altered vasculature of tumors, which leads to hypoxia. Thus, the cells provide ATP via a high level of anaerobic glycolysis (Warburg effect) causing the accumulation of lactic acid,[6]
which is then transported to the extracellular space via monocar- boxylate transporters (MCT 1+4).[7,8] Other proteins involved in the pH dysregulation within a tumor are the Na+/H+ exchanger 1 (NHE1), the carbonic anhydrases 2,9 and 12 (CA2, CA9, CA12) and the plasma membrane proton pump vacuolar ATPase (V- ATPase).[7,8]
In summary, the majority of tumors exhibit lower pHe (6.2- 7.0) and higher pHi (7.2- 7.7) compared to normal cells (pHe 7.2- 7.4, pHi 6.9- 7.2), which is known as reversed (=inside- out) pH gradient (pHe <
pHi).[3,7–9]
For tumor growth and metastasis, the microenvironmental changes in pH are essential processes.[3,7–10] According to Tomura et al[6] and Damaghi et al[11] cancer cells seem to be more resis- tant and adjusted to extracellular acidification and maintain the pHi within the physiological range to prevent the cells from cyto- toxic acid. Thus, acidosis is a common physical hallmark of solid tumors.[12]
As mentioned above, the four proton- sensing GPCRs GPR4, TDAG8, OGR1 and G2A sense microenvironmental pH changes.
Initially identified as receptors for lysolipids, however, Ludwig et al[13] found that the GPCRs sense the pHe through histidine resi- dues and that they are activated via a decrease of pHe through the protonation of hydrogen bondings between the histidine residues.
It is known that they are involved in cancer cell proliferation, me- tastasis, angiogenesis, apoptosis, immune cell function and inflam- mation,[3,13–22] but a detailed understanding of the expression of GPCRs and the exact mechanism by which cancer cells sense pH and respond to acidosis still remains unclear.
Although proton- sensing GPCRs are expressed in various tissues, only little is known about their expression in the skin and skin cancer.
In this study, we examine the expression of the proton- sensing GPCRs GPR4, TDAG8, OGR1 and G2A on the following skin cancer types:
Merkel cell carcinoma (MCC), pleomorphic dermal sarcoma (PDS), dermatofibrosarcoma protuberans (DFSP) and atypical fibrox- anthoma (AFX).
These investigations may help to gain more insight into the role of proton- sensing GPCRs and extracellular protons concerning prolif- eration and migration of the above- mentioned skin cancers. Based on these new insights, novel therapies targeting these GPCRs could be re- vealed in order to inhibit tumor growth.
2 | MATERIAL S AND METHODS
For our experiments, we used paraffin- embedded tissue samples (n = 4, exceptions: PDS GPR4/GPR65 n = 5, AFX GPR132 n = 3) from the dermatopathological routine of the Department of Dermatology, University Medical Center Regensburg. An overview of basal data about the patients the samples were taken from can be found in table S1.
2.1 | Immunohistochemistry
Tissues embedded and fixed in paraffin as well as positive and nega- tive controls were sectioned and superimposed on slides. Each slide was also stained with haematoxylin and eosin. This and all other following staining steps were performed at room temperature.
Tissue sections were incubated for 30 minutes at 72°C and then treated with decreasing alcohol concentration as follows: 2 × Xylol for 5 minutes, 2 × 100% ethanol for 5 minutes, 2 × 96% etha- nol for 5 minutes, 2 × 70% ethanol for 5 minutes. Endogenous per- oxidase was blocked with 3% H2O2 (No. 1404697; Fisher Scientific, Waltham, MA, USA) for 10 minutes. Simultaneously, an acidic citrate buffer pH 6 (REF ZUC028; Zytomed, Berlin, Germany) was boiled for 30 minutes. The slides were washed in distilled water and then boiled for 20 minutes in the precooked citrate buffer, then cooled on ice for 20 minutes and transferred to PBS (No. D8537; Sigma- Aldrich, St.Louis, MO, USA) for 10 minutes. Afterwards, slides were fixed in coverslides and once again washed with PBS. To avoid un- specific antibody binding, proteins were blocked with blocking solu- tion (ZytoChem Plus HRP Kit/Rabbit, Zytomed, REF HRP060- Rb) for 10 minutes. Tissue sections were further incubated with the primary rabbit anti- human GPR4 (1:200- 1:300; Abcam, Anti- GPCR GPR4 antibody, No. ab188606), GPR65 (1:500- 1:600; Abcam, Anti- GPCR GPR65 antibody, No. ab188907), GPR68 (1:50; Abcam, Anti- OGR1 antibody—Cytoplasmic domain, No. ab188964) and GPR132 (1:60;
Abcam, Anti- GPCR G2A antibody, No. ab116586) polyclonal anti- bodies at 4°C overnight.
The following day, the slides were washed three times with PBS. The tissue sections were then incubated with the second- ary biotinylated antibody for 30 minutes, they were washed again three times with PBS, then incubated with streptavidin- HRP con- jugate for 20 minutes and washed another three times with PBS.
Positive- controls were stained with AEC plus (No. K 3469; Dako, Santa Clara, CA, USA) until the requested staining appeared.
Reaction was stopped with distilled water and positive- controls were counterstained with Mayer’s Haemalm (Roth, No. T865.3).
68 | NASSIOS etAl.
Analog procedure was performed with tissue sections and nega- tive controls.
2.2 | Immunofluorescence
Tissues embedded and fixed in paraffin were sectioned and super- imposed on slides. This and all following steps were performed at room temperature. Tissue sections were incubated for 20 minutes at 70°C and then treated with decreasing alcohol concentration as fol- lows: 2 × Xylol for 5 minutes, 2 × 100% ethanol for 5 minutes, 2 × 96%
ethanol for 5 minutes, 2 × 70% ethanol for 5 minutes. Afterwards, the slides were washed with PBS, transferred to a citrate- tris- EDTA buffer (No. ZUCO29- 100; Zytomed), boiled for 25 minutes and then cooled on ice for 25 minutes. Tissue sections were washed in PBS for 10 minutes, incubated for 15 minutes in tris- glycine buffer (Trishydroxymethylaminomethan: Merck, No. 8382.0500; Glycine:
Merck, Darmstadt, Germany; No. 1.04201.1000) to avoid autofluo- rescence and washed again in PBS for 10 minutes. To block unspecific proteins, the slides were incubated with 5% BSA (No. A7030- 100g;
Sigma) in TBST (Trishydroxymethylaminomethan: Merck, No.
8382.0500; Tween: Roth, No. 9127.1) for 60 minutes. The primary antibodies were then diluted in 1% PBST and applied to the slides (GPR4 1:100, GPR65 1:300, GPR68 1:250, GPR132 1:60). After the tissue sections were incubated at 4°C overnight, they were washed with PBS for 15 minutes. The following steps were all performed in a darkened environment.
The fluorescent secondary antibody (Alexa Fluor 594 goat anti rabbit; No. A11037; Life Technologies, Waltham, MA, USA) was diluted with 1% BSA in PBST and applied to the slides. After an incubation for 30 minutes, the tissue sections were washed with PBS for 15 minutes and stained and embedded in DAPI (Roth, No.
3 | RESULTS
The epidermis served as a reference structure for the assessment of every single tissue sample. Peritumoral lymphocytes and the epithe- lium of sebaceous glands, sweat glands and vessels appeared positive in every staining. An overview of the results can be found in Table 1. The staining results for the four tumor entities are shown in Figures 1-4 and Figures S1-S13 (MCC: Figure 1, Figures S1-3, DFSP: Figure 2, Figures S4-6, AFX: Figure 3, Figures S7-9, PDS: Figure 4, Figures S10-13).
3.1 | GPR4 (GPR19)
Merkel cell carcinomas showed no expression of GPR4 (GPR19).
50% of the DFSP tissue samples were weak or partial positive for the expression of GPR4, the others showed no expression of GPR4.
75% of the AFX showed a strong positive and 25% a weak positive expression of GPR4 on the surface of tumor cells. 50% of PDS tissue samples strongly expressed GPR4. The other 50% of PDS exhibited a weak positive expression of GPR4: the tissue samples consisted both positive and negative GPR4- expressing tumor cells.
3.2 | TDAG8 (GPR65)
The evaluation of the TDAG8 expression- profile showed that nei- ther MCC nor DFSP expressed TDAG8 on the surface of tumor cells.
25% of the AFX cells showed strong TDAG8 expression, 25% of the cells were weak positive and the other 50% negative for TDAG8.
The multinuclear giant AFX cells presented a stronger positive ex- pression of TDAG8 than the other AFX cells. 25% of the PDS cells TA B L E 1 Summary of results for Immunohistochemistry and
Immunofluorescence of proton- sensing GPCRs on selected skin cancers
MCC DFSP AFX PDS
GPR4 (GPR19)
100%−(4/4) 50%+(2/4) 50%−(2/4)
75%++(3/4) 25%+(1/4)
60%++(3/5) 40%+(2/5) TDAG8
(GPR65)
100%−(4/4) 100%−(4/4) 25%++(1/4) 25%+(1/4) 50%−(2/4)
40%++(2/5) 20%+(1/5) 40%−(2/5) OGR1
(GPR68)
25%++(1/4) 50%+(2/4) 25%−(1/4)
50%+(2/4) 50%−(2/4)
50%+(2/4) 50%−(2/4)
25%++(1/4) 75%−(3/4)
G2A (GPR132)
25%++(1/4) 75%+(3/4)
50%++(2/4) 25%+(1/4) 25%−(1/4)
66.6%++
(2/3) 33.3%+(1/3)
100%++
(4/4)
Results of immunohistochemical and immunofluorescent staining for GPR4 (GPR19), TDAG8 (GPR65), OGR1 (GPR68) and G2A (GPR132) on MCC, DFSP, AFX and PDS. ++: strong positive/positive reaction; +: weak positive/ partial positive reaction; −: negative reaction; green boxes:
overall positive reactions; red boxes: overall negative reactions; white boxes: mixed reactions.
F I G U R E 1 Immunohistochemistry and Immunofluorescence of MCC. Immunohistochemical and immunofluorescent staining for GPR4, GPR65, GPR68 and GPR132 on MCC cells. This MCC shows no expression of GPR4 and GPR65, only several peritumoral lymphocytes appeared to be positive. The expression of GPR68 is significantly increased on tumor cells that appear to be strong positive below the epidermis and partial positive within the tumor.
GPR132 is strongly expressed on this MCC. For additional stainings (A )
(E)
(I)
(B )
(F)
(J) (K) (L)
(D ) (C )
(G) (H )
| 69
NASSIOS etAl.
strongly expressed TDAG8 on their surface, 25% showed a weak positive and the other 50% no expression of TDAG8.
3.3 | OGR1 (GPR68)
It has to be mentioned that both stainings (IHC and IF) of OGR1 (GPR68) appeared extremely speckled. With regard to the
for every type of skin cancer. 25% of the MCC cells showed a strong positive expression of OGR1, 50% seemed to express OGR1 weaker or only partial. The other 25% did not express OGR1 at all. As re- gards the expression of OGR1 on DFSP cells, about 50% of the cells partially expressed OGR1 and 50% of the cells were negative for the expression of OGR1. 50% of the AFX cells showed a positive expres- sion of OGR1 with an even stronger positive expression of OGR1 on the surface of multinuclear giant AFX cells. The other 50% did not express OGR1 but there were some positive cells within the tissue samples, which appeared to be peritumoral lymphocytes. 25% of the PDS samples strongly expressed OGR1, and 75% of the PDS tissue samples presented a completely negative OGR1- expression.
3.4 | G2A (GPR132)
Twenty five percentage of the MCCs showed a strong positive ex- pression of G2A (GPR132). The other 75% exhibited a weak posi- tive expression of G2A. 50% of the DFSP tissue samples presented a clearly positive expression of G2A, 25% appeared to be weak or partial positive for G2A and the other 25% showed no expression of G2A. In 66.6%, the AFX showed a strong and in 33.3% a weak posi- tive expression of G2A with an overall stronger expression of G2A on multinuclear giant cells. All PDS exhibited a strong expression of G2A on the surface of the tumor cells.
4 | DISCUSSION
Here, we have studied the expression of GPCRs GPR4 (GPR19), TDAG8 (GPR65), OGR1 (GPR68) and G2A (GPR132) on different F I G U R E 2 Immunohistochemistry and Immunofluorescence of
DFSP. Immunohistochemical and immunofluorescent staining for GPR4, GPR65, GPR68 and GPR132 on DFSP cells. The DFSP shows no expression of GPR4 and GPR65, only the capillary endothelial cells appear to be positive. The expression of GPR68 is partial positive and GPR132 is expressed strongly on the tumor cells. For additional stainings of the other DFSP, see Figures S4-6
(A )
(E)
(I)
(B )
(F)
(J) (K) (L)
(D ) (C )
(G) (H )
F I G U R E 3 Immunohistochemistry and Immunofluorescence of AFX. Immunohistochemical and immunofluorescent staining for GPR4, GPR65, GPR68 and GPR132 on AFX cells. The expression of GPR4, GPR65 and GPR132 is significantly increased on AFX and it shows strong positive expression on multinuclear giant tumor cells.
The AFX shows no expression of GPR68. For additional stainings of the other AFX, see Figures S7-9
(A )
(E)
(I)
(B )
(F)
(J) (K) (L)
(D ) (C )
(G) (H )
F I G U R E 4 Immunohistochemistry and Immunofluorescence of PDS. Immunohistochemical and immunofluorescent staining for GPR4, GPR65, GPR68 and GPR132 on PDS cells. This PDS shows a significantly increased expression of GPR4, GPR65 and GPR132 on the surface of tumor cells. In contrast, there is no expression of GPR68. For additional stainings of the other PDS, see Figures S10-13
(A )
(E)
(I)
(B )
(F)
(J) (K) (L)
(D ) (C )
(G) (H )
70 | NASSIOS etAl.
While MCC and DFSP did not express TDAG8, half of the studied PDS and AFX were strong or at least weak positive, 50% negative for TDAG8, respectively.
A final statement on expression patterns can only be given for four expression profiles: (a) GPR4 is expressed on all AFX and PDS, (b) G2A is clearly expressed on MCC, DFSP, AFX and PDS, (c) GPR4 and TDAG8 are not expressed on MCC, (d) and TDAG8 is not ex- pressed on DFSP. As AFX and PDS are related pathologies, our re- sults show similar expression profiles of GPR4, TDAG8, OGR1 and G2A on AFX and PDS. For any other combination of receptor and skin disease, we found mixed results.
These very inhomogeneous expression profiles might be ex- plained by the current knowledge about the opposing roles of the four proton- sensing GPRCs, even in the same tumors.[3]
It is known that the GPCRs GPR4 (GPR19), TDAG8 (GPR65), OGR1 (GPR68) and G2A (GPR132) are activated via protonation[13] and that they are involved in cancer cell proliferation, metastasis, angiogen- esis, apoptosis, immune cell function and inflammation—some in a tumor- promoting and some in a tumor- suppressing pattern.[3,13–22]
While an increased GPR4 signalling induced a broad inflammatory response in human vascular endothelial cells,[3,22] the deficiency of GPR4 impairs the growth of murine tumor allografts.[3,18] The over- expression of TDAG8 (GPR65) is known to enhance tumor growth in Lewis lung carcinoma cells,[3,23] but promotes glucocorticoid- induced apoptosis in mouse lymphoma cells.[3,24] Expression of OGR1 (GPR68) in human ovarian cancer cells enhances the cell ad- hesion to extracellular matrix, but inhibits cell proliferation and mi- gration[3,21] and G2A (GPR132) is known to show anti- tumorigenic properties by cell cycle arrest at G2/M stage.[3,25] However, based on the current state of research the circumstances and conditions that induce pro- tumorigenic or anti- tumorigenic GPCR- activity yet remain unknown.
Taking everything into account, the role of proton- sensing GPCRs in MCC, PDS, DFSP and AFX and in tumors in general needs to be researched in more detail to gain further insights into the role of extracellular protons as messengers of proliferation and migration. Based on the hypothesis that the expression of GPCRs varies between patients, type of cancer and micro- and macroenvironmental circumstances, our findings need to be ver- ified by a larger sample size and by the creation of different pa- tient collectives to investigate the different roles of GPCRs more precisely. Moreover, the circumstances and conditions that in- duce tumor- promoting or tumor- suppressing GPCR- activity need to be researched in more detailed. This knowledge could help to develop drugs interacting with the pH- GPCRs in an agonistic (anti- tumorigenic GPCR- activity) or antagonistic (pro- tumorigenic GPCR- activity) way, for example immunomodulatory antibody therapy. This might especially be of relevance in case of tumor- igenic overexpression of certain pH- GPCRs. However, activating antibodies could also be used in case of down- regulated expres- sion of anti- tumorigenic properties of distinct pH- GPCRs. These therapies could be used to treat patients with advanced or exten-
CONFLIC T OF INTERE S T
The authors have declared no conflicting interests.
AUTHOR CONTRIBUTION
AN, SW, CB and SS performed the research. AN, CK, CB, SH and SS analysed data. SS designed the study and obtained grant support.
ORCID
Stephan Schreml http://orcid.org/0000-0002-2820-1942
R E FE R E N C E S
[1] F. Moraes, A. Goes, Biochem. Mol. Biol. Educ. 2016, 44, 215.
[2] S. P. H. Alexander, A. Mathie, J. A. Peters, Br. J. Pharmacol. 2011, 164, 5.
[3] K. T. Weiss, M. Fante, G. Köhl, J. Schreml, F. Haubner, M. Kreutz, S. Haverkampf, M. Berneburg, S. Schreml, Exp. Dermatol. 2017, 26, 127.
[4] G. Löffler, P. E. Petrides, P. C. Heinrich, Biochemie und Pathobiochemie, Springer, Berlin Heidelberg 2006.
[5] D.-S. Im, Jpn. J. Pharmacol. 2002, 90, 101.
[6] H. Tomura, C. Mogi, K. Sato, F. Okajima, Cell. Signal. 2005, 17, 1466.
[7] D. Neri, C. T. Supuran, Nat. Rev. Drug Discov. 2011, 10, 767.
[8] B. A. Webb, M. Chimenti, M. P. Jacobson, D. L. Barber, Nat. Rev.
Cancer 2011, 11, 671.
[9] R. A. Cardone, V. Casavola, S. J. Reshkin, Nat. Rev. Cancer 2005, 5, 786.
[10] N. N. Pavlova, C. B. Thompson, Cell Metab. 2016, 23, 27.
[11] M. Damaghi, J. W. Wojtkowiak, R. J. Gillies, Front. Physiol. 2013, 4, 370.
[12] C. R. Justus, L. Dong, L. V. Yang, Front. Physiol. 2013, 4, 354.
[13] M. G. Ludwig, M. Vanek, D. Guerini, J. A. Gasser, C. E. Jones, U.
Junker, H. Hofstetter, R. M. Wolf, K. Seuwen, Nature 2003, 425, 93.
[14] L. V. Yang, C. G. Radu, M. Roy, S. Lee, J. McLaughlin, M. A. Teitell, M.
L. Iruela-Arispe, O. N. Witte, Mol. Cell. Biol. 2007, 27, 1334.
[15] C. Mogi, M. Tobo, H. Tomura, N. Murata, X. D. He, K. Sato, T.
Kimura, T. Ishizuka, T. Sasaki, T. Sato, Y. Kihara, S. Ishii, A. Harada, F.
Okajima, J. Immunol. 2009, 182, 3243.
[16] R. D. Castellone, N. R. Leffler, L. Dong, L. V. Yang, Cancer Lett. 2011, 312, 197.
[17] A. Chen, L. Dong, N. R. Leffler, A. S. Asch, O. N. Witte, L. V. Yang, PLoS ONE 2011, 6, e27586.
[18] L. Wyder, T. Suply, B. Ricoux, E. Billy, C. Schnell, B. U. Baumgarten, S.
M. Maira, C. Koelbing, M. Ferretti, B. Kinzel, M. Müller, K. Seuwen, M. G. Ludwig, Angiogenesis 2011, 14, 533.
[19] L. S. Singh, M. Berk, R. Oates, Z. Zhao, H. Tan, Y. Jiang, A. Zhou, K.
Kirmani, R. Steinmetz, D. Lindner, Y. Xu, J. Natl Cancer Inst. 2007, 99, 1313.
[20] X. D. He, M. Tobo, C. Mogi, T. Nakakura, M. Komachi, N. Murata, M. Takano, H. Tomura, K. Sato, F. Okajima, Biochem. Biophys. Res.
Commun. 2011, 415, 627.
[21] J. Ren, L. Zhang, Chin. Med. J. 2011, 124, 1327.
[22] L. Dong, Z. Li, N. R. Leffler, A. S. Asch, J. T. Chi, L. V. Yang, PLoS ONE 2013, 8, e61991.
[23] Y. Ihara, Y. Kihara, F. Hamano, K. Yanagida, Y. Morishita, A. Kunita, T. Yamori, M. Fukayama, H. Aburatani, T. Shimizu, S. Ishii, Proc. Natl.
Acad. Sci. U. S. A. 2010, 107, 17309.
[24] M. H. Malone, Z. Wang, C. W. Distelhorst, J. Biol. Chem. 2004, 279,
| 71
NASSIOS etAl.
[25] Z. Weng, A. C. Fluckiger, S. Nisitani, M. I. Wahl, L. Q. Le, C. A.
Hunter, A. A. Fernal, M. M. Le Beau, O. N. Witte, Proc. Natl. Acad.
Sci. U. S. A. 1998, 95, 12334.
SUPP ORTING INFORMATION
Additional supporting information may be found online in the Supporting Information section at the end of the article.
Figure S1. Immunohistochemistry and Immunofluorescence of MCC. Immunohistochemical and immunofluorescent staining for GPR4, GPR65, GPR68 and GPR132 on MCC cells. The MCC shows no expression of GPR4 and GPR65. There is a weak positive ex- pression of GPR68 and GPR132. a- l: patient 1; scale bar = 200 μm.
Figure S2. Immunohistochemistry and Immunofluorescence of MCC.
Immunohistochemical and immunofluorescent staining for GPR4, GPR65, GPR68 and GPR132 on MCC cells. There is no expression of GPR4, GPR65 and GPR68 on tumorous cells. The MCC shows a weak positive expression of GPR132. a- l: patient 3; scale bar = 200 μm.
Figure S3. Immunohistochemistry and Immunofluorescence of MCC.
Immunohistochemical and immunofluorescent staining for GPR4, GPR65, GPR68 and GPR132 on MCC cells. The MCC shows no expression of GPR4 and GPR65. The tumor cells show a partial positive expression of GPR68 and GP132. a,e,i: patient 1; b,f,j,c,g,k,d,h,l: patient 4; scale bar = 200 μm.
Figure S4. Immunohistochemistry and Immunofluorescence of DFSP. Immunohistochemical and immunofluoresscent stain- ing for GPR4, GPR65, GPR68 and GPR132 on DFSP cells.
The DFSP shows no expression of GPR4, GPR65 and GPR68.
It shows a significantly increased expression of GPR132 on the surface of tumor cells. a- l: patient 18; scale bar = 200 μm.
Figure S5. Immunohistochemistry and Immunofluorescence of DFSP. Immunohistochemical and immunofluorescent stain- ing for GPR4, GPR65, GPR68 and GPR132 on DFSP cells. The DFSP shows a weak positive expression of GPR4. The other DFSP cells do not express GPR65, GPR68 and GPR132. a- l: pa- tient 19; scale bar = 200 μm, except e+f: scale bar = 500 μm.
Figure S6. Immunohistochemistry and Immunofluorescence of DFSP. Immunohistochemical and immunoflorescent staining for GPR4, GPR65, GPR68 and GPR132. The DFSP shows a weak pos- itive expression of GPR4 and no expression of GPR65. There is a weak positive expression of GPR68 and a partial positive expres- sion of GPR132 that shows a weaker positive expression below the epidermis and a stronger positive expression within the tumor.
b,f,j: patient 17, a,e,i,c,g,k,d,h,l: patient 20; scale bar = 200 μm.
Figure S7. Immunohistochemistry and Immunofluorescence of AFX. Immunohistochemical and immunofluorescent stain- ing for GPR4, GPR65, GPR68 and GPR132 on AFX cells. The AFX shows a weak positive expression of GPR4 and no expression
of GPR65. The expression of GPR68 and GPR132 is weak pos- itive on the surface of tumor cells. a- l: patient 5; scale bar = 200 μm.
Figure S8. Immunohistochemistry and Immunofluorescence of AFX. Immunohistochemical and immunofluorescent stain- ing for GPR4, GPR65, GPR68 and GPR132 on AFX cells.
The expression of GRP4 and GPR132 is significantly in- creased on AFX. There is no expression of GPR65 and GPR68.
Figure S9. Immunohistochemistry and Immunofluorescence of AFX.
Immunohistochemical and immunofluorescent staining for GPR4, GPR65, GPR68 and GPR132 on AFX cells. The AFX shows a signifi- cantly increased expression of GPR4 and GPR65 and a weak positive expression of GPR68 with an overall stronger expression on multinu- clear giant cells. a,d,g: patient 7; b,e,h,c,f,i: patient 9; scale bar = 200 μm.
Figure S10. Immunohistochemistry and Immunofluorescence of PDS. Immunohistochemical and immunofluorescent stain- ing for GPR4, GPR65, GPR68 and GPR132 on PDS cells. The PDS shows a significantly increased expression of GPR4, GPR68 and GPR132. In contrast, there is no expression of GPR65.
a,e,i,b,f,j: patient 11; c,g,k,d,h,l: patient 12; scale bar = 200 μm.
Figure S11. Immunohistochemistry and Immunofluorescence of PDS. Immunohistochemical and immunofluorescent staining for GPR4, GPR65, GPR68 and GPR132 on PDS cells. The expres- sion of GPR4, GPR65 and GPR132 is significantly increased on tumor cells. The PDS shows no expression of GPR68, only sev- eral peritumoral lymphocytes appear to be positive. a,e,i: patient 12; b,f,j,d,h,l: patient 16; c,g,k: patient 15; scale bar = 200 μm.
Figure S12. Immunohistochemistry and Immunofluorescence of PDS.
Immunohistochemical and immunofluorescent staining for GPR4, GPR65, GPR68 and GPR132 on PDS cells. The PDS shows a weak positive expres- sion of GPR4 and GPR65. There is no expression of GPR68. GPR132 is expressed strongly on the tumor cells. a- l: patient 13; scale bar = 200 μm.
Figure S13. Immunhistochemistry and Immunofluorescence of PDS.
Immunohistochemical and immunofluorescent staining for GPR4 and GPR65 on PDS cells. The PDS shows a weak positive expression of GPR4 and no expression of GPR65. a- f: patient 14.
Table S1. Overview of general patient data. Overview of age, gender, disease and location of the tumor the stained tissue samples were taken from.
How to cite this article: Nassios A, Wallner S, Haferkamp S, Klingelhöffer C, Brochhausen C, Schreml S. Expression of proton- sensing G- protein- coupled receptors in selected skin tumors. Exp Dermatol. 2019;28:66–71. https://doi.org/10.1111/
exd.13809
8 Danksagung
In erster Linie möchte ich mich bei meinem Doktorvater Prof. Dr. Stephan Schreml, Oberarzt der Klinik und Poliklinik für Dermatologie des Universitätsklinikums Regensburg für die Vergabe dieses spannenden Themas und seine unermüdliche Unterstützung und fortwährende Motivation während der Anfertigung dieser Arbeit herzlich bedanken. Die konstruktiven Gespräche, fachlichen Ratschläge und das in mich gesetzte Vertrauen haben maßgeblich zum erfolgreichen Abschluss der Arbeit beigetragen.
Ein besonderer Dank gilt Susanne Wallner, die mich während der Arbeit im Labor tatkräftig und mit vollem Einsatz unterstützt hat. Vielen Dank für die Geduld und das liebevolle Verständnis!
Nicht zuletzt bedanke ich mich aus tiefstem Herzen bei meiner Familie und meinem Partner. Aus eurer bedingungslosen Liebe und Unterstützung konnte ich all meine Energie schöpfen.